
|
|||||
|
 | |
| |
| |
| |
| |
| |
|
Gene: XPO4 |
Gene summary for XPO4 |
| Gene information | Species | Human | Gene symbol | XPO4 | Gene ID | 64328 |
| Gene name | exportin 4 | |
| Gene Alias | exp4 | |
| Cytomap | 13q12.11 | |
| Gene Type | protein-coding | GO ID | GO:0006611 | UniProtAcc | Q9C0E2 |
Top |
Malignant transformation analysis |
| Identification of the aberrant gene expression in precancerous and cancerous lesions by comparing the gene expression of stem-like cells in diseased tissues with normal stem cells |
| Entrez ID | Symbol | Replicates | Species | Organ | Tissue | Adj P-value | Log2FC | Malignancy |
| 64328 | XPO4 | CCI_1 | Human | Cervix | CC | 4.42e-04 | 4.64e-01 | 0.528 |
| 64328 | XPO4 | CCI_2 | Human | Cervix | CC | 3.84e-11 | 9.35e-01 | 0.5249 |
| 64328 | XPO4 | CCI_3 | Human | Cervix | CC | 6.83e-15 | 7.50e-01 | 0.516 |
| 64328 | XPO4 | HTA11_2487_2000001011 | Human | Colorectum | SER | 5.28e-03 | -4.58e-01 | -0.1808 |
| 64328 | XPO4 | HTA11_3361_2000001011 | Human | Colorectum | AD | 1.59e-02 | -3.59e-01 | -0.1207 |
| 64328 | XPO4 | HTA11_99999965104_69814 | Human | Colorectum | MSS | 5.83e-09 | 7.66e-01 | 0.281 |
| 64328 | XPO4 | A001-C-207 | Human | Colorectum | FAP | 3.58e-08 | -3.96e-01 | 0.1278 |
| 64328 | XPO4 | A015-C-203 | Human | Colorectum | FAP | 4.92e-27 | -5.17e-01 | -0.1294 |
| 64328 | XPO4 | A015-C-204 | Human | Colorectum | FAP | 1.02e-07 | -3.86e-01 | -0.0228 |
| 64328 | XPO4 | A014-C-040 | Human | Colorectum | FAP | 1.96e-03 | -3.02e-01 | -0.1184 |
| 64328 | XPO4 | A002-C-201 | Human | Colorectum | FAP | 1.09e-18 | -5.09e-01 | 0.0324 |
| 64328 | XPO4 | A002-C-203 | Human | Colorectum | FAP | 1.85e-04 | -2.82e-01 | 0.2786 |
| 64328 | XPO4 | A001-C-119 | Human | Colorectum | FAP | 2.49e-13 | -5.99e-01 | -0.1557 |
| 64328 | XPO4 | A001-C-108 | Human | Colorectum | FAP | 7.88e-17 | -4.08e-01 | -0.0272 |
| 64328 | XPO4 | A002-C-205 | Human | Colorectum | FAP | 1.09e-23 | -5.04e-01 | -0.1236 |
| 64328 | XPO4 | A001-C-104 | Human | Colorectum | FAP | 1.11e-06 | -4.21e-01 | 0.0184 |
| 64328 | XPO4 | A015-C-005 | Human | Colorectum | FAP | 1.07e-04 | -2.99e-01 | -0.0336 |
| 64328 | XPO4 | A015-C-006 | Human | Colorectum | FAP | 3.74e-15 | -2.75e-01 | -0.0994 |
| 64328 | XPO4 | A015-C-106 | Human | Colorectum | FAP | 1.17e-10 | -3.67e-01 | -0.0511 |
| 64328 | XPO4 | A002-C-114 | Human | Colorectum | FAP | 7.32e-23 | -5.97e-01 | -0.1561 |
| Page: 1 2 3 4 5 |
| Tissue | Expression Dynamics | Abbreviation |
| Cervix | 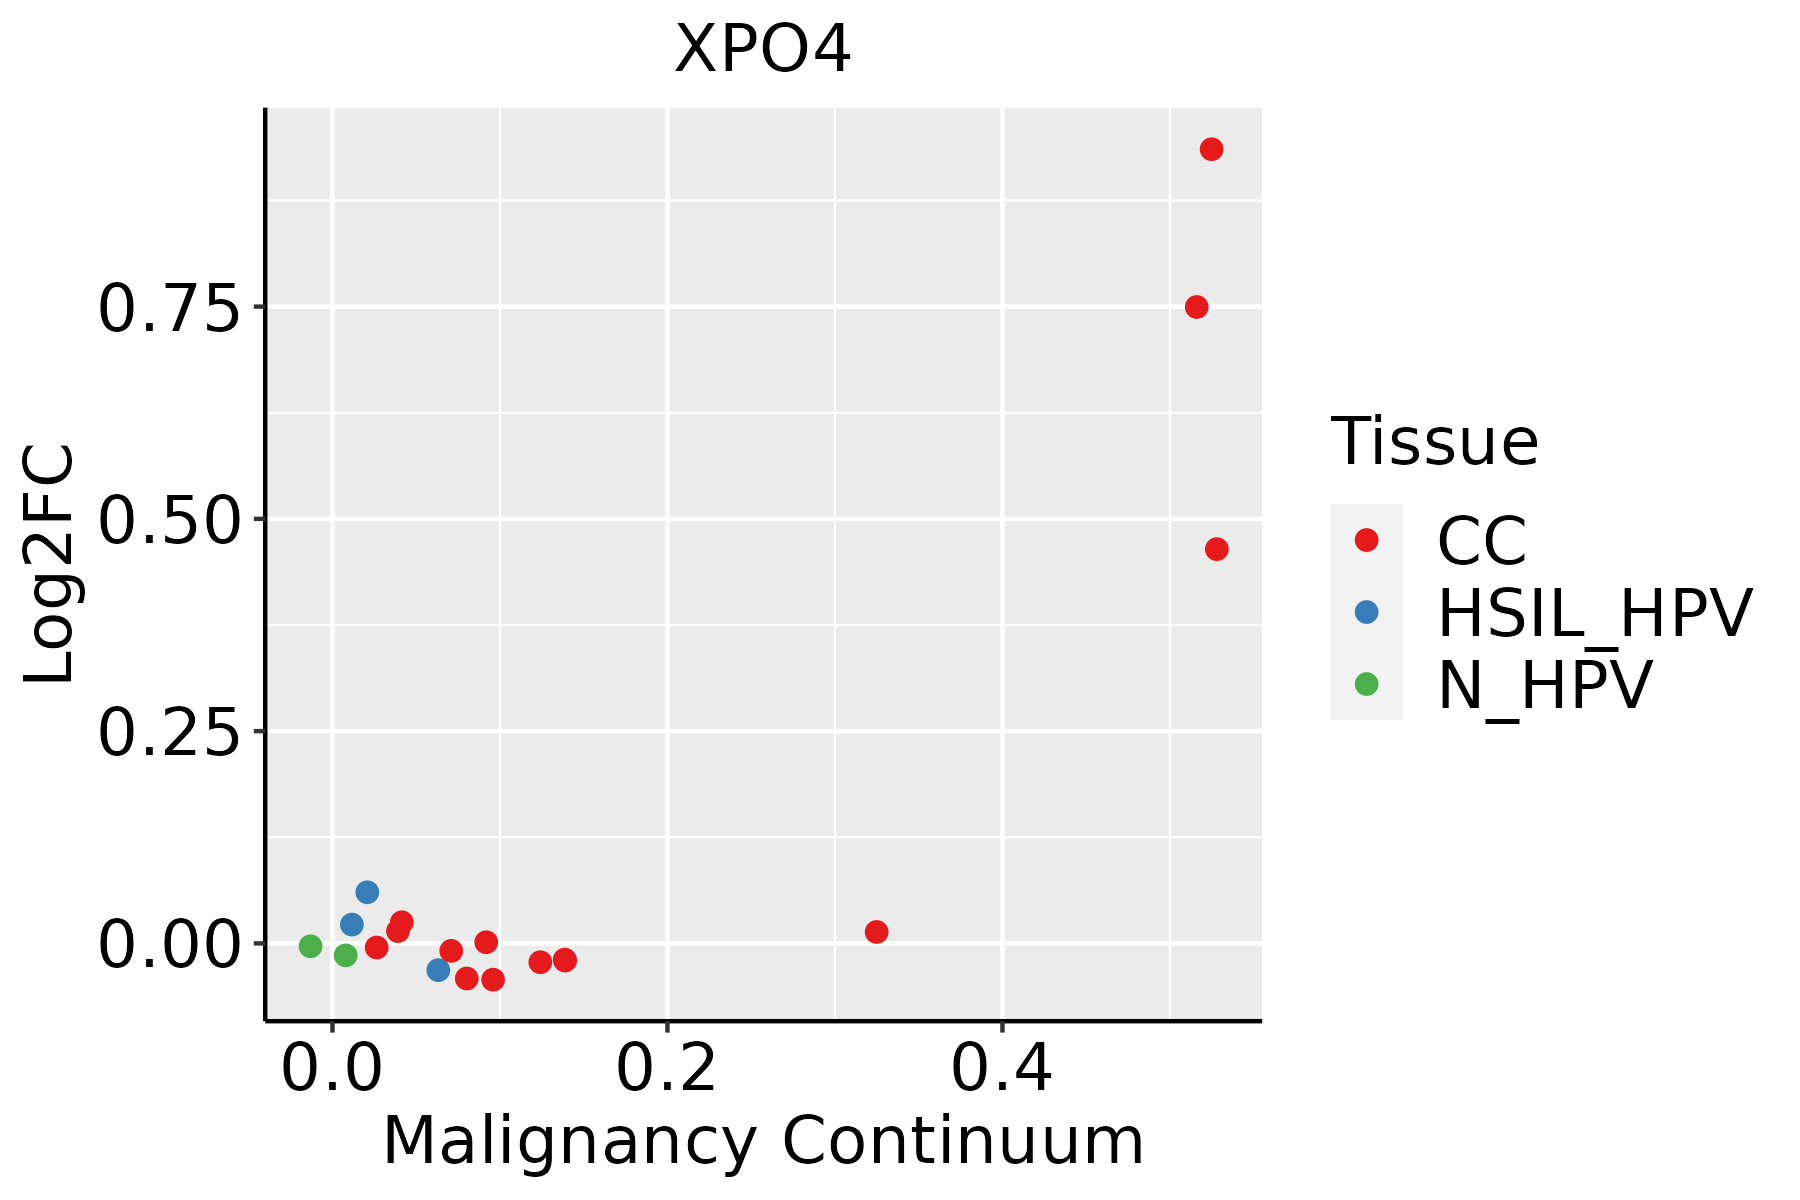 | CC: Cervix cancer |
| HSIL_HPV: HPV-infected high-grade squamous intraepithelial lesions | ||
| N_HPV: HPV-infected normal cervix | ||
| Colorectum (GSE201348) |  | FAP: Familial adenomatous polyposis |
| CRC: Colorectal cancer | ||
| Colorectum (HTA11) |  | AD: Adenomas |
| SER: Sessile serrated lesions | ||
| MSI-H: Microsatellite-high colorectal cancer | ||
| MSS: Microsatellite stable colorectal cancer | ||
| Esophagus |  | ESCC: Esophageal squamous cell carcinoma |
| HGIN: High-grade intraepithelial neoplasias | ||
| LGIN: Low-grade intraepithelial neoplasias |
| ∗log2FC in expression of this searched gene in stem-like cells from each diseased tissue sample relative to stem-like cells in normal samples in each tissue plotted against the malignancy continuum. Samples are colored based on if they are from different disease stage. |
Top |
Malignant transformation related pathway analysis |
| Find out the enriched GO biological processes and KEGG pathways involved in transition from healthy to precancer to cancer |
| Tissue | Disease Stage | Enriched GO biological Processes |
| Colorectum | AD |  |
| Colorectum | SER |  |
| Colorectum | MSS |  |
| Colorectum | MSI-H |  |
| Colorectum | FAP |  |
| ∗Top 15 enriched GO BP terms are showed in the bar plot of each disease state in each tissue. Each row represents a significant GO biological process which is colored according to the -log10(p.adjust). |
| Page: 1 2 3 4 5 6 7 8 9 |
| GO ID | Tissue | Disease Stage | Description | Gene Ratio | Bg Ratio | pvalue | p.adjust | Count |
| GO:005122210 | Cervix | CC | positive regulation of protein transport | 72/2311 | 303/18723 | 2.36e-08 | 1.70e-06 | 72 |
| GO:00069139 | Cervix | CC | nucleocytoplasmic transport | 71/2311 | 301/18723 | 4.04e-08 | 2.54e-06 | 71 |
| GO:00511699 | Cervix | CC | nuclear transport | 71/2311 | 301/18723 | 4.04e-08 | 2.54e-06 | 71 |
| GO:190495110 | Cervix | CC | positive regulation of establishment of protein localization | 73/2311 | 319/18723 | 9.69e-08 | 5.25e-06 | 73 |
| GO:00468229 | Cervix | CC | regulation of nucleocytoplasmic transport | 31/2311 | 106/18723 | 2.68e-06 | 7.87e-05 | 31 |
| GO:00903167 | Cervix | CC | positive regulation of intracellular protein transport | 41/2311 | 160/18723 | 3.24e-06 | 8.80e-05 | 41 |
| GO:00323868 | Cervix | CC | regulation of intracellular transport | 71/2311 | 337/18723 | 3.70e-06 | 9.74e-05 | 71 |
| GO:00331579 | Cervix | CC | regulation of intracellular protein transport | 52/2311 | 229/18723 | 8.16e-06 | 1.88e-04 | 52 |
| GO:00511689 | Cervix | CC | nuclear export | 38/2311 | 154/18723 | 1.86e-05 | 3.46e-04 | 38 |
| GO:00323889 | Cervix | CC | positive regulation of intracellular transport | 46/2311 | 202/18723 | 2.45e-05 | 4.24e-04 | 46 |
| GO:00468248 | Cervix | CC | positive regulation of nucleocytoplasmic transport | 19/2311 | 62/18723 | 1.11e-04 | 1.40e-03 | 19 |
| GO:00468259 | Cervix | CC | regulation of protein export from nucleus | 12/2311 | 30/18723 | 1.23e-04 | 1.53e-03 | 12 |
| GO:00066116 | Cervix | CC | protein export from nucleus | 17/2311 | 57/18723 | 3.61e-04 | 3.75e-03 | 17 |
| GO:1904951 | Colorectum | AD | positive regulation of establishment of protein localization | 112/3918 | 319/18723 | 2.55e-09 | 1.80e-07 | 112 |
| GO:0051222 | Colorectum | AD | positive regulation of protein transport | 106/3918 | 303/18723 | 8.45e-09 | 5.08e-07 | 106 |
| GO:0006913 | Colorectum | AD | nucleocytoplasmic transport | 102/3918 | 301/18723 | 1.00e-07 | 4.85e-06 | 102 |
| GO:0051169 | Colorectum | AD | nuclear transport | 102/3918 | 301/18723 | 1.00e-07 | 4.85e-06 | 102 |
| GO:0090316 | Colorectum | AD | positive regulation of intracellular protein transport | 62/3918 | 160/18723 | 1.82e-07 | 7.79e-06 | 62 |
| GO:0032388 | Colorectum | AD | positive regulation of intracellular transport | 74/3918 | 202/18723 | 1.83e-07 | 7.80e-06 | 74 |
| GO:0032386 | Colorectum | AD | regulation of intracellular transport | 109/3918 | 337/18723 | 5.33e-07 | 1.95e-05 | 109 |
| Page: 1 2 3 4 5 |
| Pathway ID | Tissue | Disease Stage | Description | Gene Ratio | Bg Ratio | pvalue | p.adjust | qvalue | Count |
| hsa0301321 | Esophagus | ESCC | Nucleocytoplasmic transport | 89/4205 | 108/8465 | 1.20e-12 | 2.37e-11 | 1.21e-11 | 89 |
| hsa0301331 | Esophagus | ESCC | Nucleocytoplasmic transport | 89/4205 | 108/8465 | 1.20e-12 | 2.37e-11 | 1.21e-11 | 89 |
| Page: 1 |
Top |
Cell-cell communication analysis |
| Identification of potential cell-cell interactions between two cell types and their ligand-receptor pairs for different disease states |
| Ligand | Receptor | LRpair | Pathway | Tissue | Disease Stage |
| Page: 1 |
Top |
Single-cell gene regulatory network inference analysis |
| Find out the significant the regulons (TFs) and the target genes of each regulon across cell types for different disease states |
| TF | Cell Type | Tissue | Disease Stage | Target Gene | RSS | Regulon Activity |
| ∗The dot plots of a searched regulon are shown for all cell subpopulations in each disease state of each tissue based on the regulon specific score inferred using pySCENIC and by calculating the average expression. |
| Page: 1 |
Top |
Somatic mutation of malignant transformation related genes |
| Annotation of somatic variants for genes involved in malignant transformation |
| Hugo Symbol | Variant Class | Variant Classification | dbSNP RS | HGVSc | HGVSp | HGVSp Short | SWISSPROT | BIOTYPE | SIFT | PolyPhen | Tumor Sample Barcode | Tissue | Histology | Sex | Age | Stage | Therapy Types | Drugs | Outcome |
| XPO4 | SNV | Missense_Mutation | novel | c.577N>A | p.Glu193Lys | p.E193K | Q9C0E2 | protein_coding | tolerated(0.76) | benign(0.005) | TCGA-AR-A2LR-01 | Breast | breast invasive carcinoma | Female | <65 | I/II | Chemotherapy | adriamycin | SD |
| XPO4 | SNV | Missense_Mutation | c.689N>T | p.Ala230Val | p.A230V | Q9C0E2 | protein_coding | tolerated(0.34) | benign(0.018) | TCGA-BH-A18G-01 | Breast | breast invasive carcinoma | Female | >=65 | I/II | Unknown | Unknown | SD | |
| XPO4 | SNV | Missense_Mutation | c.101N>A | p.Arg34His | p.R34H | Q9C0E2 | protein_coding | deleterious(0.01) | probably_damaging(0.91) | TCGA-BH-A18G-01 | Breast | breast invasive carcinoma | Female | >=65 | I/II | Unknown | Unknown | SD | |
| XPO4 | SNV | Missense_Mutation | rs770958190 | c.271N>A | p.Glu91Lys | p.E91K | Q9C0E2 | protein_coding | tolerated(0.58) | benign(0.012) | TCGA-E2-A1LG-01 | Breast | breast invasive carcinoma | Female | <65 | I/II | Chemotherapy | doxorubicin | SD |
| XPO4 | SNV | Missense_Mutation | novel | c.16N>A | p.Leu6Met | p.L6M | Q9C0E2 | protein_coding | tolerated_low_confidence(0.14) | benign(0.015) | TCGA-UU-A93S-01 | Breast | breast invasive carcinoma | Female | <65 | III/IV | Unknown | Unknown | PD |
| XPO4 | deletion | Frame_Shift_Del | c.2492delN | p.Leu831Ter | p.L831* | Q9C0E2 | protein_coding | TCGA-A8-A07G-01 | Breast | breast invasive carcinoma | Female | >=65 | I/II | Chemotherapy | 5-fluorouracil | CR | |||
| XPO4 | insertion | Frame_Shift_Ins | novel | c.2983_2984insA | p.Ile995AsnfsTer6 | p.I995Nfs*6 | Q9C0E2 | protein_coding | TCGA-EW-A1IZ-01 | Breast | breast invasive carcinoma | Female | <65 | III/IV | Chemotherapy | taxotere | SD | ||
| XPO4 | SNV | Missense_Mutation | rs761662120 | c.1412G>A | p.Arg471Gln | p.R471Q | Q9C0E2 | protein_coding | deleterious(0.01) | possibly_damaging(0.808) | TCGA-2W-A8YY-01 | Cervix | cervical & endocervical cancer | Female | <65 | I/II | Chemotherapy | cisplatin | CR |
| XPO4 | SNV | Missense_Mutation | c.3269N>T | p.Ser1090Phe | p.S1090F | Q9C0E2 | protein_coding | deleterious(0.02) | benign(0.325) | TCGA-C5-A3HE-01 | Cervix | cervical & endocervical cancer | Female | <65 | I/II | Unknown | Unknown | PD | |
| XPO4 | SNV | Missense_Mutation | c.1070G>A | p.Arg357Gln | p.R357Q | Q9C0E2 | protein_coding | tolerated(0.15) | possibly_damaging(0.526) | TCGA-IR-A3LA-01 | Cervix | cervical & endocervical cancer | Female | <65 | I/II | Chemotherapy | cisplatin | CR |
| Page: 1 2 3 4 5 6 7 8 9 10 11 12 |
Top |
Related drugs of malignant transformation related genes |
| Identification of chemicals and drugs interact with genes involved in malignant transfromation |
| (DGIdb 4.0) |
| Entrez ID | Symbol | Category | Interaction Types | Drug Claim Name | Drug Name | PMIDs |
| Page: 1 |

Copyright 2023-Present -The University of Texas Health Science Center at Houston |