| Tissue | Expression Dynamics | Abbreviation |
| Esophagus |  | ESCC: Esophageal squamous cell carcinoma |
| HGIN: High-grade intraepithelial neoplasias |
| LGIN: Low-grade intraepithelial neoplasias |
| Liver | 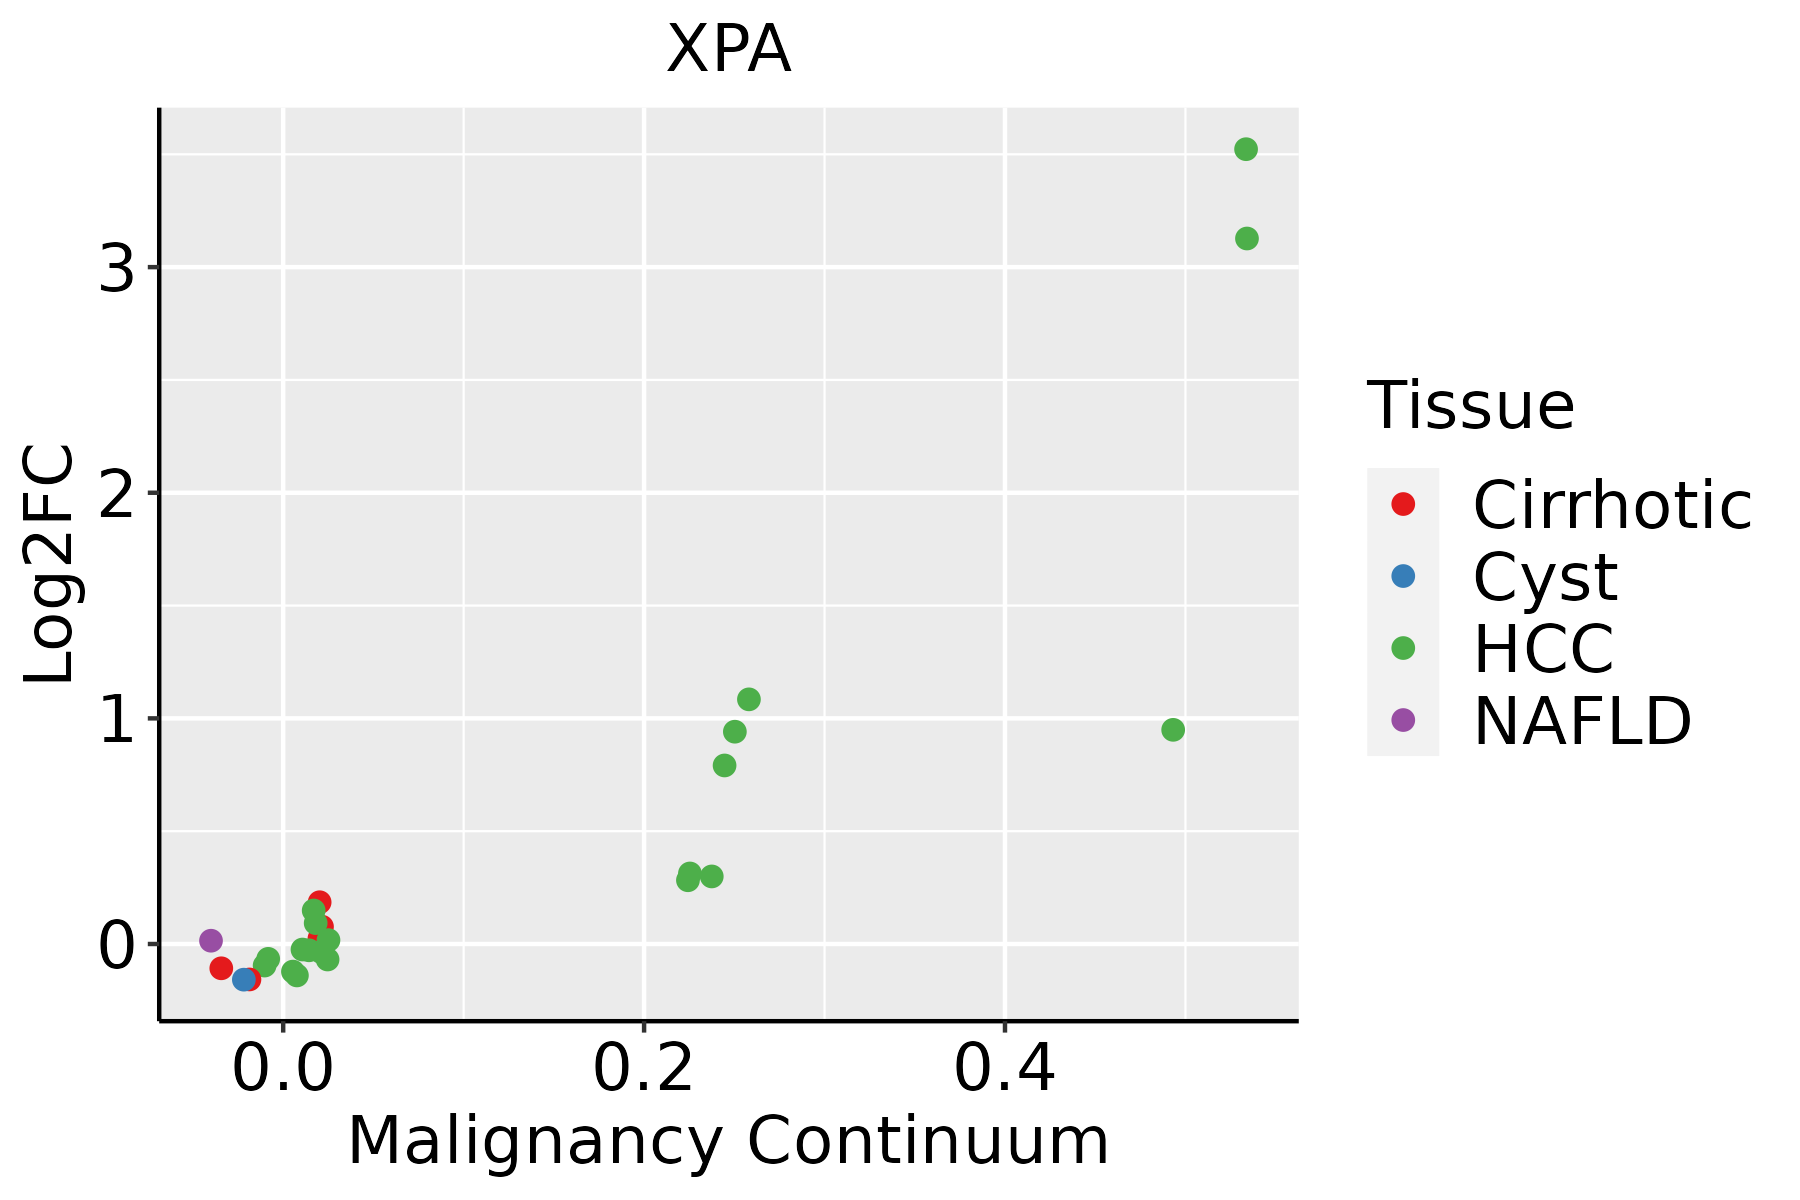 | HCC: Hepatocellular carcinoma |
| NAFLD: Non-alcoholic fatty liver disease |
| Oral Cavity |  | EOLP: Erosive Oral lichen planus |
| LP: leukoplakia |
| NEOLP: Non-erosive oral lichen planus |
| OSCC: Oral squamous cell carcinoma |
| Skin | 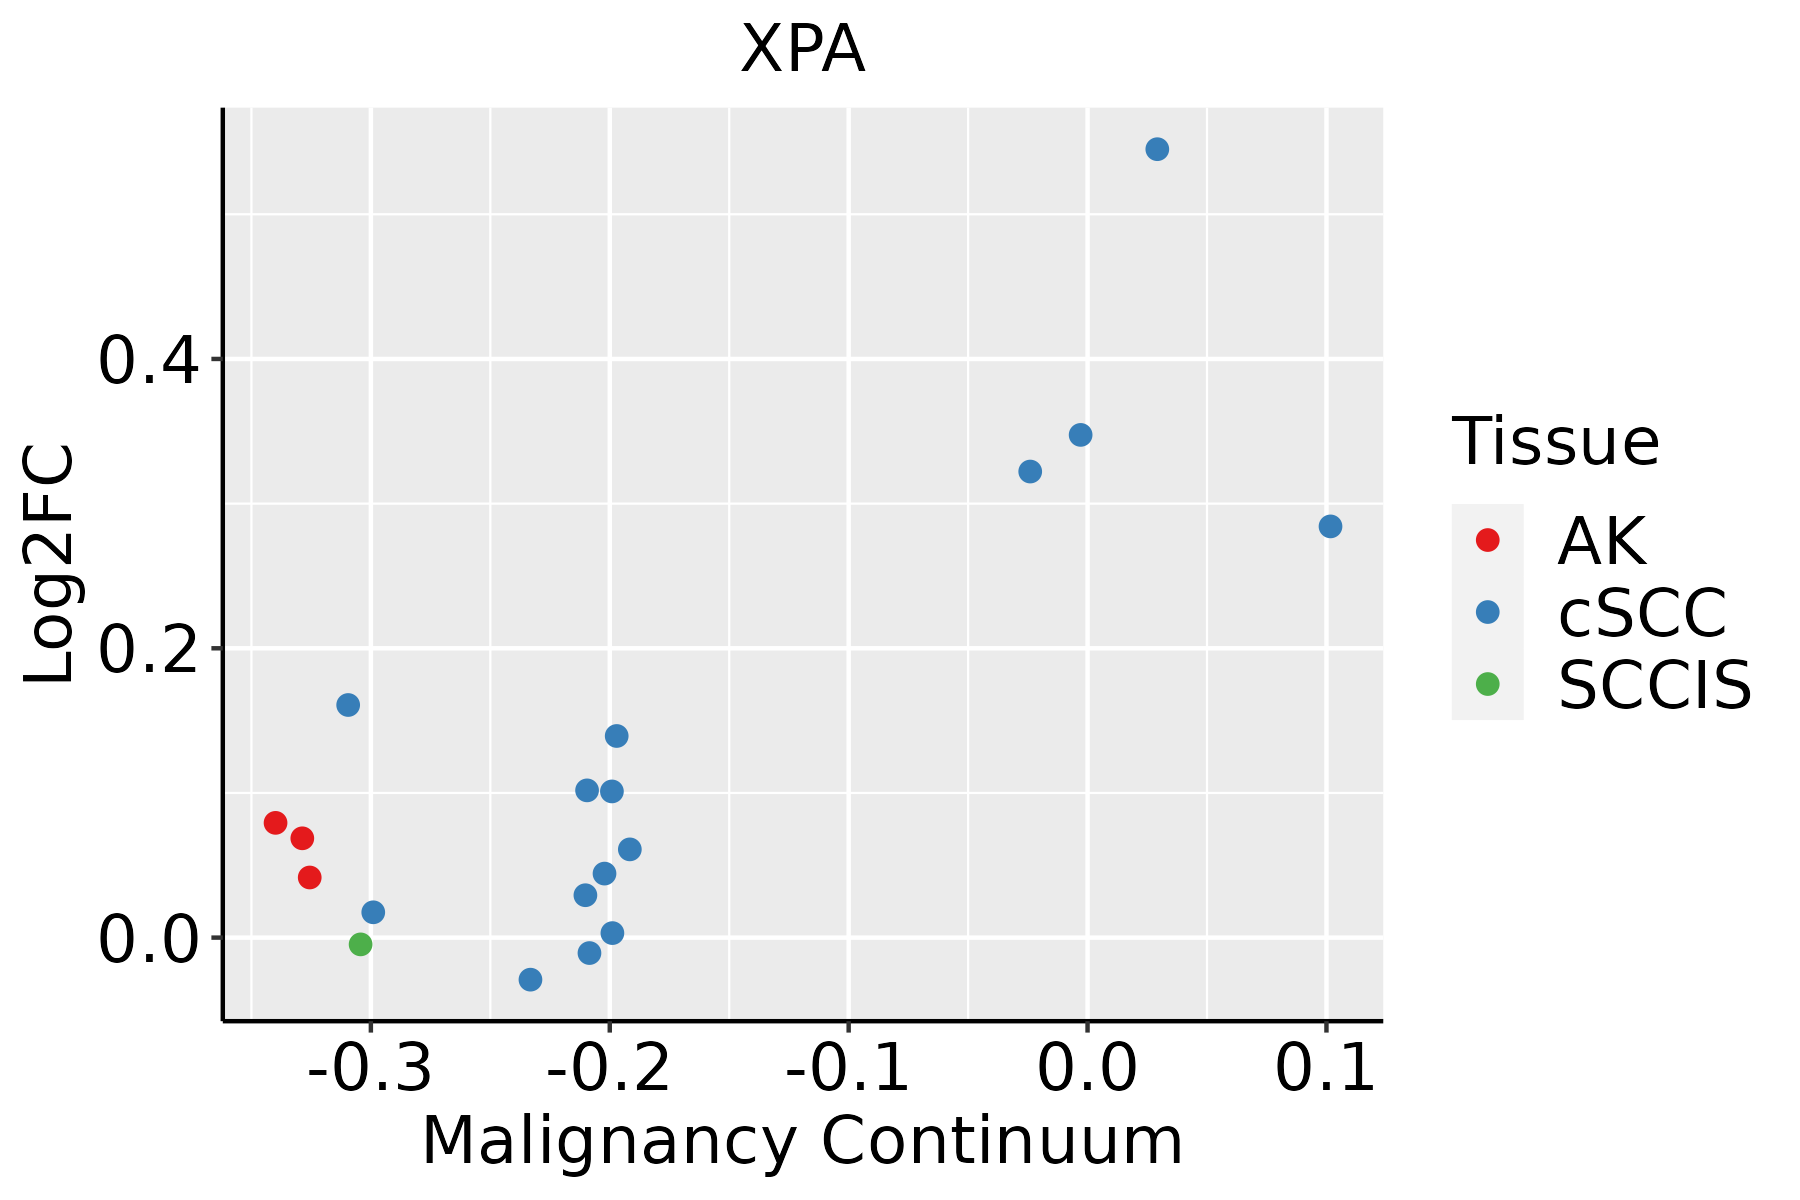 | AK: Actinic keratosis |
| cSCC: Cutaneous squamous cell carcinoma |
| SCCIS:squamous cell carcinoma in situ |
| Thyroid |  | ATC: Anaplastic thyroid cancer |
| HT: Hashimoto's thyroiditis |
| PTC: Papillary thyroid cancer |
| GO ID | Tissue | Disease Stage | Description | Gene Ratio | Bg Ratio | pvalue | p.adjust | Count |
| GO:003450417 | Esophagus | HGIN | protein localization to nucleus | 84/2587 | 290/18723 | 1.06e-11 | 1.24e-09 | 84 |
| GO:000931418 | Esophagus | HGIN | response to radiation | 88/2587 | 456/18723 | 6.26e-04 | 8.65e-03 | 88 |
| GO:00714789 | Esophagus | HGIN | cellular response to radiation | 42/2587 | 186/18723 | 7.66e-04 | 1.00e-02 | 42 |
| GO:00094115 | Esophagus | HGIN | response to UV | 35/2587 | 149/18723 | 9.71e-04 | 1.22e-02 | 35 |
| GO:007121418 | Esophagus | HGIN | cellular response to abiotic stimulus | 66/2587 | 331/18723 | 1.21e-03 | 1.45e-02 | 66 |
| GO:010400418 | Esophagus | HGIN | cellular response to environmental stimulus | 66/2587 | 331/18723 | 1.21e-03 | 1.45e-02 | 66 |
| GO:00346445 | Esophagus | HGIN | cellular response to UV | 23/2587 | 90/18723 | 2.16e-03 | 2.25e-02 | 23 |
| GO:00094165 | Esophagus | HGIN | response to light stimulus | 61/2587 | 320/18723 | 5.20e-03 | 4.30e-02 | 61 |
| GO:00062892 | Esophagus | HGIN | nucleotide-excision repair | 16/2587 | 60/18723 | 6.22e-03 | 4.95e-02 | 16 |
| GO:003450418 | Esophagus | ESCC | protein localization to nucleus | 211/8552 | 290/18723 | 4.06e-21 | 6.60e-19 | 211 |
| GO:000941113 | Esophagus | ESCC | response to UV | 115/8552 | 149/18723 | 3.29e-15 | 1.93e-13 | 115 |
| GO:000931419 | Esophagus | ESCC | response to radiation | 277/8552 | 456/18723 | 4.42e-11 | 1.43e-09 | 277 |
| GO:003464413 | Esophagus | ESCC | cellular response to UV | 70/8552 | 90/18723 | 4.59e-10 | 1.20e-08 | 70 |
| GO:007121419 | Esophagus | ESCC | cellular response to abiotic stimulus | 206/8552 | 331/18723 | 7.52e-10 | 1.88e-08 | 206 |
| GO:010400419 | Esophagus | ESCC | cellular response to environmental stimulus | 206/8552 | 331/18723 | 7.52e-10 | 1.88e-08 | 206 |
| GO:00903053 | Esophagus | ESCC | nucleic acid phosphodiester bond hydrolysis | 163/8552 | 261/18723 | 3.07e-08 | 5.73e-07 | 163 |
| GO:007147816 | Esophagus | ESCC | cellular response to radiation | 122/8552 | 186/18723 | 3.07e-08 | 5.73e-07 | 122 |
| GO:000941611 | Esophagus | ESCC | response to light stimulus | 183/8552 | 320/18723 | 2.03e-05 | 1.76e-04 | 183 |
| GO:00062843 | Esophagus | ESCC | base-excision repair | 33/8552 | 43/18723 | 3.25e-05 | 2.69e-04 | 33 |
| GO:00062891 | Esophagus | ESCC | nucleotide-excision repair | 42/8552 | 60/18723 | 1.18e-04 | 8.14e-04 | 42 |
| Pathway ID | Tissue | Disease Stage | Description | Gene Ratio | Bg Ratio | pvalue | p.adjust | qvalue | Count |
| hsa034205 | Esophagus | HGIN | Nucleotide excision repair | 29/1383 | 63/8465 | 2.96e-08 | 5.36e-07 | 4.26e-07 | 29 |
| hsa0342012 | Esophagus | HGIN | Nucleotide excision repair | 29/1383 | 63/8465 | 2.96e-08 | 5.36e-07 | 4.26e-07 | 29 |
| hsa0342022 | Esophagus | ESCC | Nucleotide excision repair | 54/4205 | 63/8465 | 2.01e-09 | 2.17e-08 | 1.11e-08 | 54 |
| hsa015247 | Esophagus | ESCC | Platinum drug resistance | 56/4205 | 73/8465 | 1.85e-06 | 1.13e-05 | 5.78e-06 | 56 |
| hsa0342032 | Esophagus | ESCC | Nucleotide excision repair | 54/4205 | 63/8465 | 2.01e-09 | 2.17e-08 | 1.11e-08 | 54 |
| hsa0152414 | Esophagus | ESCC | Platinum drug resistance | 56/4205 | 73/8465 | 1.85e-06 | 1.13e-05 | 5.78e-06 | 56 |
| hsa015244 | Liver | Cirrhotic | Platinum drug resistance | 34/2530 | 73/8465 | 1.86e-03 | 8.37e-03 | 5.16e-03 | 34 |
| hsa03420 | Liver | Cirrhotic | Nucleotide excision repair | 29/2530 | 63/8465 | 4.81e-03 | 1.74e-02 | 1.07e-02 | 29 |
| hsa0152411 | Liver | Cirrhotic | Platinum drug resistance | 34/2530 | 73/8465 | 1.86e-03 | 8.37e-03 | 5.16e-03 | 34 |
| hsa034201 | Liver | Cirrhotic | Nucleotide excision repair | 29/2530 | 63/8465 | 4.81e-03 | 1.74e-02 | 1.07e-02 | 29 |
| hsa015242 | Liver | HCC | Platinum drug resistance | 52/4020 | 73/8465 | 3.14e-05 | 1.88e-04 | 1.04e-04 | 52 |
| hsa034202 | Liver | HCC | Nucleotide excision repair | 41/4020 | 63/8465 | 3.59e-03 | 1.12e-02 | 6.22e-03 | 41 |
| hsa015243 | Liver | HCC | Platinum drug resistance | 52/4020 | 73/8465 | 3.14e-05 | 1.88e-04 | 1.04e-04 | 52 |
| hsa034203 | Liver | HCC | Nucleotide excision repair | 41/4020 | 63/8465 | 3.59e-03 | 1.12e-02 | 6.22e-03 | 41 |
| hsa034204 | Oral cavity | OSCC | Nucleotide excision repair | 49/3704 | 63/8465 | 3.48e-08 | 2.91e-07 | 1.48e-07 | 49 |
| hsa015246 | Oral cavity | OSCC | Platinum drug resistance | 51/3704 | 73/8465 | 5.41e-06 | 2.75e-05 | 1.40e-05 | 51 |
| hsa0342011 | Oral cavity | OSCC | Nucleotide excision repair | 49/3704 | 63/8465 | 3.48e-08 | 2.91e-07 | 1.48e-07 | 49 |
| hsa0152413 | Oral cavity | OSCC | Platinum drug resistance | 51/3704 | 73/8465 | 5.41e-06 | 2.75e-05 | 1.40e-05 | 51 |
| hsa0342021 | Oral cavity | LP | Nucleotide excision repair | 37/2418 | 63/8465 | 5.14e-07 | 6.33e-06 | 4.08e-06 | 37 |
| hsa0342031 | Oral cavity | LP | Nucleotide excision repair | 37/2418 | 63/8465 | 5.14e-07 | 6.33e-06 | 4.08e-06 | 37 |
| Hugo Symbol | Variant Class | Variant Classification | dbSNP RS | HGVSc | HGVSp | HGVSp Short | SWISSPROT | BIOTYPE | SIFT | PolyPhen | Tumor Sample Barcode | Tissue | Histology | Sex | Age | Stage | Therapy Types | Drugs | Outcome |
| XPA | SNV | Missense_Mutation | novel | c.765N>G | p.Asp255Glu | p.D255E | P23025 | protein_coding | deleterious(0.04) | benign(0.141) | TCGA-MS-A51U-01 | Breast | breast invasive carcinoma | Female | <65 | I/II | Chemotherapy | adriamycin | SD |
| XPA | SNV | Missense_Mutation | | c.569C>T | p.Ser190Phe | p.S190F | P23025 | protein_coding | deleterious(0) | possibly_damaging(0.52) | TCGA-JW-A5VL-01 | Cervix | cervical & endocervical cancer | Female | <65 | I/II | Unknown | Unknown | SD |
| XPA | insertion | In_Frame_Ins | novel | c.743_744insTAAAACCATAAAAACCCT | p.Pro248_Glu249insLysThrIleLysThrLeu | p.P248_E249insKTIKTL | P23025 | protein_coding | | | TCGA-DS-A1OD-01 | Cervix | cervical & endocervical cancer | Female | <65 | I/II | Chemotherapy | cisplatin | SD |
| XPA | SNV | Missense_Mutation | novel | c.637A>C | p.Lys213Gln | p.K213Q | P23025 | protein_coding | tolerated(0.38) | benign(0.107) | TCGA-CA-6717-01 | Colorectum | colon adenocarcinoma | Male | <65 | I/II | Chemotherapy | oxaliplatin | CR |
| XPA | SNV | Missense_Mutation | | c.193N>A | p.Ala65Thr | p.A65T | P23025 | protein_coding | tolerated(0.78) | benign(0) | TCGA-G4-6628-01 | Colorectum | colon adenocarcinoma | Male | >=65 | I/II | Unknown | Unknown | SD |
| XPA | SNV | Missense_Mutation | novel | c.514N>T | p.His172Tyr | p.H172Y | P23025 | protein_coding | tolerated(0.06) | benign(0.023) | TCGA-A5-A2K5-01 | Endometrium | uterine corpus endometrioid carcinoma | Female | >=65 | I/II | Unknown | Unknown | SD |
| XPA | SNV | Missense_Mutation | | c.779N>A | p.Thr260Asn | p.T260N | P23025 | protein_coding | deleterious(0.03) | benign(0.143) | TCGA-AJ-A3EK-01 | Endometrium | uterine corpus endometrioid carcinoma | Female | <65 | I/II | Chemotherapy | carboplatin | CR |
| XPA | SNV | Missense_Mutation | novel | c.566N>T | p.Arg189Met | p.R189M | P23025 | protein_coding | deleterious(0) | probably_damaging(0.924) | TCGA-AP-A05O-01 | Endometrium | uterine corpus endometrioid carcinoma | Female | >=65 | I/II | Chemotherapy | carboplatin | PD |
| XPA | SNV | Missense_Mutation | | c.725N>T | p.His242Leu | p.H242L | P23025 | protein_coding | deleterious(0) | probably_damaging(0.997) | TCGA-AX-A05S-01 | Endometrium | uterine corpus endometrioid carcinoma | Female | >=65 | III/IV | Unspecific | Carboplatin & Paclitaxel | PD |
| XPA | SNV | Missense_Mutation | | c.484N>G | p.Leu162Val | p.L162V | P23025 | protein_coding | deleterious(0.04) | benign(0.277) | TCGA-AX-A1C8-01 | Endometrium | uterine corpus endometrioid carcinoma | Female | >=65 | III/IV | Unspecific | Carboplatin | SD |


