
|
|||||
|
 | |
| |
| |
| |
| |
| |
|
Gene: XKR6 |
Gene summary for XKR6 |
| Gene information | Species | Human | Gene symbol | XKR6 | Gene ID | 286046 |
| Gene name | XK related 6 | |
| Gene Alias | C8orf21 | |
| Cytomap | 8p23.1 | |
| Gene Type | protein-coding | GO ID | GO:0006810 | UniProtAcc | Q5GH73 |
Top |
Malignant transformation analysis |
| Identification of the aberrant gene expression in precancerous and cancerous lesions by comparing the gene expression of stem-like cells in diseased tissues with normal stem cells |
| Entrez ID | Symbol | Replicates | Species | Organ | Tissue | Adj P-value | Log2FC | Malignancy |
| 286046 | XKR6 | CCI_1 | Human | Cervix | CC | 3.26e-11 | 8.41e-01 | 0.528 |
| 286046 | XKR6 | CCI_2 | Human | Cervix | CC | 1.07e-07 | 7.68e-01 | 0.5249 |
| 286046 | XKR6 | CCI_3 | Human | Cervix | CC | 4.28e-18 | 7.93e-01 | 0.516 |
| 286046 | XKR6 | HTA11_3410_2000001011 | Human | Colorectum | AD | 2.83e-17 | -6.05e-01 | 0.0155 |
| 286046 | XKR6 | HTA11_1938_2000001011 | Human | Colorectum | AD | 3.55e-02 | -3.71e-01 | -0.0811 |
| 286046 | XKR6 | HTA11_78_2000001011 | Human | Colorectum | AD | 7.77e-07 | -5.68e-01 | -0.1088 |
| 286046 | XKR6 | HTA11_83_2000001011 | Human | Colorectum | SER | 2.11e-04 | -6.12e-01 | -0.1526 |
| 286046 | XKR6 | HTA11_866_2000001011 | Human | Colorectum | AD | 1.45e-04 | -3.77e-01 | -0.1001 |
| 286046 | XKR6 | HTA11_1391_2000001011 | Human | Colorectum | AD | 1.73e-18 | -7.06e-01 | -0.059 |
| 286046 | XKR6 | HTA11_546_2000001011 | Human | Colorectum | AD | 6.10e-06 | -6.51e-01 | -0.0842 |
| 286046 | XKR6 | HTA11_7862_2000001011 | Human | Colorectum | AD | 3.36e-04 | -5.15e-01 | -0.0179 |
| 286046 | XKR6 | HTA11_866_3004761011 | Human | Colorectum | AD | 4.23e-15 | -6.49e-01 | 0.096 |
| 286046 | XKR6 | HTA11_8622_2000001021 | Human | Colorectum | SER | 3.47e-03 | -5.36e-01 | 0.0528 |
| 286046 | XKR6 | HTA11_10623_2000001011 | Human | Colorectum | AD | 2.03e-02 | -6.16e-01 | -0.0177 |
| 286046 | XKR6 | HTA11_10711_2000001011 | Human | Colorectum | AD | 5.68e-07 | -6.10e-01 | 0.0338 |
| 286046 | XKR6 | HTA11_7696_3000711011 | Human | Colorectum | AD | 2.71e-05 | -4.65e-01 | 0.0674 |
| 286046 | XKR6 | HTA11_6818_2000001011 | Human | Colorectum | AD | 4.75e-02 | -6.02e-01 | 0.0112 |
| 286046 | XKR6 | HTA11_6818_2000001021 | Human | Colorectum | AD | 2.20e-11 | -7.62e-01 | 0.0588 |
| 286046 | XKR6 | HTA11_99999970781_79442 | Human | Colorectum | MSS | 1.97e-29 | -7.49e-01 | 0.294 |
| 286046 | XKR6 | HTA11_99999965104_69814 | Human | Colorectum | MSS | 2.35e-02 | -5.14e-01 | 0.281 |
| Page: 1 2 3 4 |
| Tissue | Expression Dynamics | Abbreviation |
| Cervix | 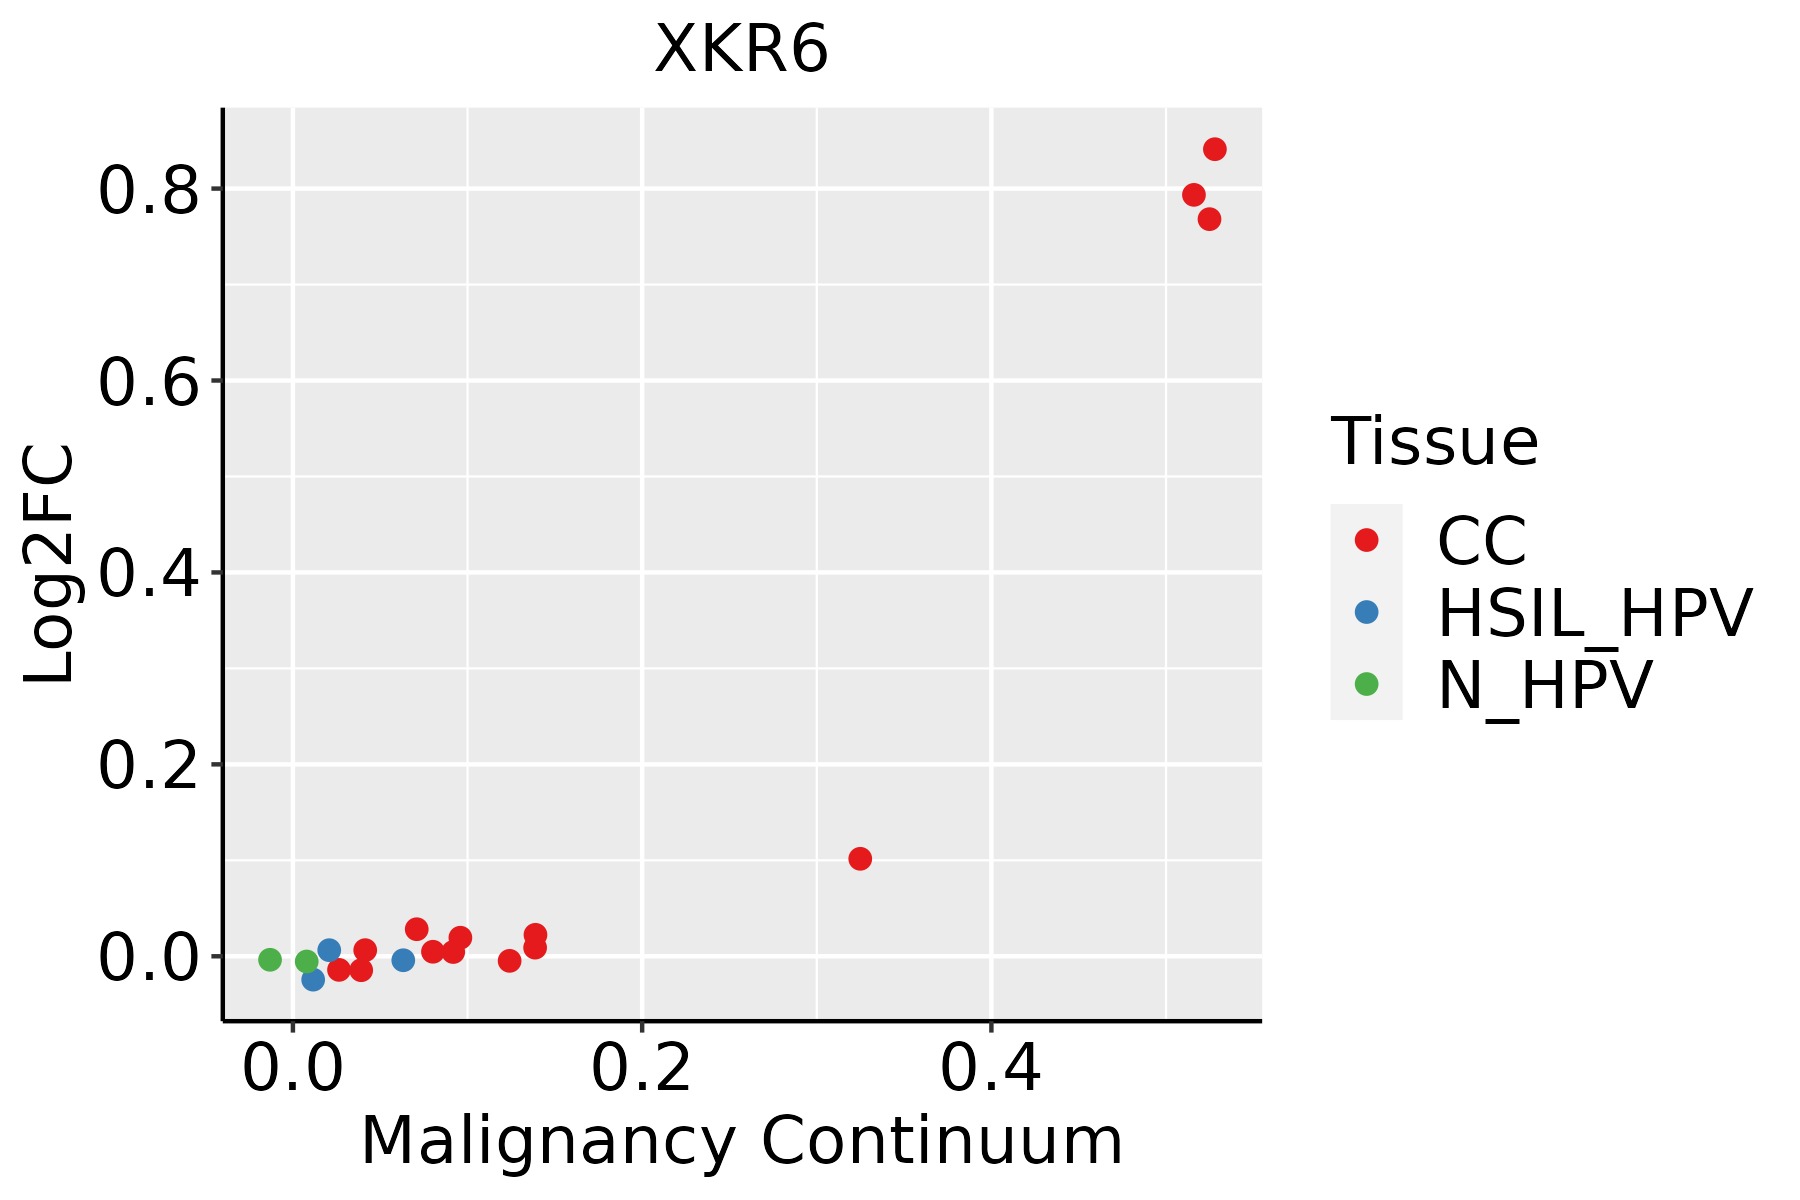 | CC: Cervix cancer |
| HSIL_HPV: HPV-infected high-grade squamous intraepithelial lesions | ||
| N_HPV: HPV-infected normal cervix | ||
| Colorectum (GSE201348) |  | FAP: Familial adenomatous polyposis |
| CRC: Colorectal cancer | ||
| Colorectum (HTA11) |  | AD: Adenomas |
| SER: Sessile serrated lesions | ||
| MSI-H: Microsatellite-high colorectal cancer | ||
| MSS: Microsatellite stable colorectal cancer | ||
| Lung |  | AAH: Atypical adenomatous hyperplasia |
| AIS: Adenocarcinoma in situ | ||
| IAC: Invasive lung adenocarcinoma | ||
| MIA: Minimally invasive adenocarcinoma |
| ∗log2FC in expression of this searched gene in stem-like cells from each diseased tissue sample relative to stem-like cells in normal samples in each tissue plotted against the malignancy continuum. Samples are colored based on if they are from different disease stage. |
Top |
Malignant transformation related pathway analysis |
| Find out the enriched GO biological processes and KEGG pathways involved in transition from healthy to precancer to cancer |
| Tissue | Disease Stage | Enriched GO biological Processes |
| Colorectum | AD |  |
| Colorectum | SER |  |
| Colorectum | MSS |  |
| Colorectum | MSI-H |  |
| Colorectum | FAP |  |
| ∗Top 15 enriched GO BP terms are showed in the bar plot of each disease state in each tissue. Each row represents a significant GO biological process which is colored according to the -log10(p.adjust). |
| Page: 1 2 3 4 5 6 7 8 9 |
| GO ID | Tissue | Disease Stage | Description | Gene Ratio | Bg Ratio | pvalue | p.adjust | Count |
| GO:0006909 | Cervix | CC | phagocytosis | 53/2311 | 308/18723 | 7.49e-03 | 4.01e-02 | 53 |
| GO:00070092 | Cervix | CC | plasma membrane organization | 28/2311 | 142/18723 | 7.85e-03 | 4.14e-02 | 28 |
| GO:00103243 | Cervix | CC | membrane invagination | 28/2311 | 144/18723 | 9.50e-03 | 4.72e-02 | 28 |
| GO:0010876 | Colorectum | AD | lipid localization | 120/3918 | 448/18723 | 1.59e-03 | 1.33e-02 | 120 |
| GO:0006869 | Colorectum | AD | lipid transport | 108/3918 | 398/18723 | 1.67e-03 | 1.39e-02 | 108 |
| GO:0015748 | Colorectum | AD | organophosphate ester transport | 42/3918 | 140/18723 | 7.04e-03 | 4.31e-02 | 42 |
| GO:0007009 | Colorectum | SER | plasma membrane organization | 36/2897 | 142/18723 | 1.50e-03 | 1.62e-02 | 36 |
| GO:00108761 | Colorectum | MSS | lipid localization | 104/3467 | 448/18723 | 6.76e-03 | 4.38e-02 | 104 |
| GO:00068691 | Colorectum | FAP | lipid transport | 81/2622 | 398/18723 | 2.84e-04 | 3.76e-03 | 81 |
| GO:00108762 | Colorectum | FAP | lipid localization | 85/2622 | 448/18723 | 1.92e-03 | 1.63e-02 | 85 |
| GO:0015914 | Colorectum | FAP | phospholipid transport | 23/2622 | 96/18723 | 6.09e-03 | 3.82e-02 | 23 |
| GO:00070091 | Colorectum | FAP | plasma membrane organization | 31/2622 | 142/18723 | 7.20e-03 | 4.38e-02 | 31 |
| GO:00068692 | Colorectum | CRC | lipid transport | 63/2078 | 398/18723 | 2.36e-03 | 2.26e-02 | 63 |
| GO:00108763 | Colorectum | CRC | lipid localization | 68/2078 | 448/18723 | 4.60e-03 | 3.58e-02 | 68 |
| GO:00159142 | Lung | IAC | phospholipid transport | 20/2061 | 96/18723 | 3.58e-03 | 3.00e-02 | 20 |
| GO:00157482 | Lung | IAC | organophosphate ester transport | 26/2061 | 140/18723 | 5.22e-03 | 3.97e-02 | 26 |
| GO:001591411 | Lung | AIS | phospholipid transport | 18/1849 | 96/18723 | 5.64e-03 | 4.76e-02 | 18 |
| Page: 1 |
| Pathway ID | Tissue | Disease Stage | Description | Gene Ratio | Bg Ratio | pvalue | p.adjust | qvalue | Count |
| Page: 1 |
Top |
Cell-cell communication analysis |
| Identification of potential cell-cell interactions between two cell types and their ligand-receptor pairs for different disease states |
| Ligand | Receptor | LRpair | Pathway | Tissue | Disease Stage |
| Page: 1 |
Top |
Single-cell gene regulatory network inference analysis |
| Find out the significant the regulons (TFs) and the target genes of each regulon across cell types for different disease states |
| TF | Cell Type | Tissue | Disease Stage | Target Gene | RSS | Regulon Activity |
| ∗The dot plots of a searched regulon are shown for all cell subpopulations in each disease state of each tissue based on the regulon specific score inferred using pySCENIC and by calculating the average expression. |
| Page: 1 |
Top |
Somatic mutation of malignant transformation related genes |
| Annotation of somatic variants for genes involved in malignant transformation |
| Hugo Symbol | Variant Class | Variant Classification | dbSNP RS | HGVSc | HGVSp | HGVSp Short | SWISSPROT | BIOTYPE | SIFT | PolyPhen | Tumor Sample Barcode | Tissue | Histology | Sex | Age | Stage | Therapy Types | Drugs | Outcome |
| XKR6 | SNV | Missense_Mutation | c.872N>A | p.Arg291His | p.R291H | Q5GH73 | protein_coding | tolerated(0.28) | probably_damaging(0.998) | TCGA-AC-A3W5-01 | Breast | breast invasive carcinoma | Female | >=65 | I/II | Chemotherapy | docetaxel | CR | |
| XKR6 | SNV | Missense_Mutation | c.840N>A | p.Met280Ile | p.M280I | Q5GH73 | protein_coding | deleterious(0.01) | probably_damaging(0.968) | TCGA-D8-A1JA-01 | Breast | breast invasive carcinoma | Female | <65 | III/IV | Chemotherapy | adriamycin | PD | |
| XKR6 | SNV | Missense_Mutation | c.1739C>A | p.Pro580Gln | p.P580Q | Q5GH73 | protein_coding | tolerated(0.09) | probably_damaging(0.996) | TCGA-E9-A295-01 | Breast | breast invasive carcinoma | Female | >=65 | I/II | Hormone Therapy | tamoxiphen | SD | |
| XKR6 | SNV | Missense_Mutation | novel | c.1309N>T | p.Arg437Trp | p.R437W | Q5GH73 | protein_coding | deleterious(0) | probably_damaging(0.998) | TCGA-E9-A3X8-01 | Breast | breast invasive carcinoma | Female | <65 | I/II | Chemotherapy | cyclophosphane | CR |
| XKR6 | SNV | Missense_Mutation | c.1722G>T | p.Leu574Phe | p.L574F | Q5GH73 | protein_coding | tolerated(0.64) | benign(0.063) | TCGA-EW-A1IZ-01 | Breast | breast invasive carcinoma | Female | <65 | III/IV | Chemotherapy | taxotere | SD | |
| XKR6 | SNV | Missense_Mutation | c.1841N>G | p.Gln614Arg | p.Q614R | Q5GH73 | protein_coding | deleterious(0) | possibly_damaging(0.628) | TCGA-PL-A8LZ-01 | Breast | breast invasive carcinoma | Female | <65 | III/IV | Chemotherapy | paclitaxel | SD | |
| XKR6 | deletion | Frame_Shift_Del | novel | c.1470delN | p.Met490IlefsTer58 | p.M490Ifs*58 | Q5GH73 | protein_coding | TCGA-D8-A27V-01 | Breast | breast invasive carcinoma | Female | <65 | I/II | Hormone Therapy | tamoxiphen | SD | ||
| XKR6 | SNV | Missense_Mutation | novel | c.1093N>A | p.Leu365Ile | p.L365I | Q5GH73 | protein_coding | deleterious(0.01) | benign(0.433) | TCGA-2W-A8YY-01 | Cervix | cervical & endocervical cancer | Female | <65 | I/II | Chemotherapy | cisplatin | CR |
| XKR6 | SNV | Missense_Mutation | novel | c.1912N>C | p.Glu638Gln | p.E638Q | Q5GH73 | protein_coding | deleterious(0) | probably_damaging(0.979) | TCGA-C5-A1BJ-01 | Cervix | cervical & endocervical cancer | Female | <65 | I/II | Unknown | Unknown | SD |
| XKR6 | SNV | Missense_Mutation | rs374654242 | c.805N>T | p.Arg269Trp | p.R269W | Q5GH73 | protein_coding | deleterious(0.02) | possibly_damaging(0.745) | TCGA-A6-2679-01 | Colorectum | colon adenocarcinoma | Female | >=65 | I/II | Unknown | Unknown | SD |
| Page: 1 2 3 4 5 6 7 |
Top |
Related drugs of malignant transformation related genes |
| Identification of chemicals and drugs interact with genes involved in malignant transfromation |
| (DGIdb 4.0) |
| Entrez ID | Symbol | Category | Interaction Types | Drug Claim Name | Drug Name | PMIDs |
| Page: 1 |

Copyright 2023-Present -The University of Texas Health Science Center at Houston |