
|
|||||
|
 | |
| |
| |
| |
| |
| |
|
Gene: XIST |
Gene summary for XIST |
| Gene information | Species | Human | Gene symbol | XIST | Gene ID | 7503 |
| Gene name | X inactive specific transcript | |
| Gene Alias | DXS1089 | |
| Cytomap | Xq13.2 | |
| Gene Type | ncRNA | GO ID | GO:0007549 | UniProtAcc | NA |
Top |
Malignant transformation analysis |
| Identification of the aberrant gene expression in precancerous and cancerous lesions by comparing the gene expression of stem-like cells in diseased tissues with normal stem cells |
| Entrez ID | Symbol | Replicates | Species | Organ | Tissue | Adj P-value | Log2FC | Malignancy |
| 7503 | XIST | GSM4909285 | Human | Breast | IDC | 3.08e-02 | 1.90e-01 | 0.21 |
| 7503 | XIST | GSM4909286 | Human | Breast | IDC | 4.58e-02 | 3.41e-02 | 0.1081 |
| 7503 | XIST | GSM4909293 | Human | Breast | IDC | 1.33e-61 | 7.38e-01 | 0.1581 |
| 7503 | XIST | GSM4909294 | Human | Breast | IDC | 4.85e-21 | -3.49e-01 | 0.2022 |
| 7503 | XIST | GSM4909295 | Human | Breast | IDC | 5.96e-09 | -5.78e-01 | 0.0898 |
| 7503 | XIST | GSM4909296 | Human | Breast | IDC | 3.21e-30 | -6.38e-01 | 0.1524 |
| 7503 | XIST | GSM4909297 | Human | Breast | IDC | 2.04e-21 | -3.40e-01 | 0.1517 |
| 7503 | XIST | GSM4909298 | Human | Breast | IDC | 8.19e-41 | 6.25e-01 | 0.1551 |
| 7503 | XIST | GSM4909299 | Human | Breast | IDC | 3.67e-08 | 3.57e-01 | 0.035 |
| 7503 | XIST | GSM4909301 | Human | Breast | IDC | 5.42e-60 | -9.26e-01 | 0.1577 |
| 7503 | XIST | GSM4909302 | Human | Breast | IDC | 3.02e-37 | -7.87e-01 | 0.1545 |
| 7503 | XIST | GSM4909304 | Human | Breast | IDC | 2.35e-05 | 3.02e-01 | 0.1636 |
| 7503 | XIST | GSM4909311 | Human | Breast | IDC | 9.30e-42 | -5.54e-01 | 0.1534 |
| 7503 | XIST | GSM4909312 | Human | Breast | IDC | 1.36e-15 | -3.40e-01 | 0.1552 |
| 7503 | XIST | GSM4909315 | Human | Breast | IDC | 2.12e-12 | -1.93e-01 | 0.21 |
| 7503 | XIST | GSM4909316 | Human | Breast | IDC | 1.12e-05 | -5.32e-01 | 0.21 |
| 7503 | XIST | GSM4909317 | Human | Breast | IDC | 4.56e-13 | 4.67e-01 | 0.1355 |
| 7503 | XIST | GSM4909318 | Human | Breast | IDC | 8.26e-03 | -5.89e-01 | 0.2031 |
| 7503 | XIST | GSM4909319 | Human | Breast | IDC | 1.80e-67 | -9.70e-01 | 0.1563 |
| 7503 | XIST | GSM4909320 | Human | Breast | IDC | 8.91e-25 | -9.70e-01 | 0.1575 |
| Page: 1 2 3 4 5 6 7 8 9 10 11 12 |
| Tissue | Expression Dynamics | Abbreviation |
| Breast | 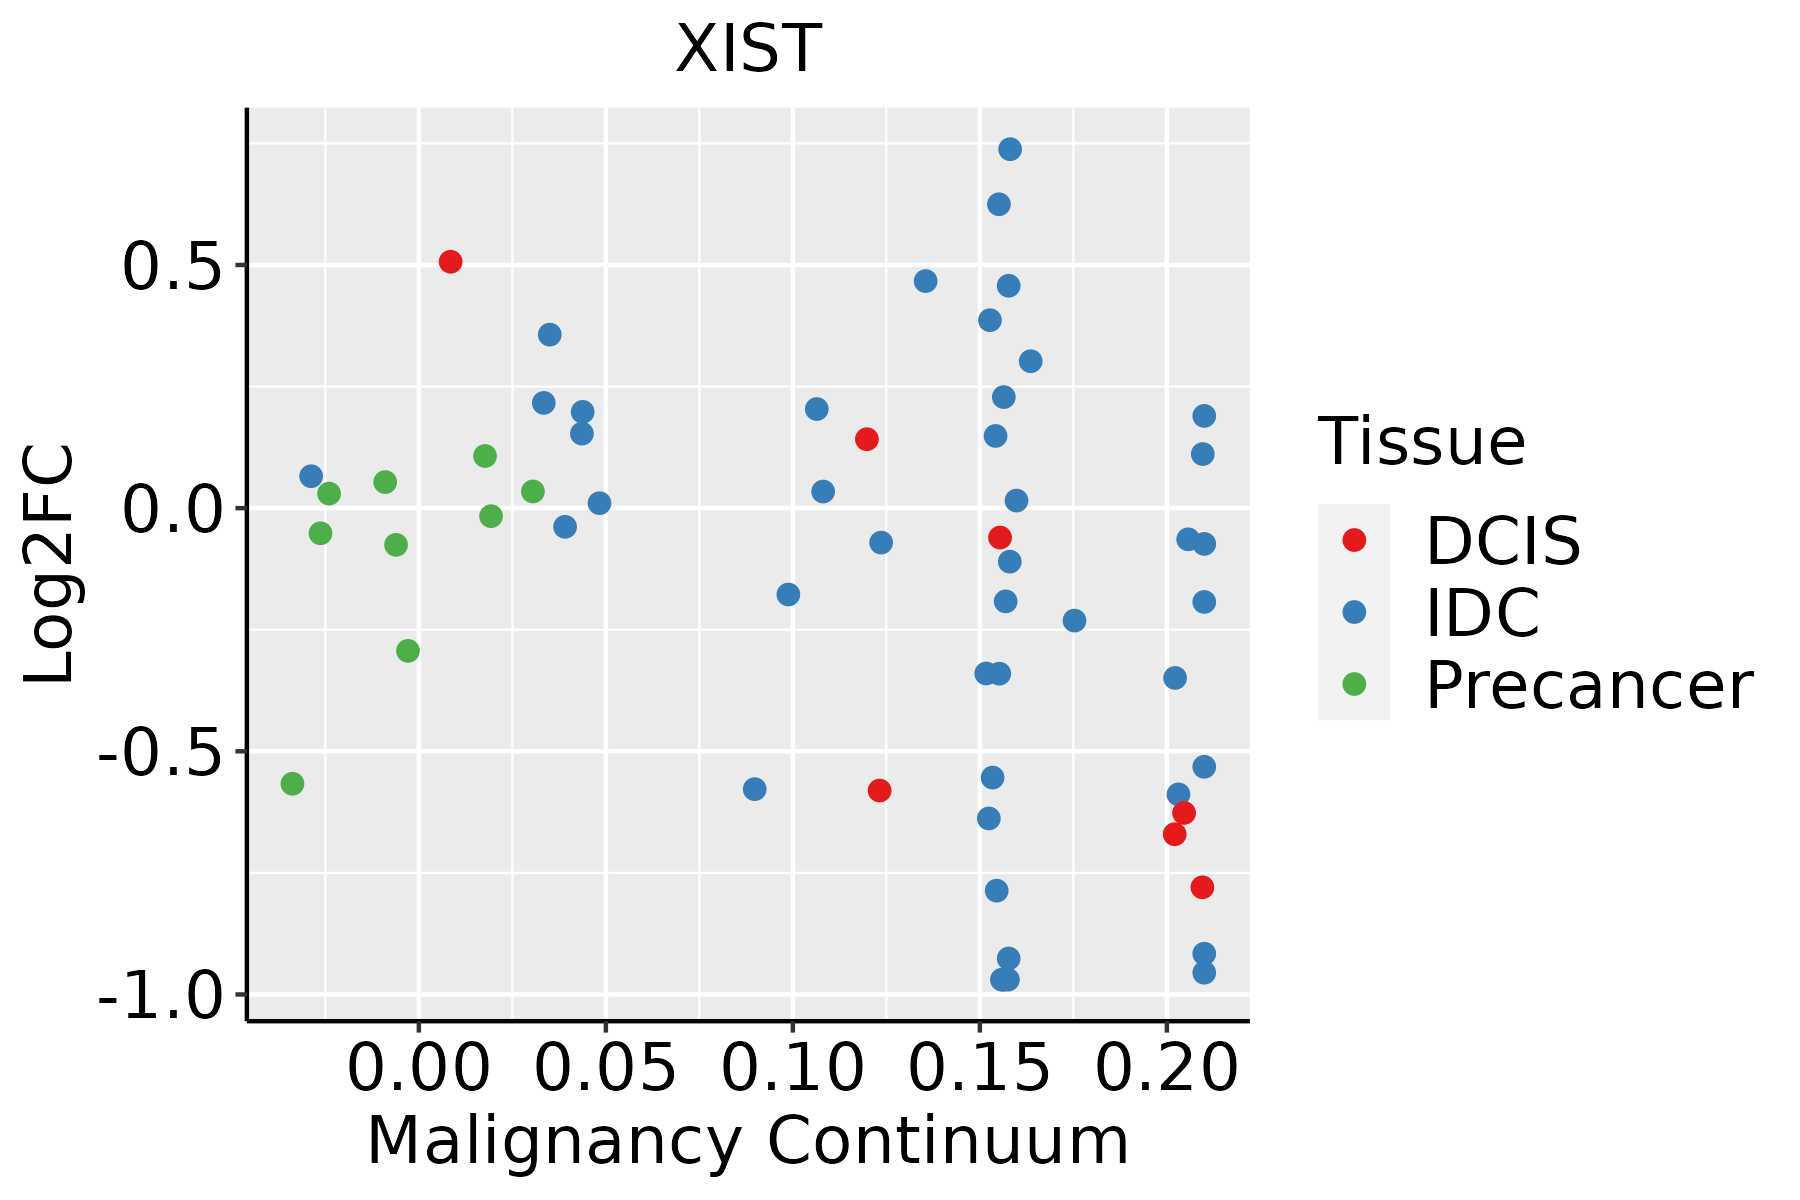 | IDC: Invasive ductal carcinoma |
| DCIS: Ductal carcinoma in situ | ||
| Precancer(BRCA1-mut): Precancerous lesion from BRCA1 mutation carriers | ||
| Cervix |  | CC: Cervix cancer |
| HSIL_HPV: HPV-infected high-grade squamous intraepithelial lesions | ||
| N_HPV: HPV-infected normal cervix | ||
| Colorectum (GSE201348) |  | FAP: Familial adenomatous polyposis |
| CRC: Colorectal cancer | ||
| Colorectum (HTA11) |  | AD: Adenomas |
| SER: Sessile serrated lesions | ||
| MSI-H: Microsatellite-high colorectal cancer | ||
| MSS: Microsatellite stable colorectal cancer | ||
| Endometrium | 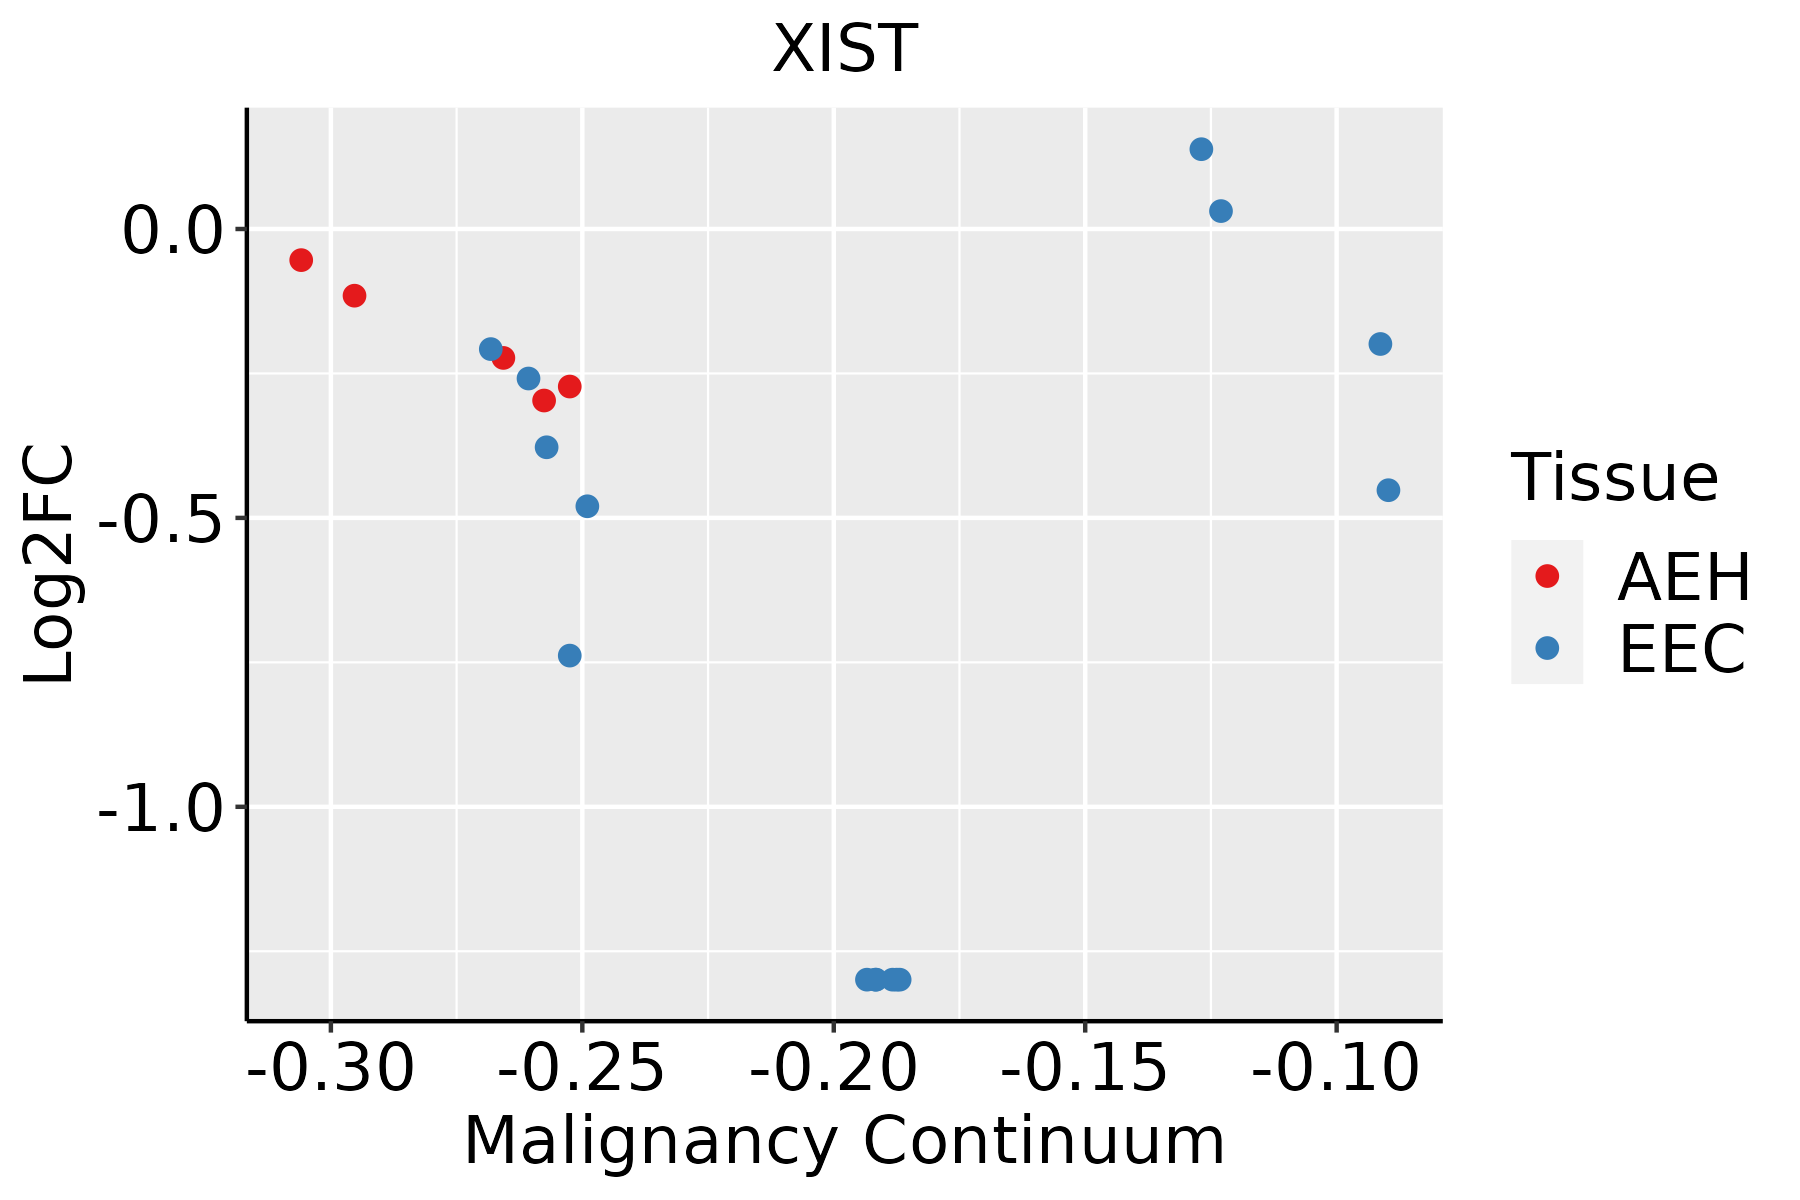 | AEH: Atypical endometrial hyperplasia |
| EEC: Endometrioid Cancer | ||
| Esophagus | 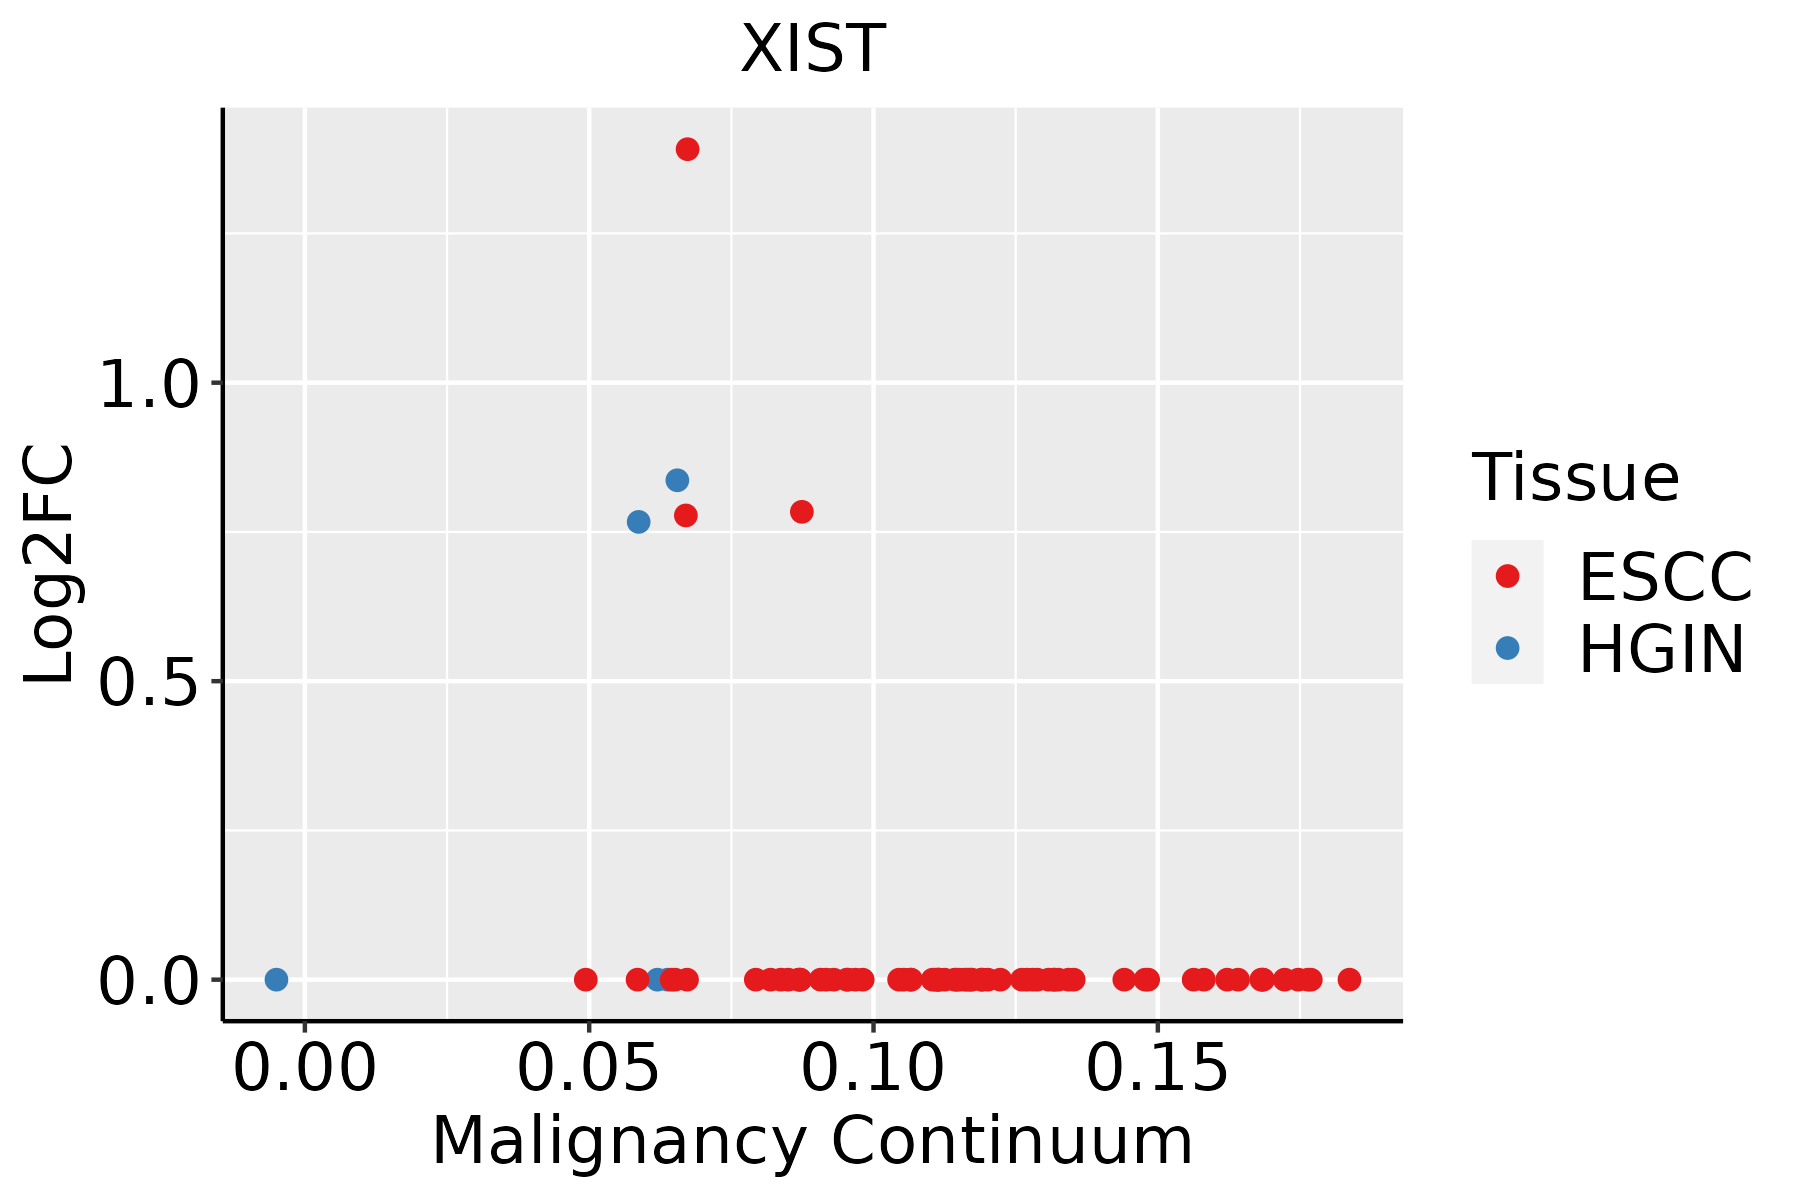 | ESCC: Esophageal squamous cell carcinoma |
| HGIN: High-grade intraepithelial neoplasias | ||
| LGIN: Low-grade intraepithelial neoplasias | ||
| GC | 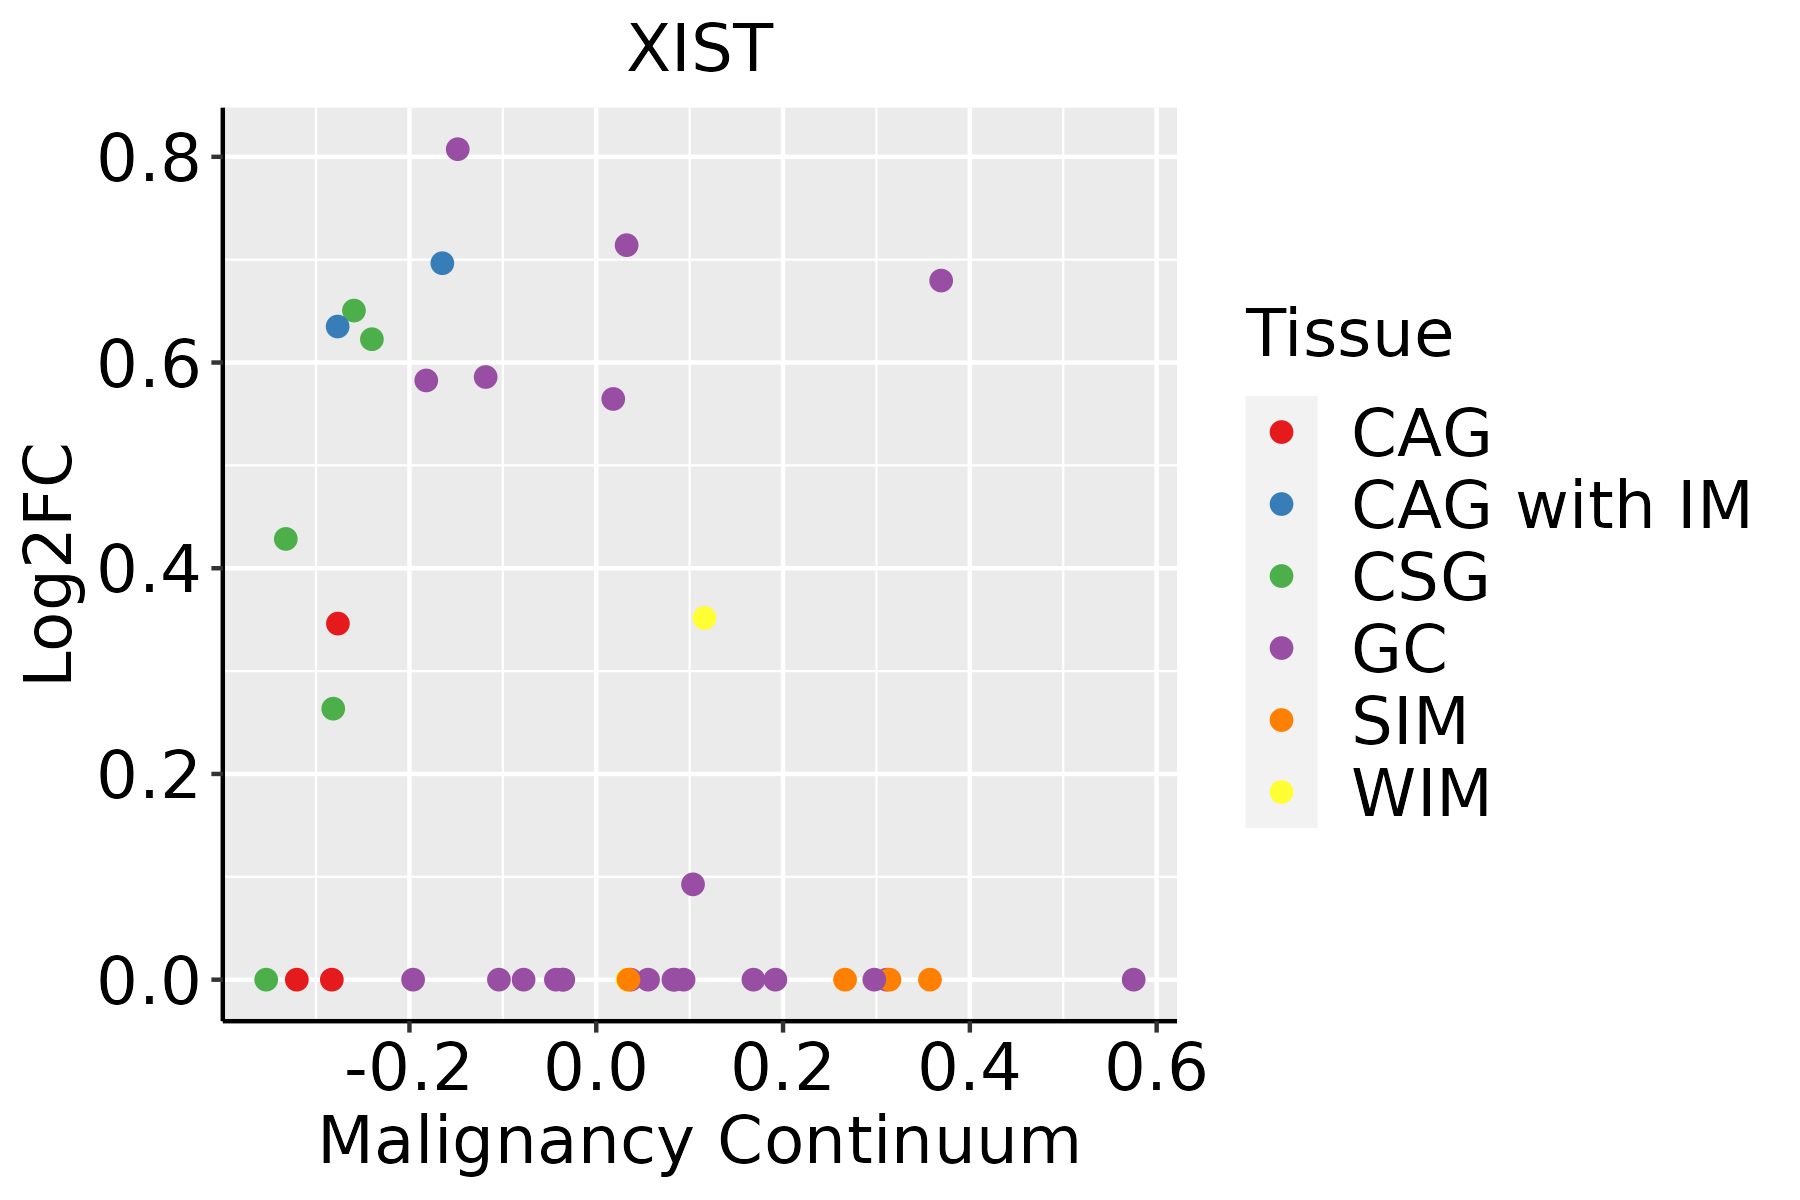 | CAG: Chronic atrophic gastritis |
| CAG with IM: Chronic atrophic gastritis with intestinal metaplasia | ||
| CSG: Chronic superficial gastritis | ||
| GC: Gastric cancer | ||
| SIM: Severe intestinal metaplasia | ||
| WIM: Wild intestinal metaplasia | ||
| Liver | 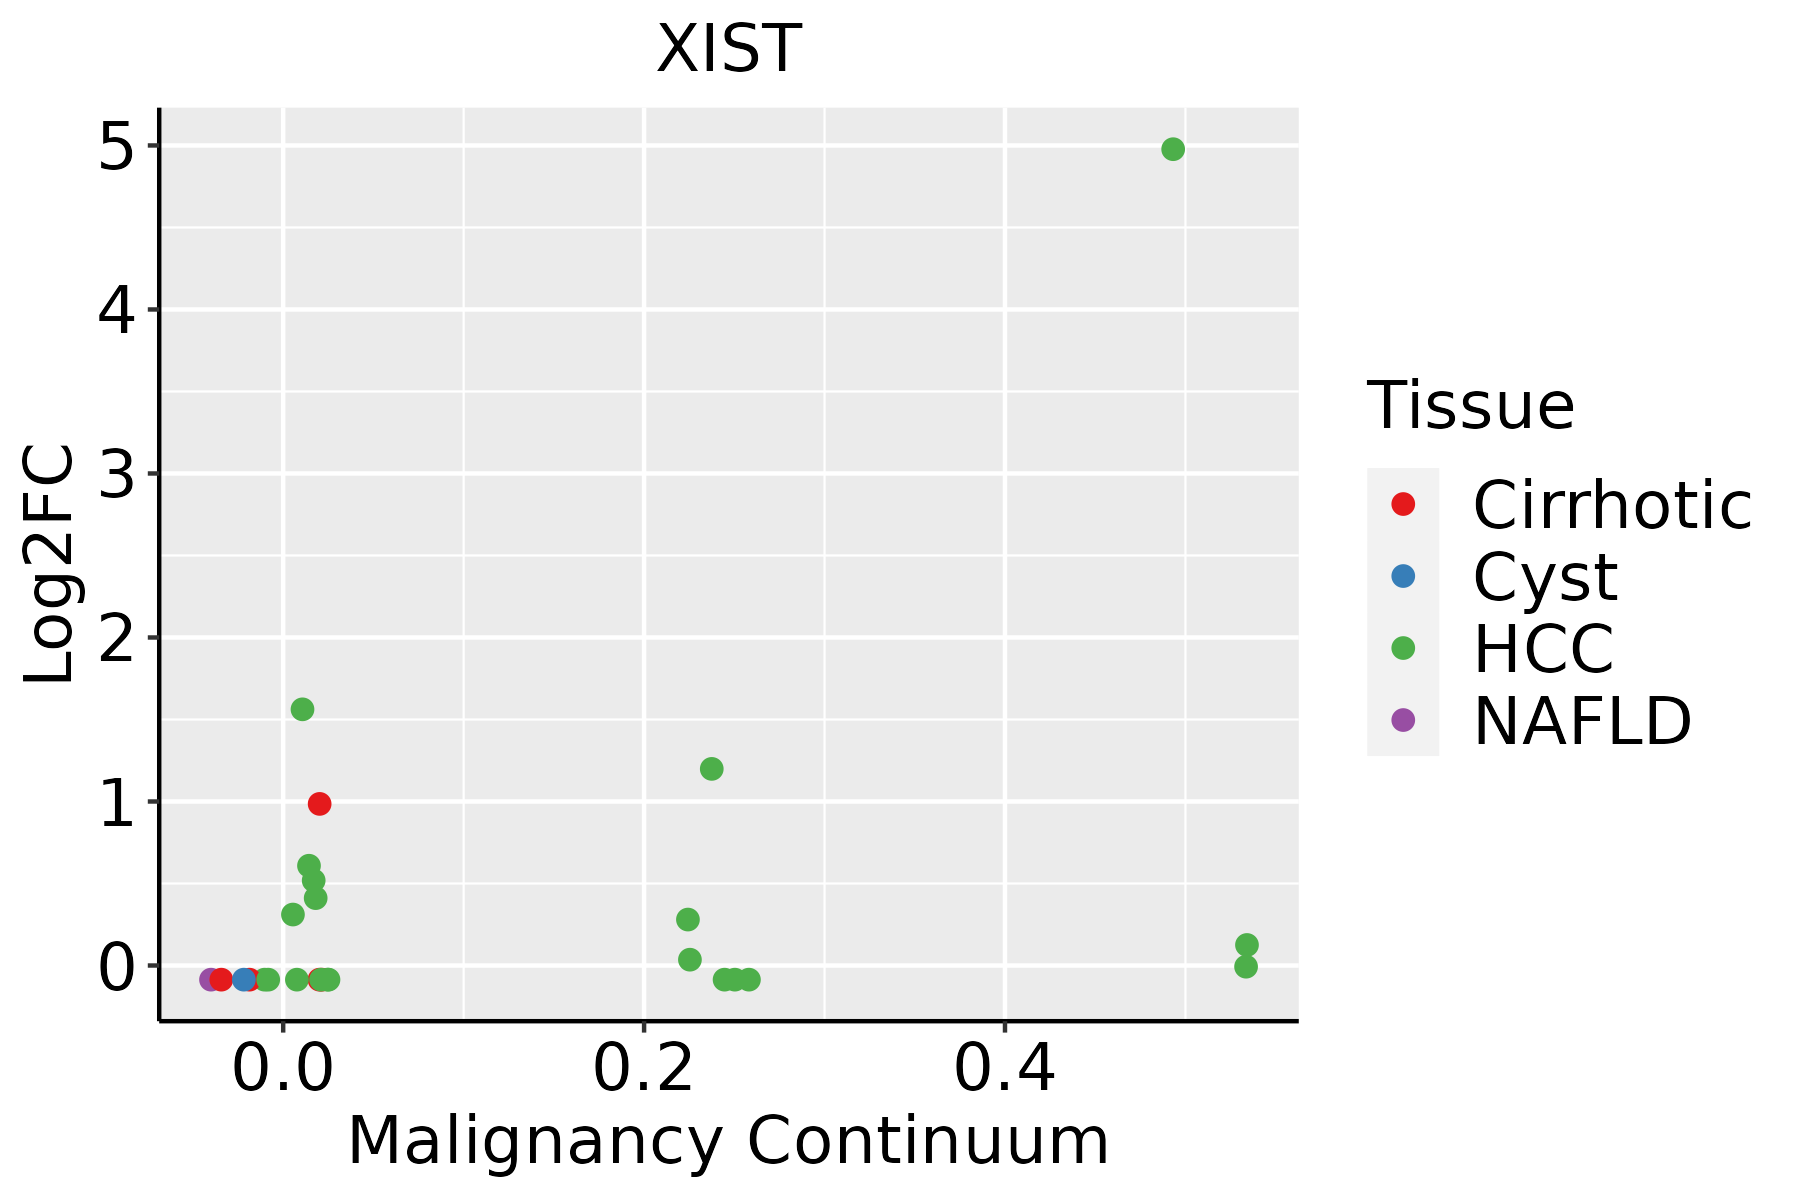 | HCC: Hepatocellular carcinoma |
| NAFLD: Non-alcoholic fatty liver disease | ||
| Lung | 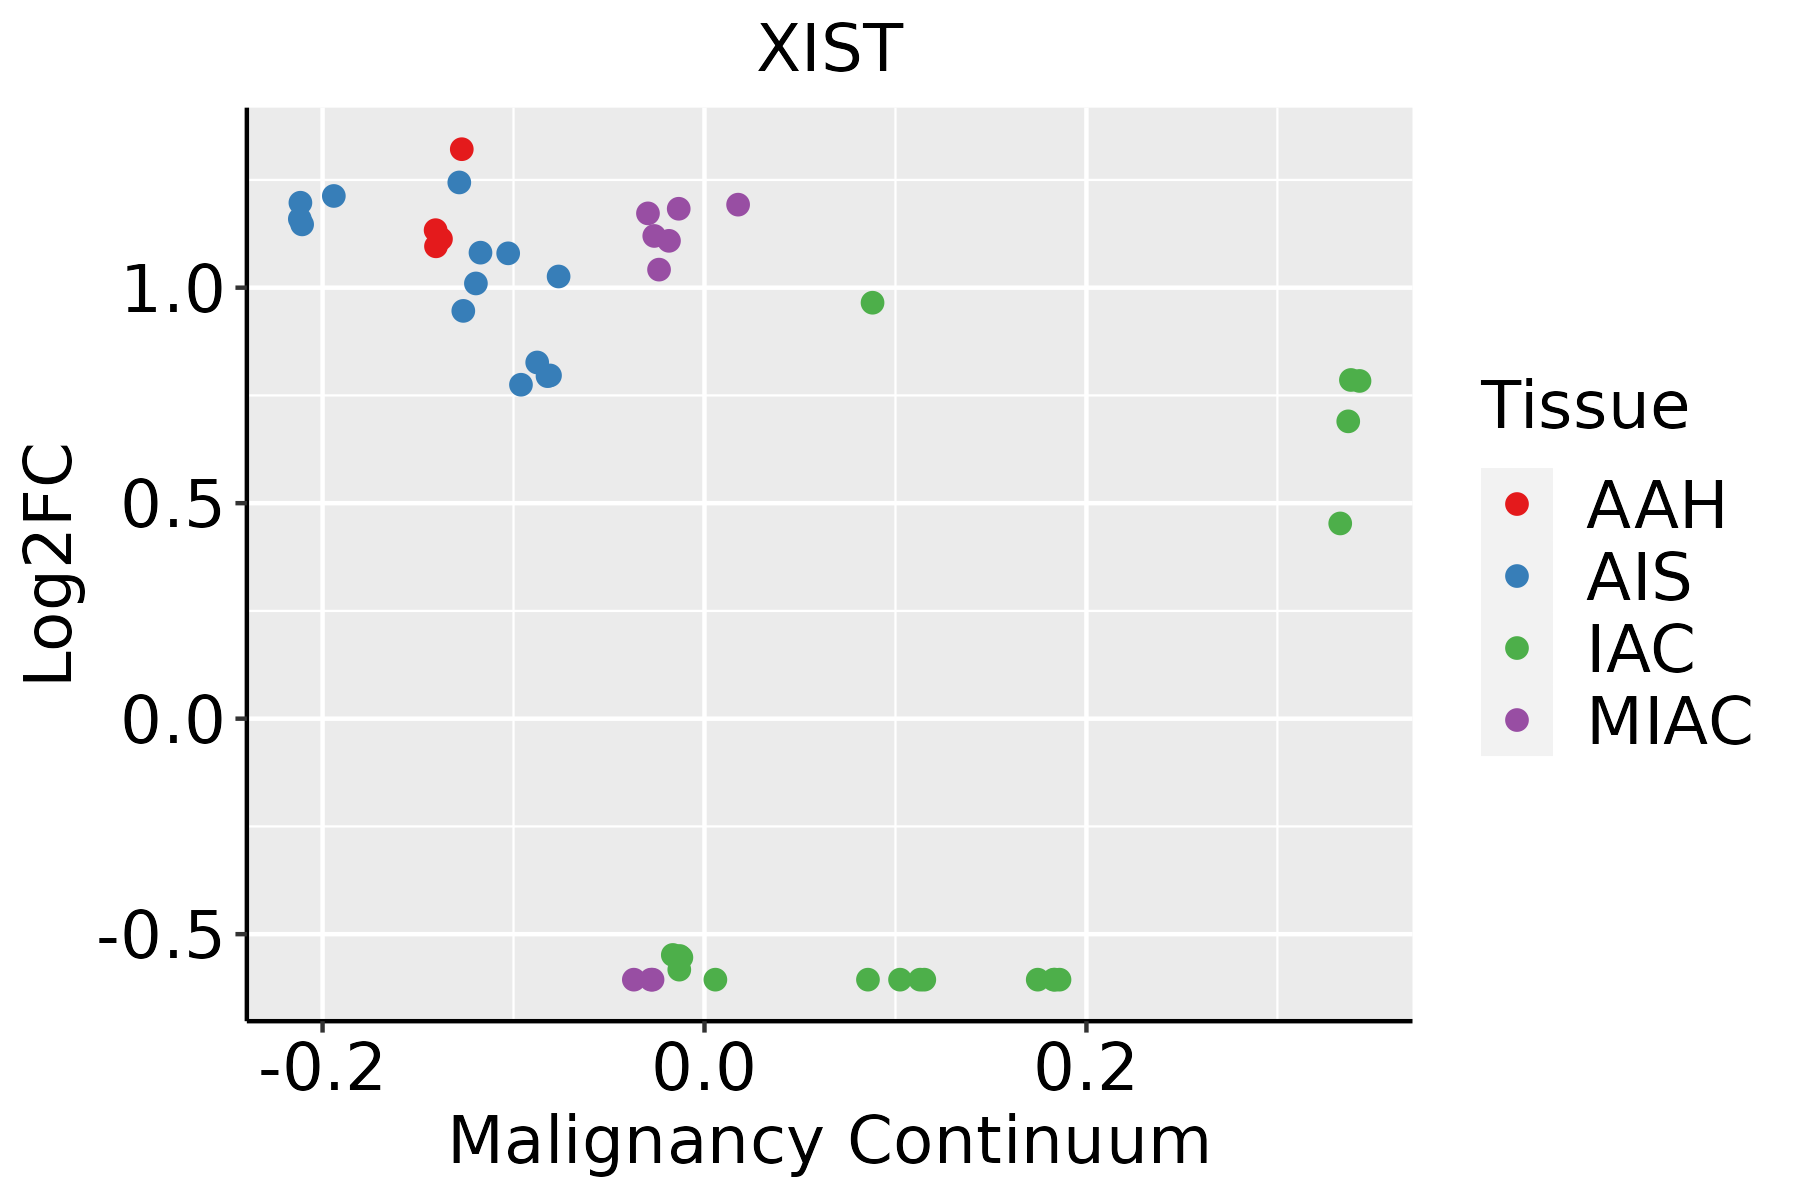 | AAH: Atypical adenomatous hyperplasia |
| AIS: Adenocarcinoma in situ | ||
| IAC: Invasive lung adenocarcinoma | ||
| MIA: Minimally invasive adenocarcinoma | ||
| Oral Cavity | 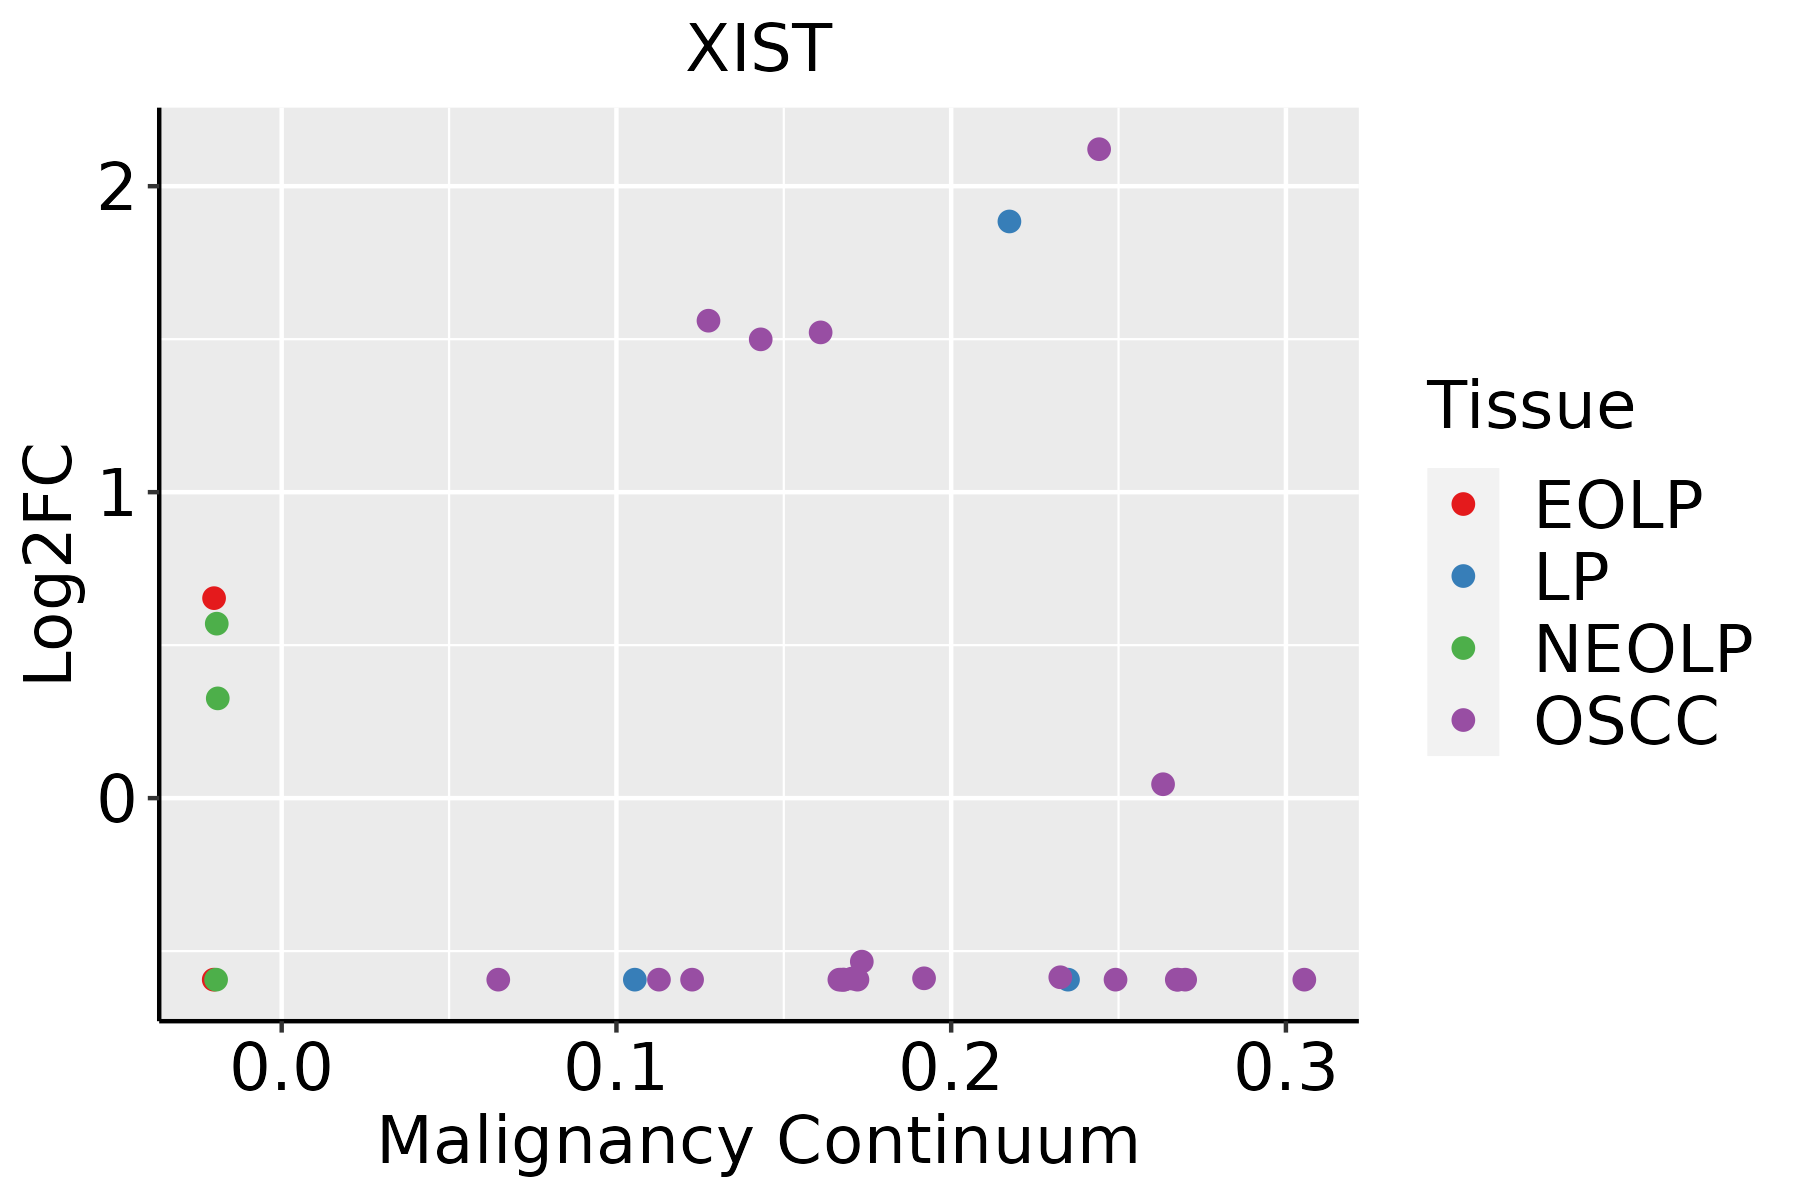 | EOLP: Erosive Oral lichen planus |
| LP: leukoplakia | ||
| NEOLP: Non-erosive oral lichen planus | ||
| OSCC: Oral squamous cell carcinoma | ||
| Skin | 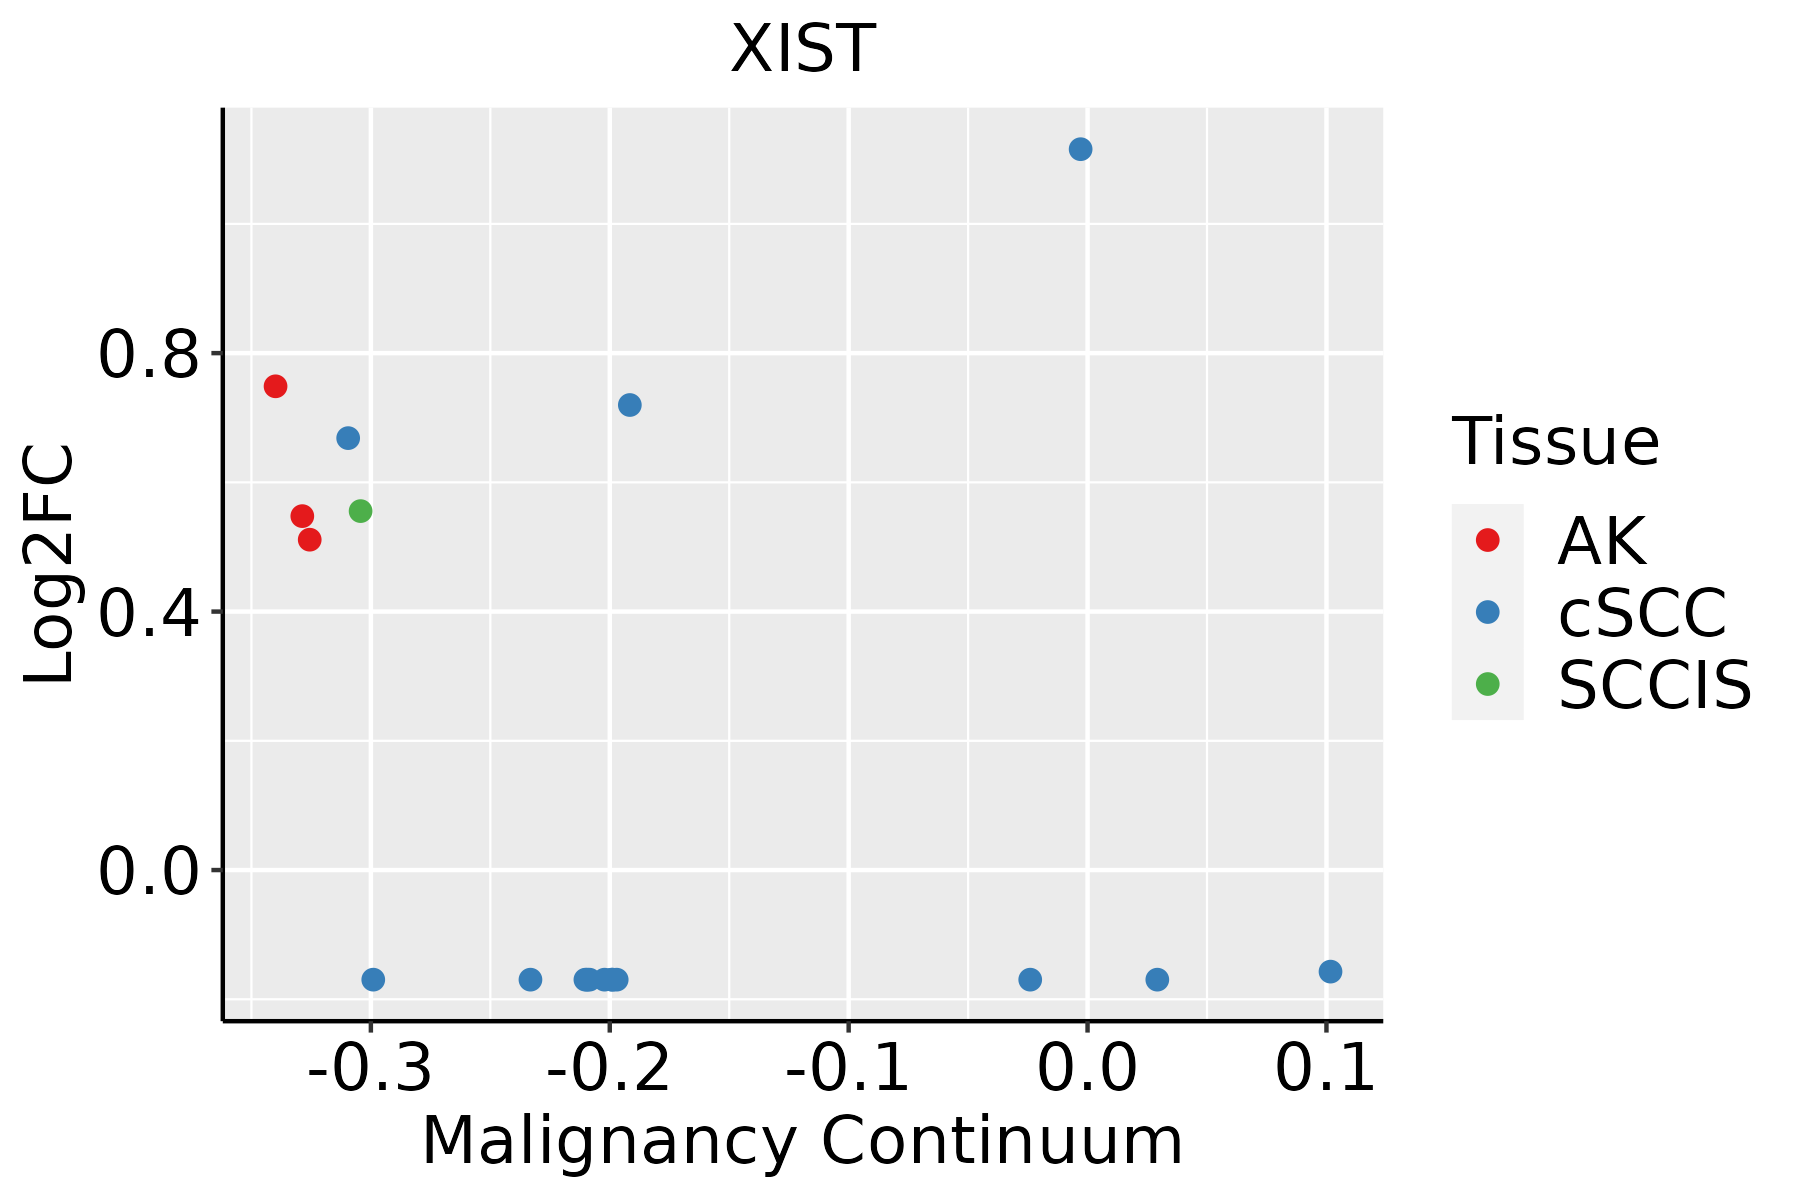 | AK: Actinic keratosis |
| cSCC: Cutaneous squamous cell carcinoma | ||
| SCCIS:squamous cell carcinoma in situ | ||
| Thyroid | 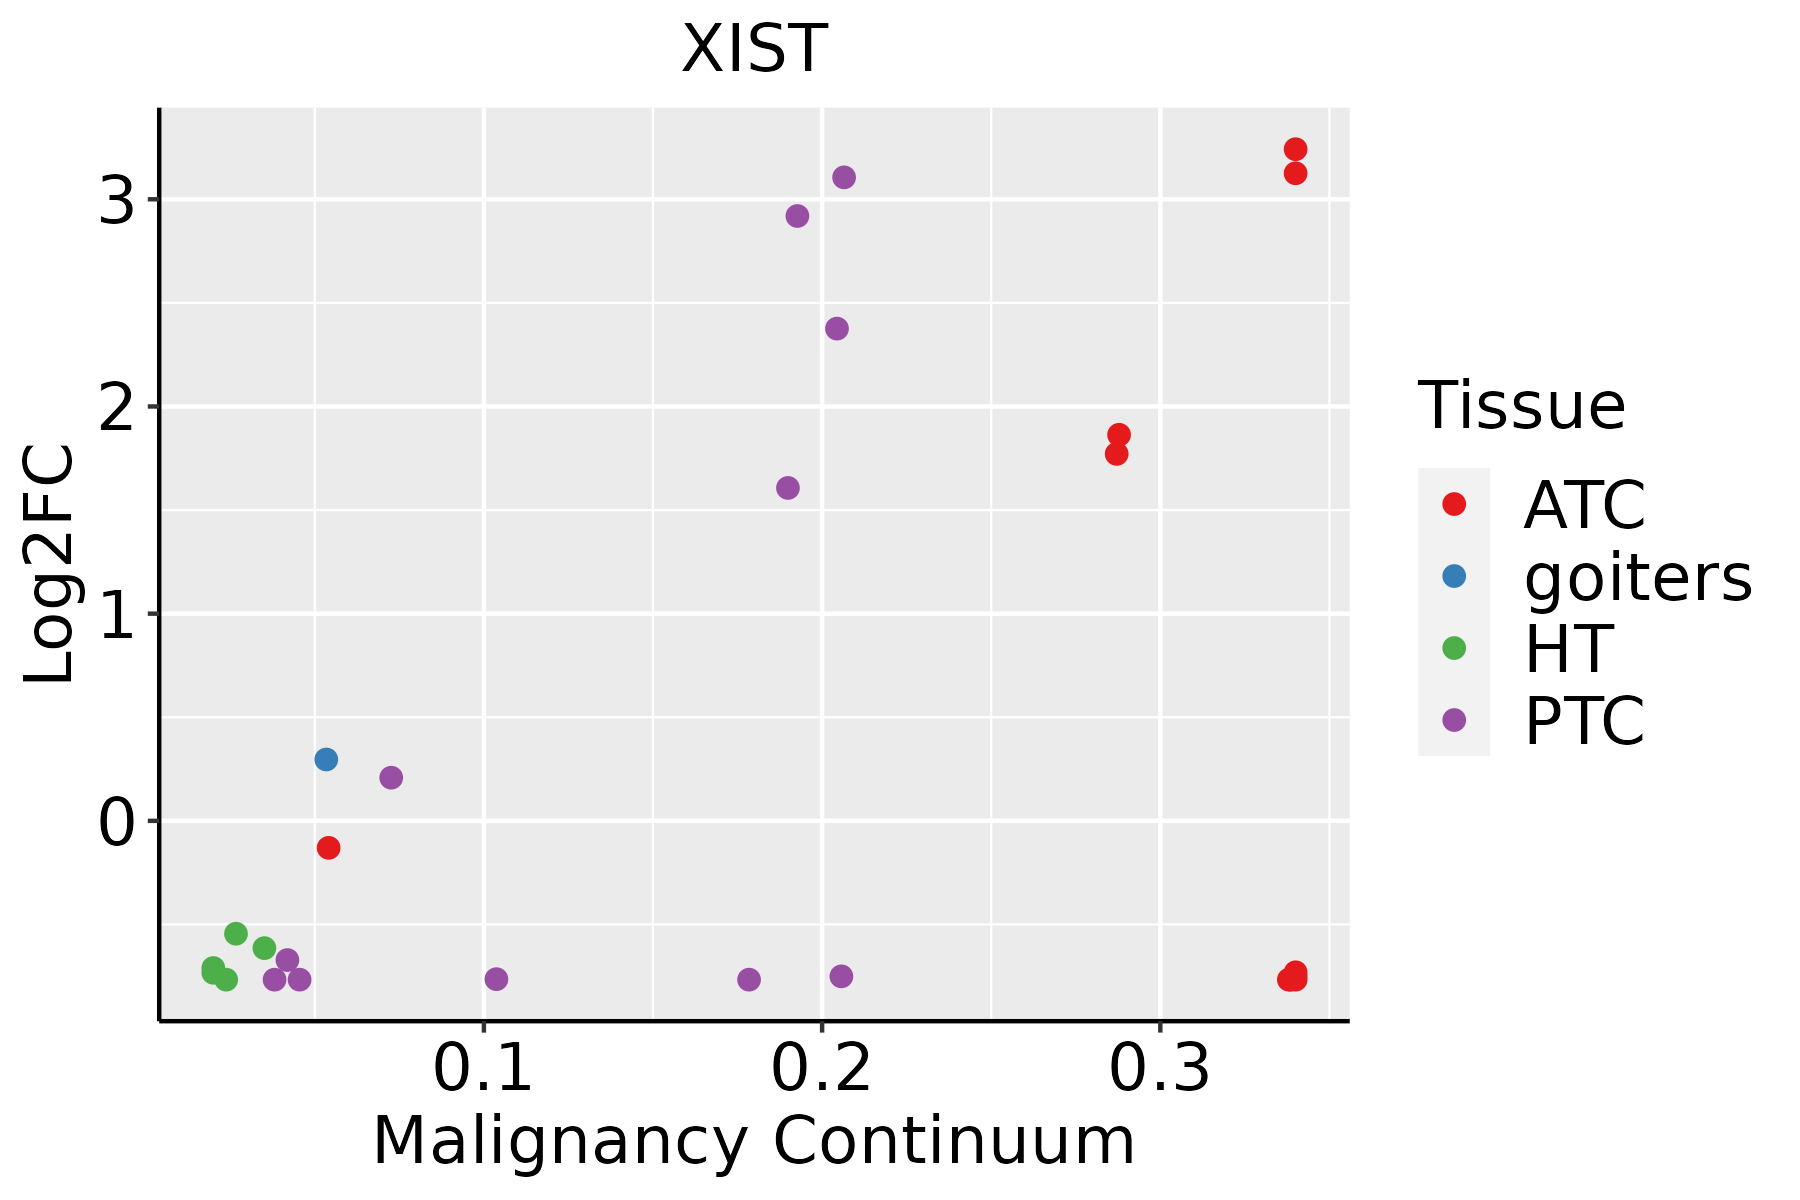 | ATC: Anaplastic thyroid cancer |
| HT: Hashimoto's thyroiditis | ||
| PTC: Papillary thyroid cancer |
| ∗log2FC in expression of this searched gene in stem-like cells from each diseased tissue sample relative to stem-like cells in normal samples in each tissue plotted against the malignancy continuum. Samples are colored based on if they are from different disease stage. |
Top |
Malignant transformation related pathway analysis |
| Find out the enriched GO biological processes and KEGG pathways involved in transition from healthy to precancer to cancer |
| Tissue | Disease Stage | Enriched GO biological Processes |
| Colorectum | AD |  |
| Colorectum | SER |  |
| Colorectum | MSS |  |
| Colorectum | MSI-H |  |
| Colorectum | FAP |  |
| ∗Top 15 enriched GO BP terms are showed in the bar plot of each disease state in each tissue. Each row represents a significant GO biological process which is colored according to the -log10(p.adjust). |
| Page: 1 2 3 4 5 6 7 8 9 |
| GO ID | Tissue | Disease Stage | Description | Gene Ratio | Bg Ratio | pvalue | p.adjust | Count |
| GO:00400295 | Esophagus | ESCC | regulation of gene expression, epigenetic | 74/8552 | 105/18723 | 2.24e-07 | 3.42e-06 | 74 |
| GO:00090484 | Esophagus | ESCC | dosage compensation by inactivation of X chromosome | 14/8552 | 16/18723 | 6.78e-04 | 3.56e-03 | 14 |
| GO:00075494 | Esophagus | ESCC | dosage compensation | 14/8552 | 18/18723 | 5.77e-03 | 2.14e-02 | 14 |
| GO:0040029 | Liver | HCC | regulation of gene expression, epigenetic | 61/7958 | 105/18723 | 9.02e-04 | 5.31e-03 | 61 |
| GO:0009048 | Liver | HCC | dosage compensation by inactivation of X chromosome | 13/7958 | 16/18723 | 1.84e-03 | 9.42e-03 | 13 |
| GO:0007549 | Liver | HCC | dosage compensation | 13/7958 | 18/18723 | 1.05e-02 | 3.89e-02 | 13 |
| GO:00400294 | Oral cavity | OSCC | regulation of gene expression, epigenetic | 59/7305 | 105/18723 | 2.62e-04 | 1.68e-03 | 59 |
| GO:00090483 | Oral cavity | OSCC | dosage compensation by inactivation of X chromosome | 13/7305 | 16/18723 | 7.05e-04 | 3.89e-03 | 13 |
| GO:00075493 | Oral cavity | OSCC | dosage compensation | 13/7305 | 18/18723 | 4.45e-03 | 1.79e-02 | 13 |
| GO:004002911 | Oral cavity | LP | regulation of gene expression, epigenetic | 39/4623 | 105/18723 | 3.00e-03 | 2.05e-02 | 39 |
| GO:00400292 | Oral cavity | EOLP | regulation of gene expression, epigenetic | 24/2218 | 105/18723 | 1.07e-03 | 7.87e-03 | 24 |
| GO:00090481 | Oral cavity | EOLP | dosage compensation by inactivation of X chromosome | 7/2218 | 16/18723 | 1.40e-03 | 9.58e-03 | 7 |
| GO:00075491 | Oral cavity | EOLP | dosage compensation | 7/2218 | 18/18723 | 3.15e-03 | 1.84e-02 | 7 |
| GO:00400293 | Oral cavity | NEOLP | regulation of gene expression, epigenetic | 24/2005 | 105/18723 | 2.48e-04 | 2.55e-03 | 24 |
| GO:00090482 | Oral cavity | NEOLP | dosage compensation by inactivation of X chromosome | 6/2005 | 16/18723 | 4.64e-03 | 2.56e-02 | 6 |
| GO:00075492 | Oral cavity | NEOLP | dosage compensation | 6/2005 | 18/18723 | 8.92e-03 | 4.25e-02 | 6 |
| GO:00400296 | Skin | AK | regulation of gene expression, epigenetic | 19/1910 | 105/18723 | 9.43e-03 | 4.60e-02 | 19 |
| GO:004002912 | Skin | cSCC | regulation of gene expression, epigenetic | 39/4864 | 105/18723 | 7.56e-03 | 3.53e-02 | 39 |
| GO:00400297 | Thyroid | PTC | regulation of gene expression, epigenetic | 57/5968 | 105/18723 | 1.60e-06 | 2.25e-05 | 57 |
| GO:00090485 | Thyroid | PTC | dosage compensation by inactivation of X chromosome | 10/5968 | 16/18723 | 1.13e-02 | 4.49e-02 | 10 |
| Page: 1 2 |
| Pathway ID | Tissue | Disease Stage | Description | Gene Ratio | Bg Ratio | pvalue | p.adjust | qvalue | Count |
| Page: 1 |
Top |
Cell-cell communication analysis |
| Identification of potential cell-cell interactions between two cell types and their ligand-receptor pairs for different disease states |
| Ligand | Receptor | LRpair | Pathway | Tissue | Disease Stage |
| Page: 1 |
Top |
Single-cell gene regulatory network inference analysis |
| Find out the significant the regulons (TFs) and the target genes of each regulon across cell types for different disease states |
| TF | Cell Type | Tissue | Disease Stage | Target Gene | RSS | Regulon Activity |
| ∗The dot plots of a searched regulon are shown for all cell subpopulations in each disease state of each tissue based on the regulon specific score inferred using pySCENIC and by calculating the average expression. |
| Page: 1 |
Top |
Somatic mutation of malignant transformation related genes |
| Annotation of somatic variants for genes involved in malignant transformation |
| Hugo Symbol | Variant Class | Variant Classification | dbSNP RS | HGVSc | HGVSp | HGVSp Short | SWISSPROT | BIOTYPE | SIFT | PolyPhen | Tumor Sample Barcode | Tissue | Histology | Sex | Age | Stage | Therapy Types | Drugs | Outcome |
| Page: 1 |
Top |
Related drugs of malignant transformation related genes |
| Identification of chemicals and drugs interact with genes involved in malignant transfromation |
| (DGIdb 4.0) |
| Entrez ID | Symbol | Category | Interaction Types | Drug Claim Name | Drug Name | PMIDs |
| Page: 1 |

Copyright 2023-Present -The University of Texas Health Science Center at Houston |