
|
|||||
|
 | |
| |
| |
| |
| |
| |
|
Gene: XIAP |
Gene summary for XIAP |
| Gene information | Species | Human | Gene symbol | XIAP | Gene ID | 331 |
| Gene name | X-linked inhibitor of apoptosis | |
| Gene Alias | API3 | |
| Cytomap | Xq25 | |
| Gene Type | protein-coding | GO ID | GO:0000209 | UniProtAcc | P98170 |
Top |
Malignant transformation analysis |
| Identification of the aberrant gene expression in precancerous and cancerous lesions by comparing the gene expression of stem-like cells in diseased tissues with normal stem cells |
| Entrez ID | Symbol | Replicates | Species | Organ | Tissue | Adj P-value | Log2FC | Malignancy |
| 331 | XIAP | HTA11_347_2000001011 | Human | Colorectum | AD | 1.06e-26 | 8.98e-01 | -0.1954 |
| 331 | XIAP | HTA11_411_2000001011 | Human | Colorectum | SER | 2.06e-02 | 8.69e-01 | -0.2602 |
| 331 | XIAP | HTA11_696_2000001011 | Human | Colorectum | AD | 1.03e-02 | 4.18e-01 | -0.1464 |
| 331 | XIAP | HTA11_1391_2000001011 | Human | Colorectum | AD | 1.91e-02 | 4.65e-01 | -0.059 |
| 331 | XIAP | HTA11_99999965104_69814 | Human | Colorectum | MSS | 4.24e-02 | 4.20e-01 | 0.281 |
| 331 | XIAP | HTA11_99999974143_84620 | Human | Colorectum | MSS | 1.34e-06 | 6.05e-01 | 0.3005 |
| 331 | XIAP | F007 | Human | Colorectum | FAP | 6.74e-03 | -3.65e-01 | 0.1176 |
| 331 | XIAP | A002-C-010 | Human | Colorectum | FAP | 3.24e-06 | -1.83e-01 | 0.242 |
| 331 | XIAP | A001-C-207 | Human | Colorectum | FAP | 2.12e-02 | -2.69e-01 | 0.1278 |
| 331 | XIAP | A015-C-203 | Human | Colorectum | FAP | 2.09e-24 | -3.30e-01 | -0.1294 |
| 331 | XIAP | A015-C-204 | Human | Colorectum | FAP | 2.67e-05 | -3.24e-01 | -0.0228 |
| 331 | XIAP | A002-C-201 | Human | Colorectum | FAP | 1.83e-05 | -2.18e-01 | 0.0324 |
| 331 | XIAP | A002-C-203 | Human | Colorectum | FAP | 1.62e-05 | -1.48e-01 | 0.2786 |
| 331 | XIAP | A001-C-108 | Human | Colorectum | FAP | 1.44e-14 | -1.33e-01 | -0.0272 |
| 331 | XIAP | A002-C-205 | Human | Colorectum | FAP | 1.03e-11 | -2.44e-01 | -0.1236 |
| 331 | XIAP | A001-C-104 | Human | Colorectum | FAP | 1.12e-05 | -2.01e-01 | 0.0184 |
| 331 | XIAP | A015-C-006 | Human | Colorectum | FAP | 1.11e-08 | -4.28e-01 | -0.0994 |
| 331 | XIAP | A015-C-106 | Human | Colorectum | FAP | 2.68e-12 | -2.47e-01 | -0.0511 |
| 331 | XIAP | A002-C-114 | Human | Colorectum | FAP | 5.75e-09 | -2.42e-01 | -0.1561 |
| 331 | XIAP | A015-C-104 | Human | Colorectum | FAP | 1.39e-27 | -3.74e-01 | -0.1899 |
| Page: 1 2 3 4 5 6 7 8 |
| Tissue | Expression Dynamics | Abbreviation |
| Colorectum (GSE201348) |  | FAP: Familial adenomatous polyposis |
| CRC: Colorectal cancer | ||
| Colorectum (HTA11) |  | AD: Adenomas |
| SER: Sessile serrated lesions | ||
| MSI-H: Microsatellite-high colorectal cancer | ||
| MSS: Microsatellite stable colorectal cancer | ||
| Esophagus | 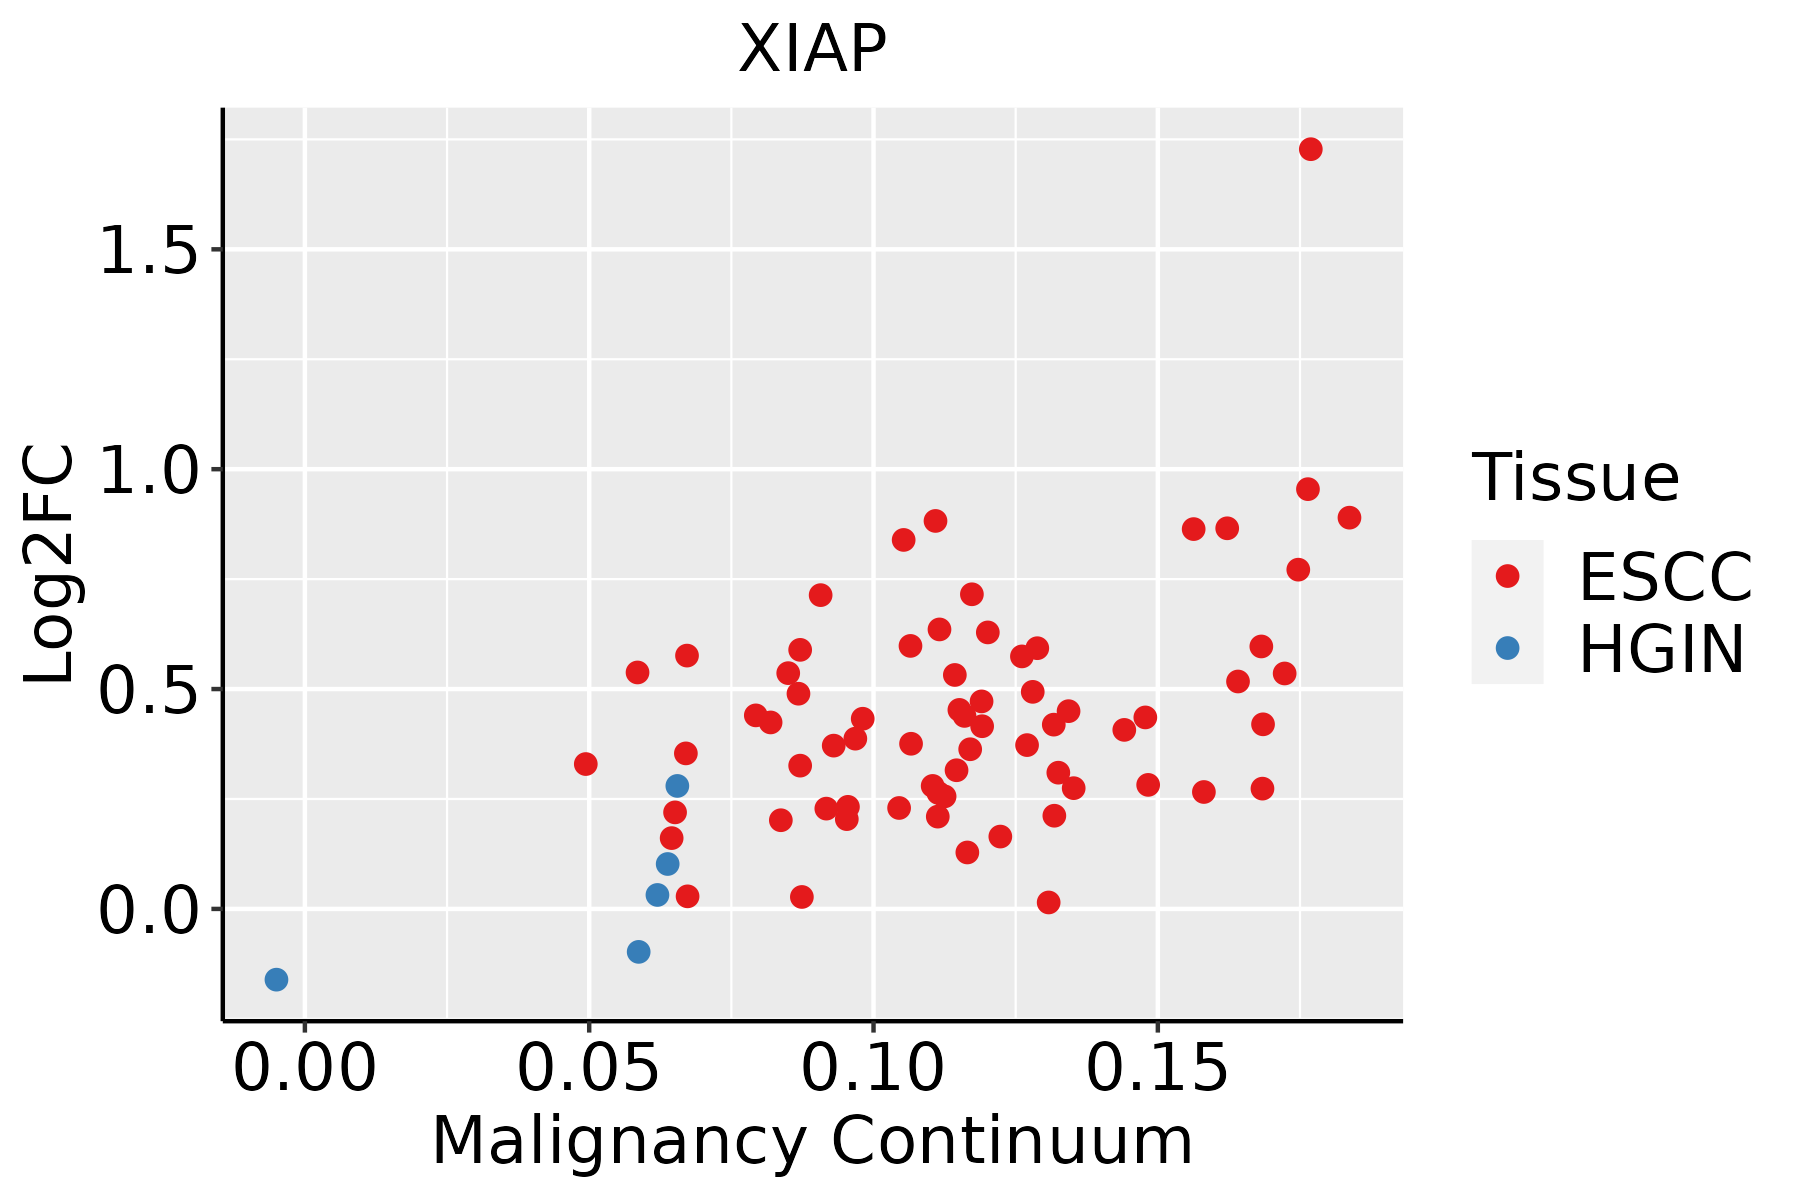 | ESCC: Esophageal squamous cell carcinoma |
| HGIN: High-grade intraepithelial neoplasias | ||
| LGIN: Low-grade intraepithelial neoplasias | ||
| Liver | 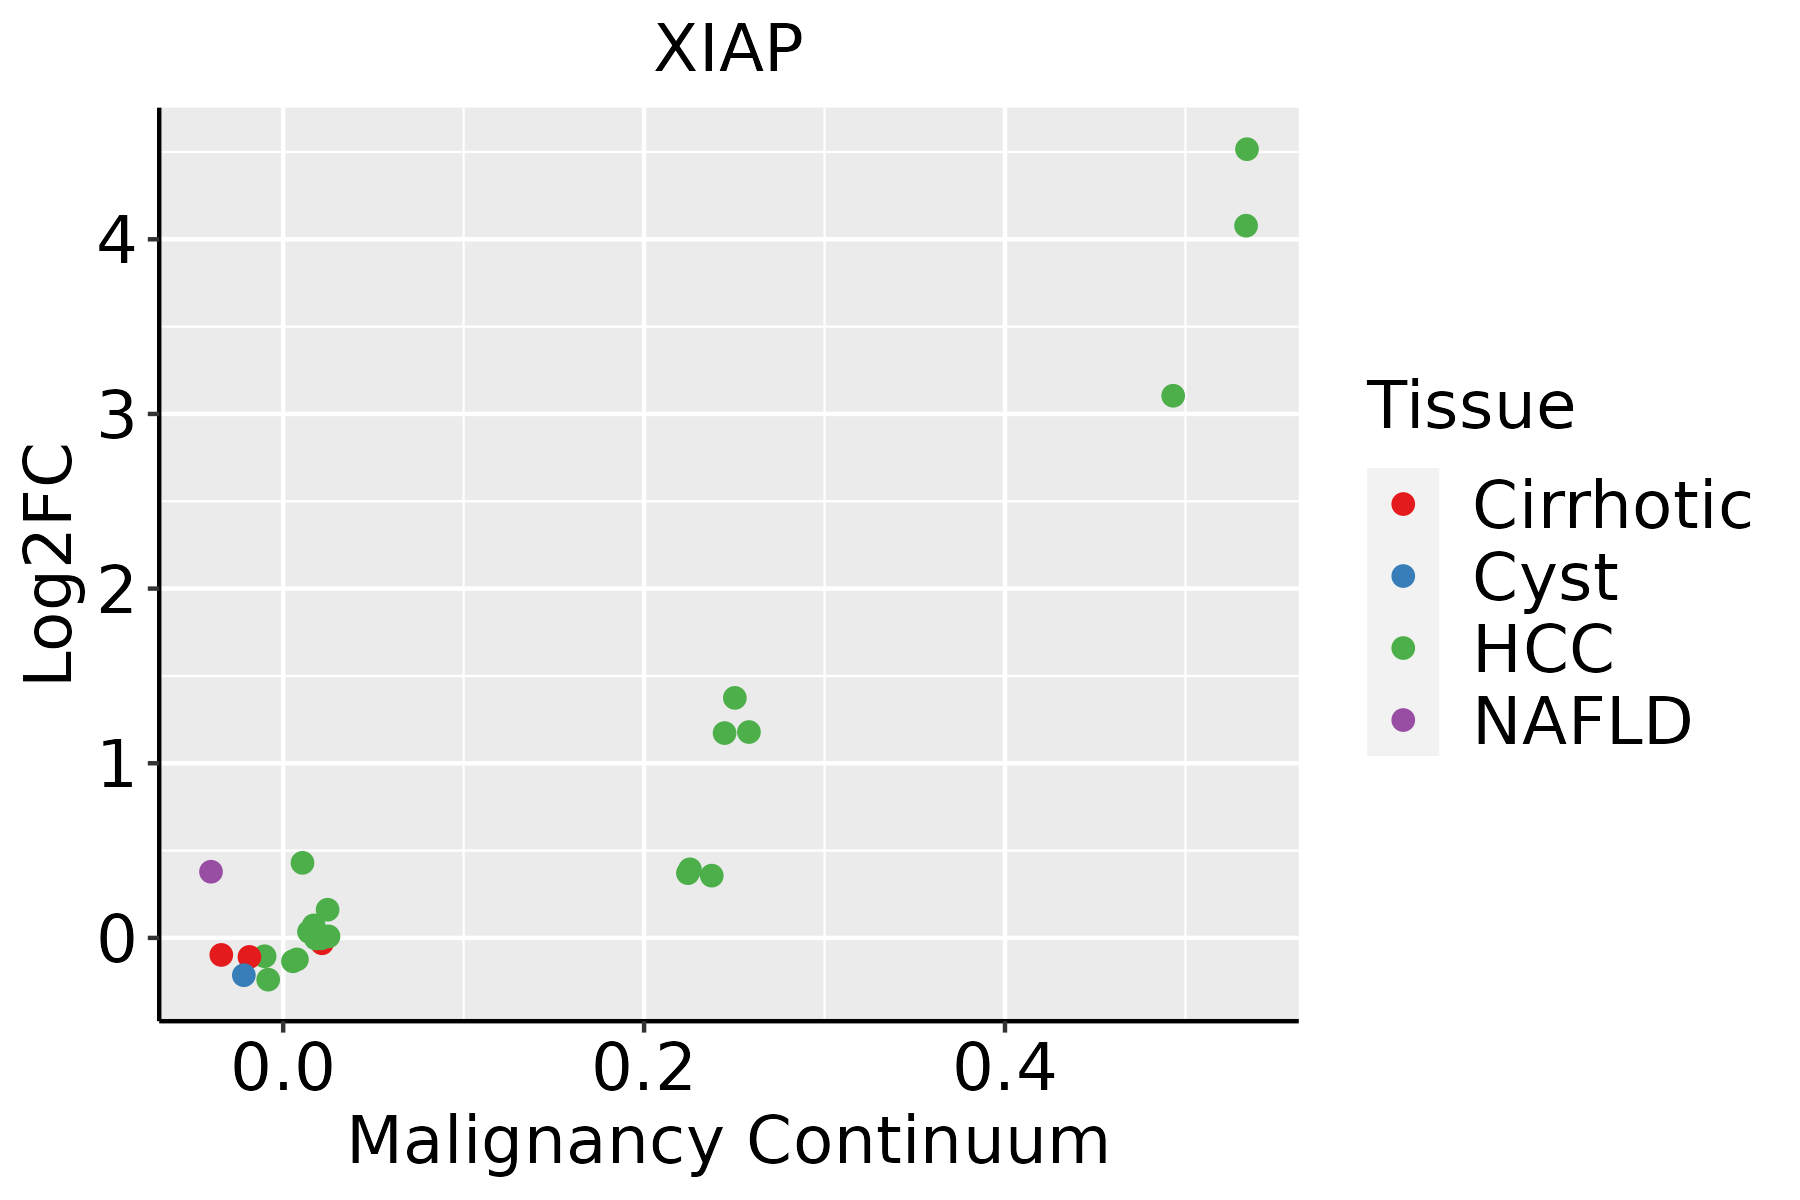 | HCC: Hepatocellular carcinoma |
| NAFLD: Non-alcoholic fatty liver disease | ||
| Oral Cavity | 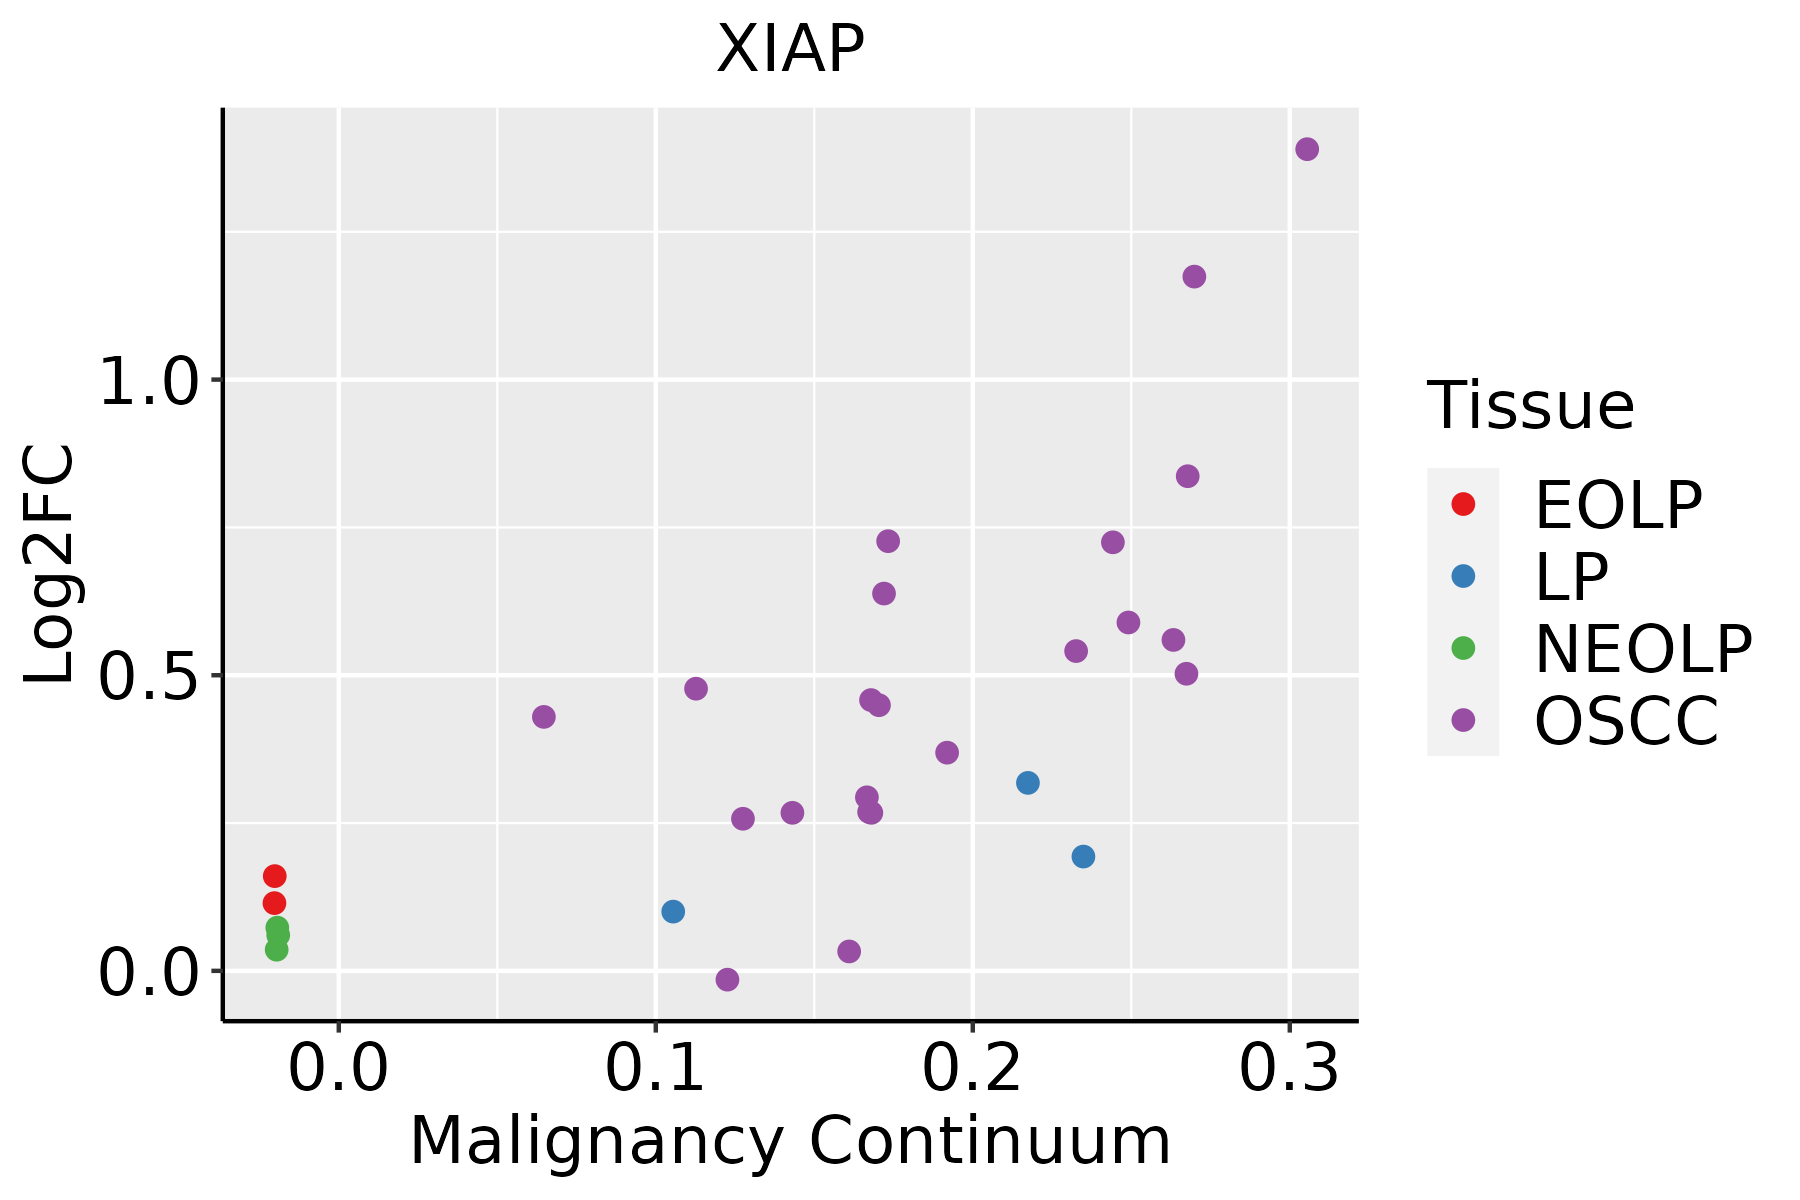 | EOLP: Erosive Oral lichen planus |
| LP: leukoplakia | ||
| NEOLP: Non-erosive oral lichen planus | ||
| OSCC: Oral squamous cell carcinoma | ||
| Skin | 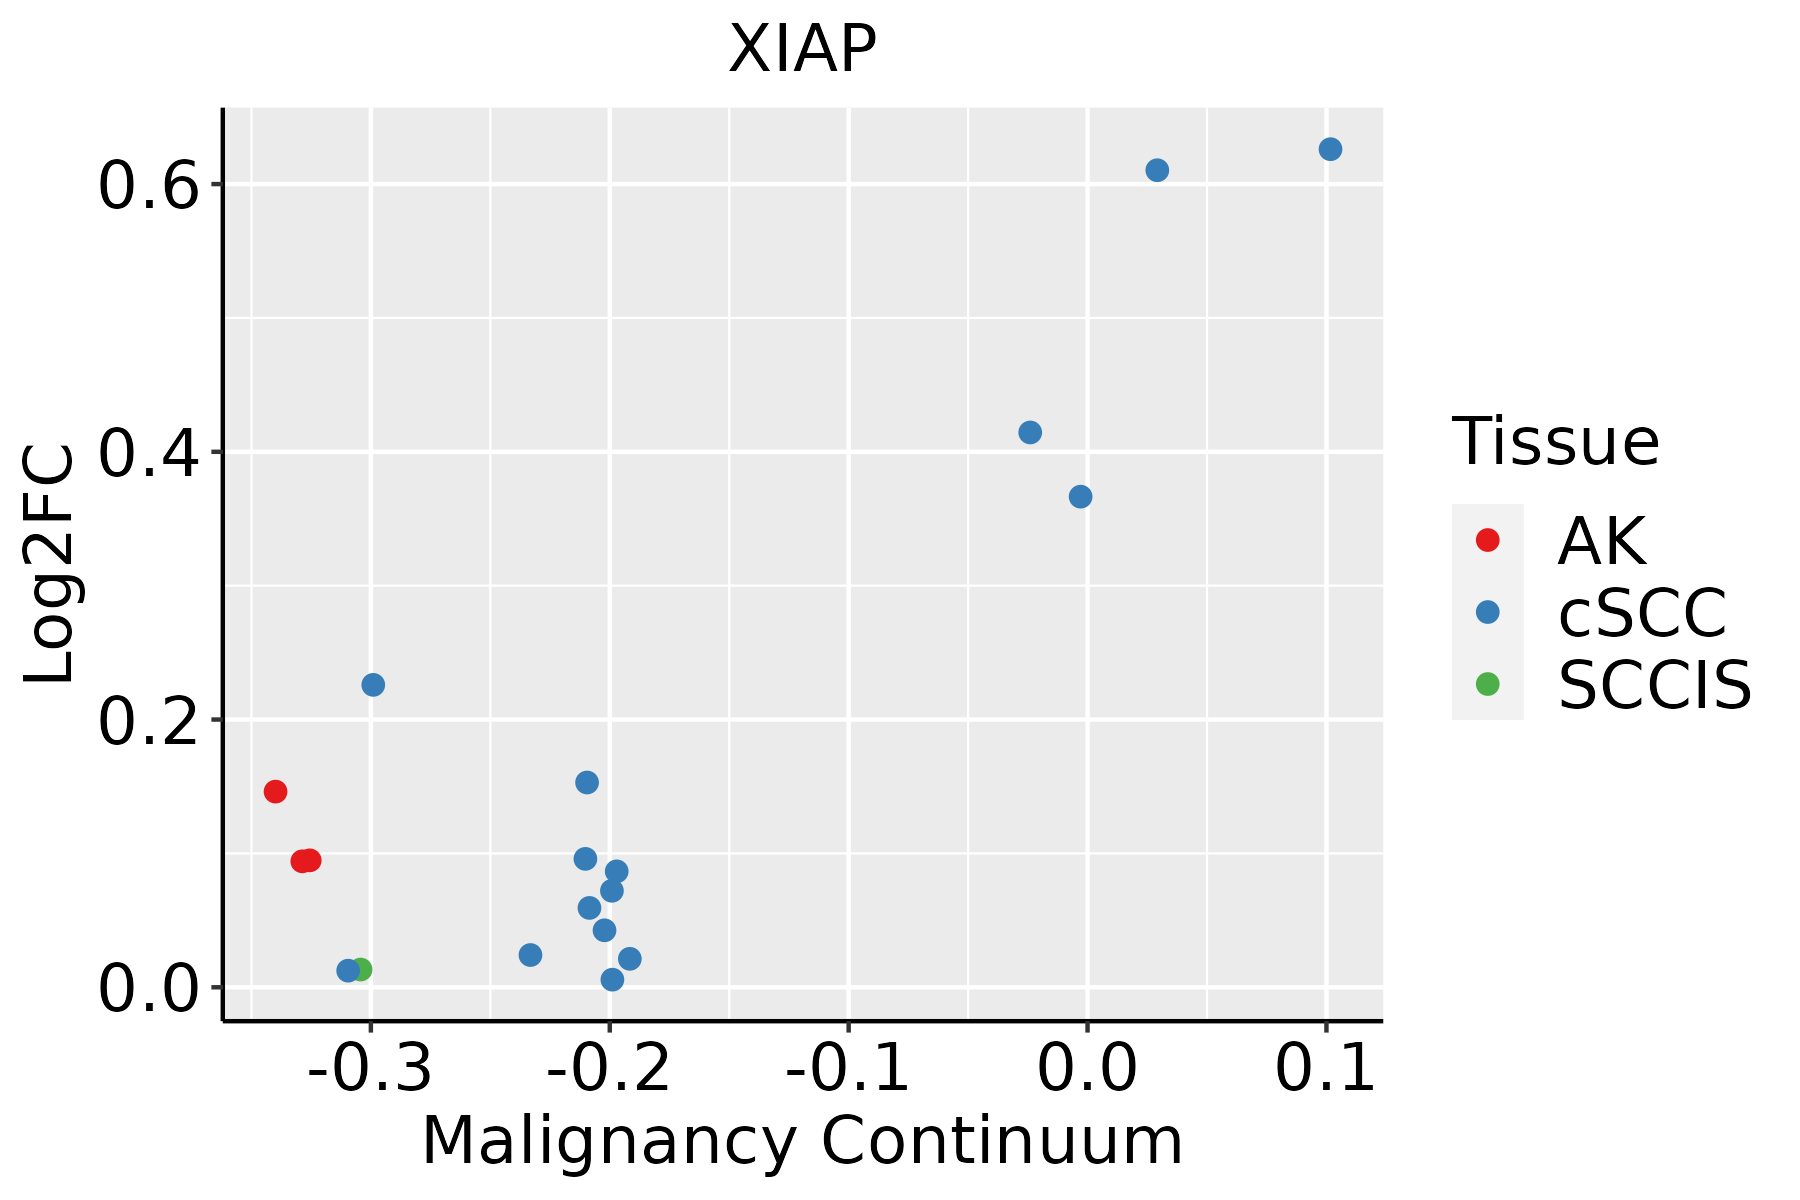 | AK: Actinic keratosis |
| cSCC: Cutaneous squamous cell carcinoma | ||
| SCCIS:squamous cell carcinoma in situ | ||
| Thyroid |  | ATC: Anaplastic thyroid cancer |
| HT: Hashimoto's thyroiditis | ||
| PTC: Papillary thyroid cancer |
| ∗log2FC in expression of this searched gene in stem-like cells from each diseased tissue sample relative to stem-like cells in normal samples in each tissue plotted against the malignancy continuum. Samples are colored based on if they are from different disease stage. |
Top |
Malignant transformation related pathway analysis |
| Find out the enriched GO biological processes and KEGG pathways involved in transition from healthy to precancer to cancer |
| Tissue | Disease Stage | Enriched GO biological Processes |
| Colorectum | AD |  |
| Colorectum | SER |  |
| Colorectum | MSS |  |
| Colorectum | MSI-H |  |
| Colorectum | FAP |  |
| ∗Top 15 enriched GO BP terms are showed in the bar plot of each disease state in each tissue. Each row represents a significant GO biological process which is colored according to the -log10(p.adjust). |
| Page: 1 2 3 4 5 6 7 8 9 |
| GO ID | Tissue | Disease Stage | Description | Gene Ratio | Bg Ratio | pvalue | p.adjust | Count |
| GO:1903320 | Colorectum | AD | regulation of protein modification by small protein conjugation or removal | 86/3918 | 242/18723 | 9.43e-08 | 4.65e-06 | 86 |
| GO:0070997 | Colorectum | AD | neuron death | 114/3918 | 361/18723 | 1.13e-06 | 3.72e-05 | 114 |
| GO:0055076 | Colorectum | AD | transition metal ion homeostasis | 53/3918 | 138/18723 | 1.89e-06 | 5.65e-05 | 53 |
| GO:0030522 | Colorectum | AD | intracellular receptor signaling pathway | 87/3918 | 265/18723 | 3.69e-06 | 1.03e-04 | 87 |
| GO:0043281 | Colorectum | AD | regulation of cysteine-type endopeptidase activity involved in apoptotic process | 72/3918 | 209/18723 | 3.70e-06 | 1.03e-04 | 72 |
| GO:2000116 | Colorectum | AD | regulation of cysteine-type endopeptidase activity | 79/3918 | 235/18723 | 3.74e-06 | 1.03e-04 | 79 |
| GO:0052547 | Colorectum | AD | regulation of peptidase activity | 137/3918 | 461/18723 | 4.12e-06 | 1.12e-04 | 137 |
| GO:0031396 | Colorectum | AD | regulation of protein ubiquitination | 72/3918 | 210/18723 | 4.50e-06 | 1.21e-04 | 72 |
| GO:0030111 | Colorectum | AD | regulation of Wnt signaling pathway | 102/3918 | 328/18723 | 8.51e-06 | 2.03e-04 | 102 |
| GO:0000209 | Colorectum | AD | protein polyubiquitination | 78/3918 | 236/18723 | 8.71e-06 | 2.06e-04 | 78 |
| GO:0016055 | Colorectum | AD | Wnt signaling pathway | 130/3918 | 444/18723 | 1.60e-05 | 3.37e-04 | 130 |
| GO:0198738 | Colorectum | AD | cell-cell signaling by wnt | 130/3918 | 446/18723 | 2.02e-05 | 4.10e-04 | 130 |
| GO:0045861 | Colorectum | AD | negative regulation of proteolysis | 106/3918 | 351/18723 | 2.33e-05 | 4.57e-04 | 106 |
| GO:0052548 | Colorectum | AD | regulation of endopeptidase activity | 124/3918 | 432/18723 | 6.58e-05 | 1.07e-03 | 124 |
| GO:0051402 | Colorectum | AD | neuron apoptotic process | 77/3918 | 246/18723 | 8.07e-05 | 1.28e-03 | 77 |
| GO:0060070 | Colorectum | AD | canonical Wnt signaling pathway | 90/3918 | 303/18723 | 1.76e-04 | 2.38e-03 | 90 |
| GO:0060828 | Colorectum | AD | regulation of canonical Wnt signaling pathway | 77/3918 | 253/18723 | 2.19e-04 | 2.87e-03 | 77 |
| GO:0043154 | Colorectum | AD | negative regulation of cysteine-type endopeptidase activity involved in apoptotic process | 30/3918 | 78/18723 | 2.95e-04 | 3.59e-03 | 30 |
| GO:0051604 | Colorectum | AD | protein maturation | 85/3918 | 294/18723 | 6.73e-04 | 6.91e-03 | 85 |
| GO:2000117 | Colorectum | AD | negative regulation of cysteine-type endopeptidase activity | 31/3918 | 86/18723 | 8.67e-04 | 8.45e-03 | 31 |
| Page: 1 2 3 4 5 6 7 8 9 10 11 12 13 14 15 16 17 18 19 20 21 22 23 |
| Pathway ID | Tissue | Disease Stage | Description | Gene Ratio | Bg Ratio | pvalue | p.adjust | qvalue | Count |
| hsa04120 | Colorectum | AD | Ubiquitin mediated proteolysis | 58/2092 | 142/8465 | 1.46e-05 | 1.53e-04 | 9.76e-05 | 58 |
| hsa04510 | Colorectum | AD | Focal adhesion | 67/2092 | 203/8465 | 4.40e-03 | 2.17e-02 | 1.38e-02 | 67 |
| hsa05166 | Colorectum | AD | Human T-cell leukemia virus 1 infection | 72/2092 | 222/8465 | 5.24e-03 | 2.44e-02 | 1.55e-02 | 72 |
| hsa041201 | Colorectum | AD | Ubiquitin mediated proteolysis | 58/2092 | 142/8465 | 1.46e-05 | 1.53e-04 | 9.76e-05 | 58 |
| hsa045101 | Colorectum | AD | Focal adhesion | 67/2092 | 203/8465 | 4.40e-03 | 2.17e-02 | 1.38e-02 | 67 |
| hsa051661 | Colorectum | AD | Human T-cell leukemia virus 1 infection | 72/2092 | 222/8465 | 5.24e-03 | 2.44e-02 | 1.55e-02 | 72 |
| hsa04217 | Colorectum | SER | Necroptosis | 47/1580 | 159/8465 | 5.21e-04 | 4.44e-03 | 3.22e-03 | 47 |
| hsa041202 | Colorectum | SER | Ubiquitin mediated proteolysis | 39/1580 | 142/8465 | 6.18e-03 | 3.66e-02 | 2.66e-02 | 39 |
| hsa042171 | Colorectum | SER | Necroptosis | 47/1580 | 159/8465 | 5.21e-04 | 4.44e-03 | 3.22e-03 | 47 |
| hsa041203 | Colorectum | SER | Ubiquitin mediated proteolysis | 39/1580 | 142/8465 | 6.18e-03 | 3.66e-02 | 2.66e-02 | 39 |
| hsa041204 | Colorectum | MSS | Ubiquitin mediated proteolysis | 55/1875 | 142/8465 | 5.02e-06 | 6.00e-05 | 3.68e-05 | 55 |
| hsa051662 | Colorectum | MSS | Human T-cell leukemia virus 1 infection | 68/1875 | 222/8465 | 1.84e-03 | 9.61e-03 | 5.89e-03 | 68 |
| hsa04210 | Colorectum | MSS | Apoptosis | 44/1875 | 136/8465 | 3.66e-03 | 1.66e-02 | 1.01e-02 | 44 |
| hsa01524 | Colorectum | MSS | Platinum drug resistance | 25/1875 | 73/8465 | 1.17e-02 | 3.99e-02 | 2.44e-02 | 25 |
| hsa05222 | Colorectum | MSS | Small cell lung cancer | 30/1875 | 92/8465 | 1.31e-02 | 4.30e-02 | 2.64e-02 | 30 |
| hsa041205 | Colorectum | MSS | Ubiquitin mediated proteolysis | 55/1875 | 142/8465 | 5.02e-06 | 6.00e-05 | 3.68e-05 | 55 |
| hsa051663 | Colorectum | MSS | Human T-cell leukemia virus 1 infection | 68/1875 | 222/8465 | 1.84e-03 | 9.61e-03 | 5.89e-03 | 68 |
| hsa042101 | Colorectum | MSS | Apoptosis | 44/1875 | 136/8465 | 3.66e-03 | 1.66e-02 | 1.01e-02 | 44 |
| hsa015241 | Colorectum | MSS | Platinum drug resistance | 25/1875 | 73/8465 | 1.17e-02 | 3.99e-02 | 2.44e-02 | 25 |
| hsa052221 | Colorectum | MSS | Small cell lung cancer | 30/1875 | 92/8465 | 1.31e-02 | 4.30e-02 | 2.64e-02 | 30 |
| Page: 1 2 3 4 5 6 7 |
Top |
Cell-cell communication analysis |
| Identification of potential cell-cell interactions between two cell types and their ligand-receptor pairs for different disease states |
| Ligand | Receptor | LRpair | Pathway | Tissue | Disease Stage |
| Page: 1 |
Top |
Single-cell gene regulatory network inference analysis |
| Find out the significant the regulons (TFs) and the target genes of each regulon across cell types for different disease states |
| TF | Cell Type | Tissue | Disease Stage | Target Gene | RSS | Regulon Activity |
| ∗The dot plots of a searched regulon are shown for all cell subpopulations in each disease state of each tissue based on the regulon specific score inferred using pySCENIC and by calculating the average expression. |
| Page: 1 |
Top |
Somatic mutation of malignant transformation related genes |
| Annotation of somatic variants for genes involved in malignant transformation |
| Hugo Symbol | Variant Class | Variant Classification | dbSNP RS | HGVSc | HGVSp | HGVSp Short | SWISSPROT | BIOTYPE | SIFT | PolyPhen | Tumor Sample Barcode | Tissue | Histology | Sex | Age | Stage | Therapy Types | Drugs | Outcome |
| XIAP | SNV | Missense_Mutation | c.389N>T | p.Asp130Val | p.D130V | P98170 | protein_coding | tolerated(0.08) | benign(0.013) | TCGA-A8-A07J-01 | Breast | breast invasive carcinoma | Female | <65 | I/II | Chemotherapy | 5-fluorouracil | CR | |
| XIAP | insertion | In_Frame_Ins | novel | c.387_388insATAGCAAAAGTAACTGCAGGGCACATGTAT | p.Leu129_Asp130insIleAlaLysValThrAlaGlyHisMetTyr | p.L129_D130insIAKVTAGHMY | P98170 | protein_coding | TCGA-A8-A07J-01 | Breast | breast invasive carcinoma | Female | <65 | I/II | Chemotherapy | 5-fluorouracil | CR | ||
| XIAP | SNV | Missense_Mutation | novel | c.1094N>T | p.Arg365Ile | p.R365I | P98170 | protein_coding | tolerated(0.21) | benign(0) | TCGA-2W-A8YY-01 | Cervix | cervical & endocervical cancer | Female | <65 | I/II | Chemotherapy | cisplatin | CR |
| XIAP | SNV | Missense_Mutation | novel | c.1181N>T | p.Glu394Val | p.E394V | P98170 | protein_coding | deleterious(0.02) | benign(0.001) | TCGA-C5-A2M2-01 | Cervix | cervical & endocervical cancer | Female | <65 | I/II | Unknown | Unknown | SD |
| XIAP | SNV | Missense_Mutation | novel | c.1402C>G | p.Leu468Val | p.L468V | P98170 | protein_coding | deleterious(0.04) | probably_damaging(0.997) | TCGA-DG-A2KM-01 | Cervix | cervical & endocervical cancer | Female | <65 | I/II | Chemotherapy | cisplatin | SD |
| XIAP | SNV | Missense_Mutation | novel | c.1069G>A | p.Glu357Lys | p.E357K | P98170 | protein_coding | tolerated(0.15) | benign(0) | TCGA-XS-A8TJ-01 | Cervix | cervical & endocervical cancer | Female | <65 | I/II | Chemotherapy | cisplatin | SD |
| XIAP | SNV | Missense_Mutation | c.470N>G | p.Asn157Ser | p.N157S | P98170 | protein_coding | deleterious(0.01) | benign(0.007) | TCGA-AA-3672-01 | Colorectum | colon adenocarcinoma | Female | >=65 | III/IV | Unknown | Unknown | SD | |
| XIAP | SNV | Missense_Mutation | rs760574724 | c.1191N>G | p.Ile397Met | p.I397M | P98170 | protein_coding | deleterious(0.02) | benign(0.1) | TCGA-AA-A010-01 | Colorectum | colon adenocarcinoma | Female | <65 | I/II | Chemotherapy | folinic | CR |
| XIAP | SNV | Missense_Mutation | c.347A>G | p.Lys116Arg | p.K116R | P98170 | protein_coding | tolerated(1) | benign(0) | TCGA-AY-6197-01 | Colorectum | colon adenocarcinoma | Male | <65 | I/II | Unknown | Unknown | SD | |
| XIAP | SNV | Missense_Mutation | novel | c.1479A>C | p.Lys493Asn | p.K493N | P98170 | protein_coding | deleterious(0.01) | possibly_damaging(0.908) | TCGA-AZ-4315-01 | Colorectum | colon adenocarcinoma | Male | <65 | I/II | Unknown | Unknown | SD |
| Page: 1 2 3 4 5 6 7 |
Top |
Related drugs of malignant transformation related genes |
| Identification of chemicals and drugs interact with genes involved in malignant transfromation |
| (DGIdb 4.0) |
| Entrez ID | Symbol | Category | Interaction Types | Drug Claim Name | Drug Name | PMIDs |
| 331 | XIAP | ENZYME, KINASE, DRUGGABLE GENOME, CLINICALLY ACTIONABLE, PROTEASE INHIBITOR, TUMOR SUPPRESSOR | PMID25980951-Compound-7 | |||
| 331 | XIAP | ENZYME, KINASE, DRUGGABLE GENOME, CLINICALLY ACTIONABLE, PROTEASE INHIBITOR, TUMOR SUPPRESSOR | PMID25980951-Compound-1 | |||
| 331 | XIAP | ENZYME, KINASE, DRUGGABLE GENOME, CLINICALLY ACTIONABLE, PROTEASE INHIBITOR, TUMOR SUPPRESSOR | ALPHA-DIFLUOROMETHYLORNITHINE | 15075199 | ||
| 331 | XIAP | ENZYME, KINASE, DRUGGABLE GENOME, CLINICALLY ACTIONABLE, PROTEASE INHIBITOR, TUMOR SUPPRESSOR | antagonist | LCL161 | LCL-161 | |
| 331 | XIAP | ENZYME, KINASE, DRUGGABLE GENOME, CLINICALLY ACTIONABLE, PROTEASE INHIBITOR, TUMOR SUPPRESSOR | antagonist | 223366065 | CHEMBL504559 | |
| 331 | XIAP | ENZYME, KINASE, DRUGGABLE GENOME, CLINICALLY ACTIONABLE, PROTEASE INHIBITOR, TUMOR SUPPRESSOR | CLADRIBINE | CLADRIBINE | 12948851 | |
| 331 | XIAP | ENZYME, KINASE, DRUGGABLE GENOME, CLINICALLY ACTIONABLE, PROTEASE INHIBITOR, TUMOR SUPPRESSOR | PMID25980951-Compound-21 | |||
| 331 | XIAP | ENZYME, KINASE, DRUGGABLE GENOME, CLINICALLY ACTIONABLE, PROTEASE INHIBITOR, TUMOR SUPPRESSOR | PHENOXODIOL | |||
| 331 | XIAP | ENZYME, KINASE, DRUGGABLE GENOME, CLINICALLY ACTIONABLE, PROTEASE INHIBITOR, TUMOR SUPPRESSOR | antagonist | 223366062 | AT-406 | |
| 331 | XIAP | ENZYME, KINASE, DRUGGABLE GENOME, CLINICALLY ACTIONABLE, PROTEASE INHIBITOR, TUMOR SUPPRESSOR | PMID25980951-Compound-44 |
| Page: 1 2 3 4 5 6 7 8 9 |

Copyright 2023-Present -The University of Texas Health Science Center at Houston |