
|
|||||
|
 | |
| |
| |
| |
| |
| |
|
Gene: XG |
Gene summary for XG |
| Gene information | Species | Human | Gene symbol | XG | Gene ID | 7499 |
| Gene name | Xg glycoprotein (Xg blood group) | |
| Gene Alias | PBDX | |
| Cytomap | Xp22.33 | |
| Gene Type | protein-coding | GO ID | GO:0002376 | UniProtAcc | B4E289 |
Top |
Malignant transformation analysis |
| Identification of the aberrant gene expression in precancerous and cancerous lesions by comparing the gene expression of stem-like cells in diseased tissues with normal stem cells |
| Entrez ID | Symbol | Replicates | Species | Organ | Tissue | Adj P-value | Log2FC | Malignancy |
| 7499 | XG | P2T-E | Human | Esophagus | ESCC | 1.29e-21 | 5.19e-01 | 0.1177 |
| 7499 | XG | P4T-E | Human | Esophagus | ESCC | 1.02e-26 | 6.37e-01 | 0.1323 |
| 7499 | XG | P5T-E | Human | Esophagus | ESCC | 2.62e-03 | 5.41e-02 | 0.1327 |
| 7499 | XG | P11T-E | Human | Esophagus | ESCC | 3.02e-12 | 5.82e-01 | 0.1426 |
| 7499 | XG | P16T-E | Human | Esophagus | ESCC | 2.30e-14 | 3.36e-01 | 0.1153 |
| 7499 | XG | P17T-E | Human | Esophagus | ESCC | 2.20e-04 | 2.89e-01 | 0.1278 |
| 7499 | XG | P21T-E | Human | Esophagus | ESCC | 6.63e-12 | 2.69e-01 | 0.1617 |
| 7499 | XG | P22T-E | Human | Esophagus | ESCC | 3.90e-11 | 1.96e-01 | 0.1236 |
| 7499 | XG | P26T-E | Human | Esophagus | ESCC | 2.94e-11 | 2.53e-01 | 0.1276 |
| 7499 | XG | P27T-E | Human | Esophagus | ESCC | 1.79e-49 | 9.65e-01 | 0.1055 |
| 7499 | XG | P30T-E | Human | Esophagus | ESCC | 2.63e-02 | 1.63e-01 | 0.137 |
| 7499 | XG | P31T-E | Human | Esophagus | ESCC | 1.21e-02 | 1.27e-01 | 0.1251 |
| 7499 | XG | P32T-E | Human | Esophagus | ESCC | 6.69e-12 | 2.74e-01 | 0.1666 |
| 7499 | XG | P36T-E | Human | Esophagus | ESCC | 2.02e-02 | 1.92e-01 | 0.1187 |
| 7499 | XG | P37T-E | Human | Esophagus | ESCC | 1.70e-07 | 2.02e-01 | 0.1371 |
| 7499 | XG | P40T-E | Human | Esophagus | ESCC | 1.02e-03 | 2.26e-01 | 0.109 |
| 7499 | XG | P42T-E | Human | Esophagus | ESCC | 1.05e-19 | 4.17e-01 | 0.1175 |
| 7499 | XG | P44T-E | Human | Esophagus | ESCC | 2.04e-05 | 2.06e-01 | 0.1096 |
| 7499 | XG | P47T-E | Human | Esophagus | ESCC | 1.21e-30 | 5.67e-01 | 0.1067 |
| 7499 | XG | P49T-E | Human | Esophagus | ESCC | 2.05e-06 | 5.97e-01 | 0.1768 |
| Page: 1 2 |
| Tissue | Expression Dynamics | Abbreviation |
| Esophagus | 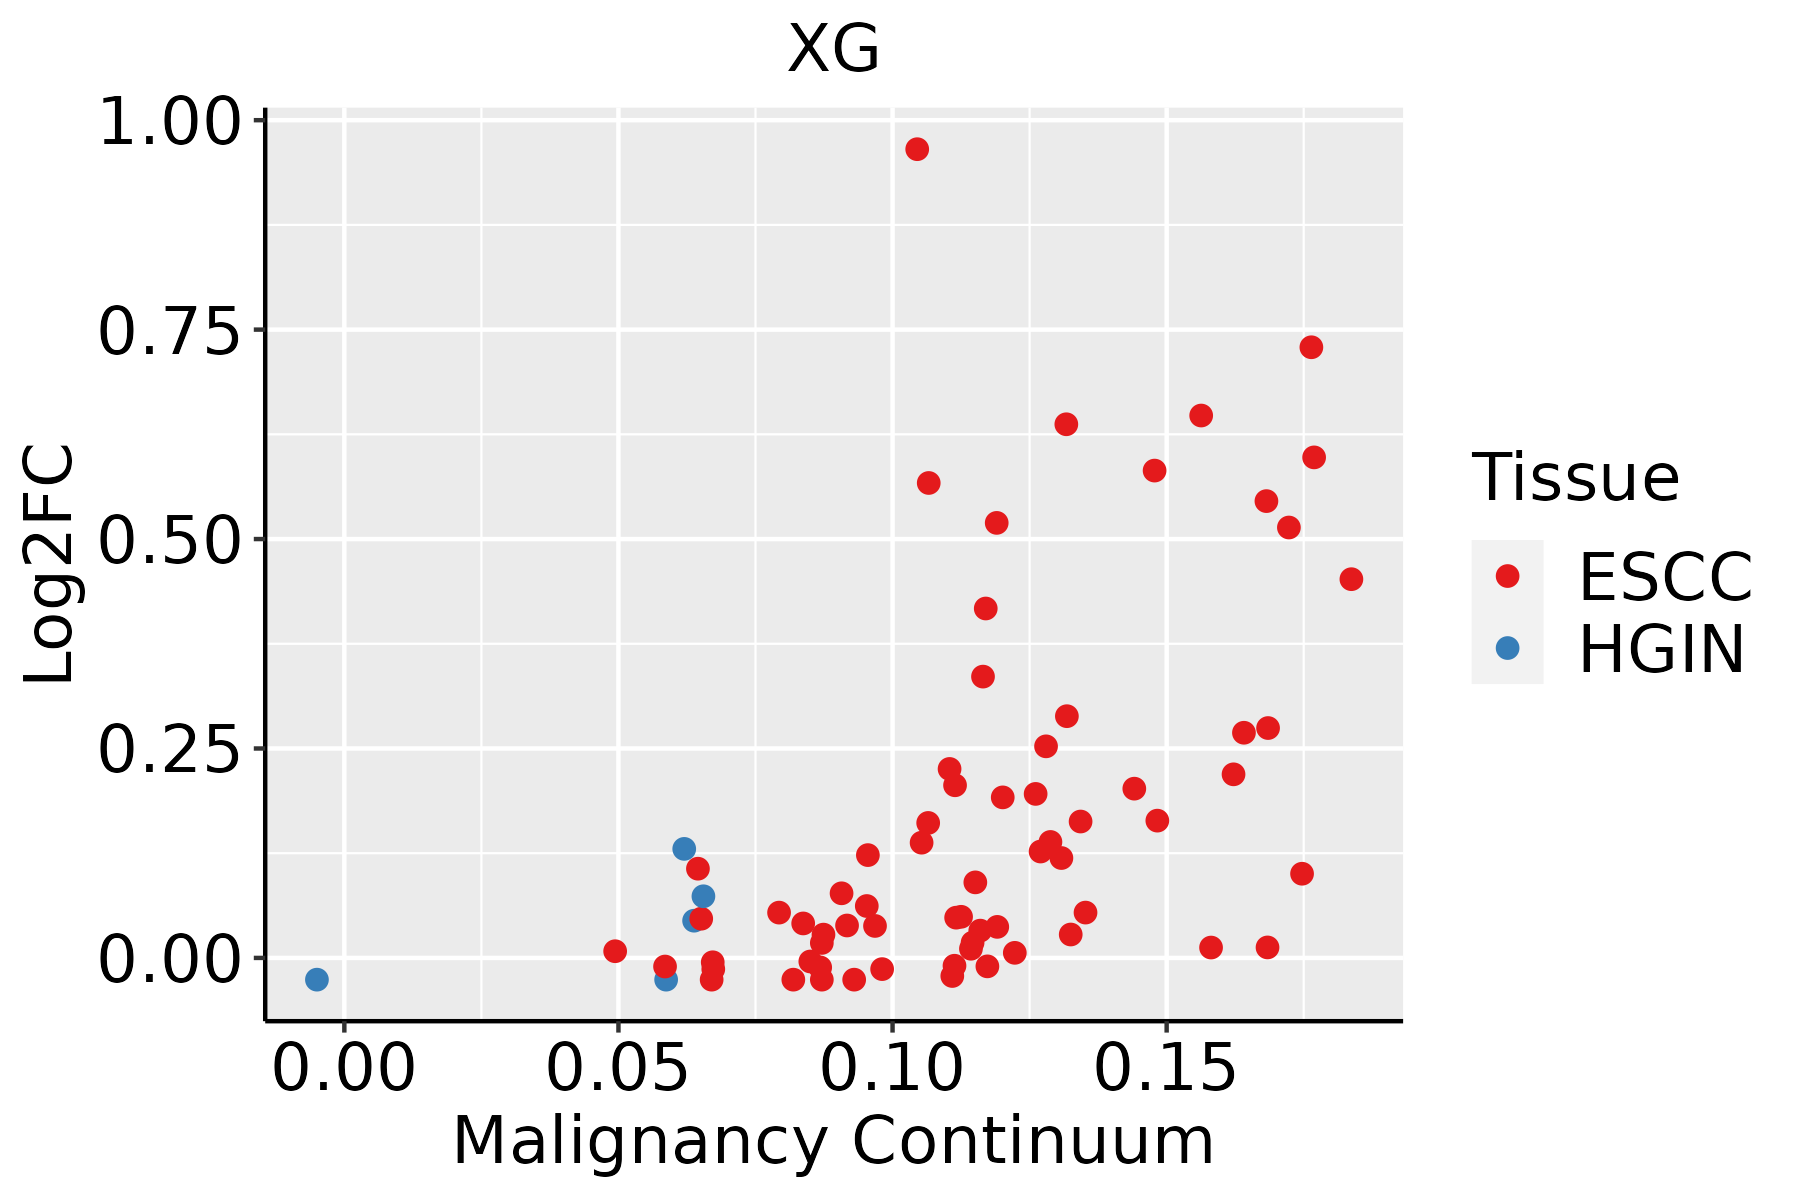 | ESCC: Esophageal squamous cell carcinoma |
| HGIN: High-grade intraepithelial neoplasias | ||
| LGIN: Low-grade intraepithelial neoplasias | ||
| Oral Cavity |  | EOLP: Erosive Oral lichen planus |
| LP: leukoplakia | ||
| NEOLP: Non-erosive oral lichen planus | ||
| OSCC: Oral squamous cell carcinoma |
| ∗log2FC in expression of this searched gene in stem-like cells from each diseased tissue sample relative to stem-like cells in normal samples in each tissue plotted against the malignancy continuum. Samples are colored based on if they are from different disease stage. |
Top |
Malignant transformation related pathway analysis |
| Find out the enriched GO biological processes and KEGG pathways involved in transition from healthy to precancer to cancer |
| Tissue | Disease Stage | Enriched GO biological Processes |
| Colorectum | AD |  |
| Colorectum | SER |  |
| Colorectum | MSS |  |
| Colorectum | MSI-H |  |
| Colorectum | FAP |  |
| ∗Top 15 enriched GO BP terms are showed in the bar plot of each disease state in each tissue. Each row represents a significant GO biological process which is colored according to the -log10(p.adjust). |
| Page: 1 2 3 4 5 6 7 8 9 |
| GO ID | Tissue | Disease Stage | Description | Gene Ratio | Bg Ratio | pvalue | p.adjust | Count |
| GO:003410920 | Esophagus | ESCC | homotypic cell-cell adhesion | 54/8552 | 90/18723 | 4.33e-03 | 1.72e-02 | 54 |
| GO:000268515 | Esophagus | ESCC | regulation of leukocyte migration | 114/8552 | 210/18723 | 7.26e-03 | 2.63e-02 | 114 |
| GO:000268714 | Oral cavity | OSCC | positive regulation of leukocyte migration | 78/7305 | 135/18723 | 7.43e-06 | 8.08e-05 | 78 |
| GO:003410919 | Oral cavity | OSCC | homotypic cell-cell adhesion | 55/7305 | 90/18723 | 1.78e-05 | 1.73e-04 | 55 |
| GO:000268510 | Oral cavity | OSCC | regulation of leukocyte migration | 108/7305 | 210/18723 | 1.63e-04 | 1.13e-03 | 108 |
| GO:005090010 | Oral cavity | OSCC | leukocyte migration | 176/7305 | 369/18723 | 3.80e-04 | 2.31e-03 | 176 |
| GO:00726783 | Oral cavity | OSCC | T cell migration | 37/7305 | 66/18723 | 3.66e-03 | 1.51e-02 | 37 |
| GO:0072683 | Oral cavity | OSCC | T cell extravasation | 9/7305 | 12/18723 | 1.27e-02 | 4.24e-02 | 9 |
| Page: 1 |
| Pathway ID | Tissue | Disease Stage | Description | Gene Ratio | Bg Ratio | pvalue | p.adjust | qvalue | Count |
| Page: 1 |
Top |
Cell-cell communication analysis |
| Identification of potential cell-cell interactions between two cell types and their ligand-receptor pairs for different disease states |
| Ligand | Receptor | LRpair | Pathway | Tissue | Disease Stage |
| Page: 1 |
Top |
Single-cell gene regulatory network inference analysis |
| Find out the significant the regulons (TFs) and the target genes of each regulon across cell types for different disease states |
| TF | Cell Type | Tissue | Disease Stage | Target Gene | RSS | Regulon Activity |
| XG | END | Thyroid | ATC | FBLN1,CCDC80,DCN, etc. | 0.00e+00 |  |
| XG | PVA | Thyroid | goiters | FBLN1,CCDC80,DCN, etc. | 7.83e-02 |  |
| XG | MSC.MVA | Thyroid | PTC | FBLN1,CCDC80,DCN, etc. | 3.37e-01 |  |
| ∗The dot plots of a searched regulon are shown for all cell subpopulations in each disease state of each tissue based on the regulon specific score inferred using pySCENIC and by calculating the average expression. |
| Page: 1 |
Top |
Somatic mutation of malignant transformation related genes |
| Annotation of somatic variants for genes involved in malignant transformation |
| Hugo Symbol | Variant Class | Variant Classification | dbSNP RS | HGVSc | HGVSp | HGVSp Short | SWISSPROT | BIOTYPE | SIFT | PolyPhen | Tumor Sample Barcode | Tissue | Histology | Sex | Age | Stage | Therapy Types | Drugs | Outcome |
| XG | SNV | Missense_Mutation | novel | c.562N>G | p.Arg188Gly | p.R188G | P55808 | protein_coding | deleterious(0.01) | benign(0.107) | TCGA-A8-A09Z-01 | Breast | breast invasive carcinoma | Female | >=65 | I/II | Unknown | Unknown | SD |
| XG | SNV | Missense_Mutation | novel | c.551N>A | p.Arg184Lys | p.R184K | P55808 | protein_coding | tolerated(0.57) | benign(0.225) | TCGA-D8-A4Z1-01 | Breast | breast invasive carcinoma | Female | >=65 | I/II | Hormone Therapy | tamoxiphen | SD |
| XG | SNV | Missense_Mutation | novel | c.25T>C | p.Cys9Arg | p.C9R | P55808 | protein_coding | tolerated(0.13) | benign(0.027) | TCGA-A6-6653-01 | Colorectum | colon adenocarcinoma | Male | >=65 | I/II | Unknown | Unknown | SD |
| XG | SNV | Missense_Mutation | novel | c.70N>T | p.Asp24Tyr | p.D24Y | P55808 | protein_coding | deleterious(0) | possibly_damaging(0.766) | TCGA-AA-3984-01 | Colorectum | colon adenocarcinoma | Female | <65 | I/II | Unknown | Unknown | SD |
| XG | SNV | Missense_Mutation | c.158N>T | p.Tyr53Phe | p.Y53F | P55808 | protein_coding | tolerated(0.67) | benign(0.023) | TCGA-AA-A01P-01 | Colorectum | colon adenocarcinoma | Female | >=65 | III/IV | Unknown | Unknown | PD | |
| XG | SNV | Missense_Mutation | c.475N>A | p.Val159Met | p.V159M | P55808 | protein_coding | deleterious(0.01) | probably_damaging(0.997) | TCGA-AA-A02Y-01 | Colorectum | colon adenocarcinoma | Male | >=65 | I/II | Unknown | Unknown | SD | |
| XG | SNV | Missense_Mutation | rs772307273 | c.493G>A | p.Val165Met | p.V165M | P55808 | protein_coding | tolerated(0.12) | possibly_damaging(0.836) | TCGA-AG-A02N-01 | Colorectum | rectum adenocarcinoma | Male | >=65 | I/II | Chemotherapy | folinic | CR |
| XG | SNV | Missense_Mutation | novel | c.139N>C | p.Lys47Gln | p.K47Q | P55808 | protein_coding | tolerated(0.08) | benign(0.026) | TCGA-A5-A2K5-01 | Endometrium | uterine corpus endometrioid carcinoma | Female | >=65 | I/II | Unknown | Unknown | SD |
| XG | SNV | Missense_Mutation | novel | c.455N>A | p.Gly152Asp | p.G152D | P55808 | protein_coding | deleterious(0.01) | probably_damaging(0.995) | TCGA-AJ-A3EK-01 | Endometrium | uterine corpus endometrioid carcinoma | Female | <65 | I/II | Chemotherapy | carboplatin | CR |
| XG | SNV | Missense_Mutation | novel | c.218N>A | p.Pro73His | p.P73H | P55808 | protein_coding | deleterious(0.02) | possibly_damaging(0.726) | TCGA-AX-A1CE-01 | Endometrium | uterine corpus endometrioid carcinoma | Female | <65 | I/II | Unspecific | Paclitaxel | SD |
| Page: 1 2 3 |
Top |
Related drugs of malignant transformation related genes |
| Identification of chemicals and drugs interact with genes involved in malignant transfromation |
| (DGIdb 4.0) |
| Entrez ID | Symbol | Category | Interaction Types | Drug Claim Name | Drug Name | PMIDs |
| Page: 1 |

Copyright 2023-Present -The University of Texas Health Science Center at Houston |