
|
|||||
|
 | |
| |
| |
| |
| |
| |
|
Gene: XDH |
Gene summary for XDH |
| Gene information | Species | Human | Gene symbol | XDH | Gene ID | 7498 |
| Gene name | xanthine dehydrogenase | |
| Gene Alias | XAN1 | |
| Cytomap | 2p23.1 | |
| Gene Type | protein-coding | GO ID | GO:0000165 | UniProtAcc | P47989 |
Top |
Malignant transformation analysis |
| Identification of the aberrant gene expression in precancerous and cancerous lesions by comparing the gene expression of stem-like cells in diseased tissues with normal stem cells |
| Entrez ID | Symbol | Replicates | Species | Organ | Tissue | Adj P-value | Log2FC | Malignancy |
| 7498 | XDH | HTA11_2487_2000001011 | Human | Colorectum | SER | 4.27e-03 | 4.05e-01 | -0.1808 |
| 7498 | XDH | HTA11_347_2000001011 | Human | Colorectum | AD | 2.66e-11 | 5.49e-01 | -0.1954 |
| 7498 | XDH | HTA11_2112_2000001011 | Human | Colorectum | SER | 9.73e-05 | 1.02e+00 | -0.2196 |
| 7498 | XDH | A015-C-104 | Human | Colorectum | FAP | 4.03e-03 | -1.52e-01 | -0.1899 |
| 7498 | XDH | F034 | Human | Colorectum | FAP | 1.70e-04 | -1.81e-01 | -0.0665 |
| 7498 | XDH | Pat01-B | Human | Stomach | GC | 1.70e-27 | 5.56e-01 | 0.5754 |
| 7498 | XDH | Pat02-B | Human | Stomach | GC | 8.81e-05 | 1.35e-01 | 0.0368 |
| 7498 | XDH | Pat03-B | Human | Stomach | GC | 8.93e-14 | 3.04e-01 | 0.3693 |
| 7498 | XDH | Pat12-B | Human | Stomach | GC | 5.59e-06 | 1.83e-01 | 0.0325 |
| 7498 | XDH | Pat16-B | Human | Stomach | GC | 3.76e-03 | 1.41e-01 | 0.1918 |
| 7498 | XDH | Pat17-B | Human | Stomach | GC | 7.93e-03 | 1.67e-01 | 0.3109 |
| 7498 | XDH | Pat19-B | Human | Stomach | GC | 1.08e-03 | 1.66e-01 | 0.0826 |
| Page: 1 |
| Tissue | Expression Dynamics | Abbreviation |
| Colorectum (GSE201348) |  | FAP: Familial adenomatous polyposis |
| CRC: Colorectal cancer | ||
| Colorectum (HTA11) | 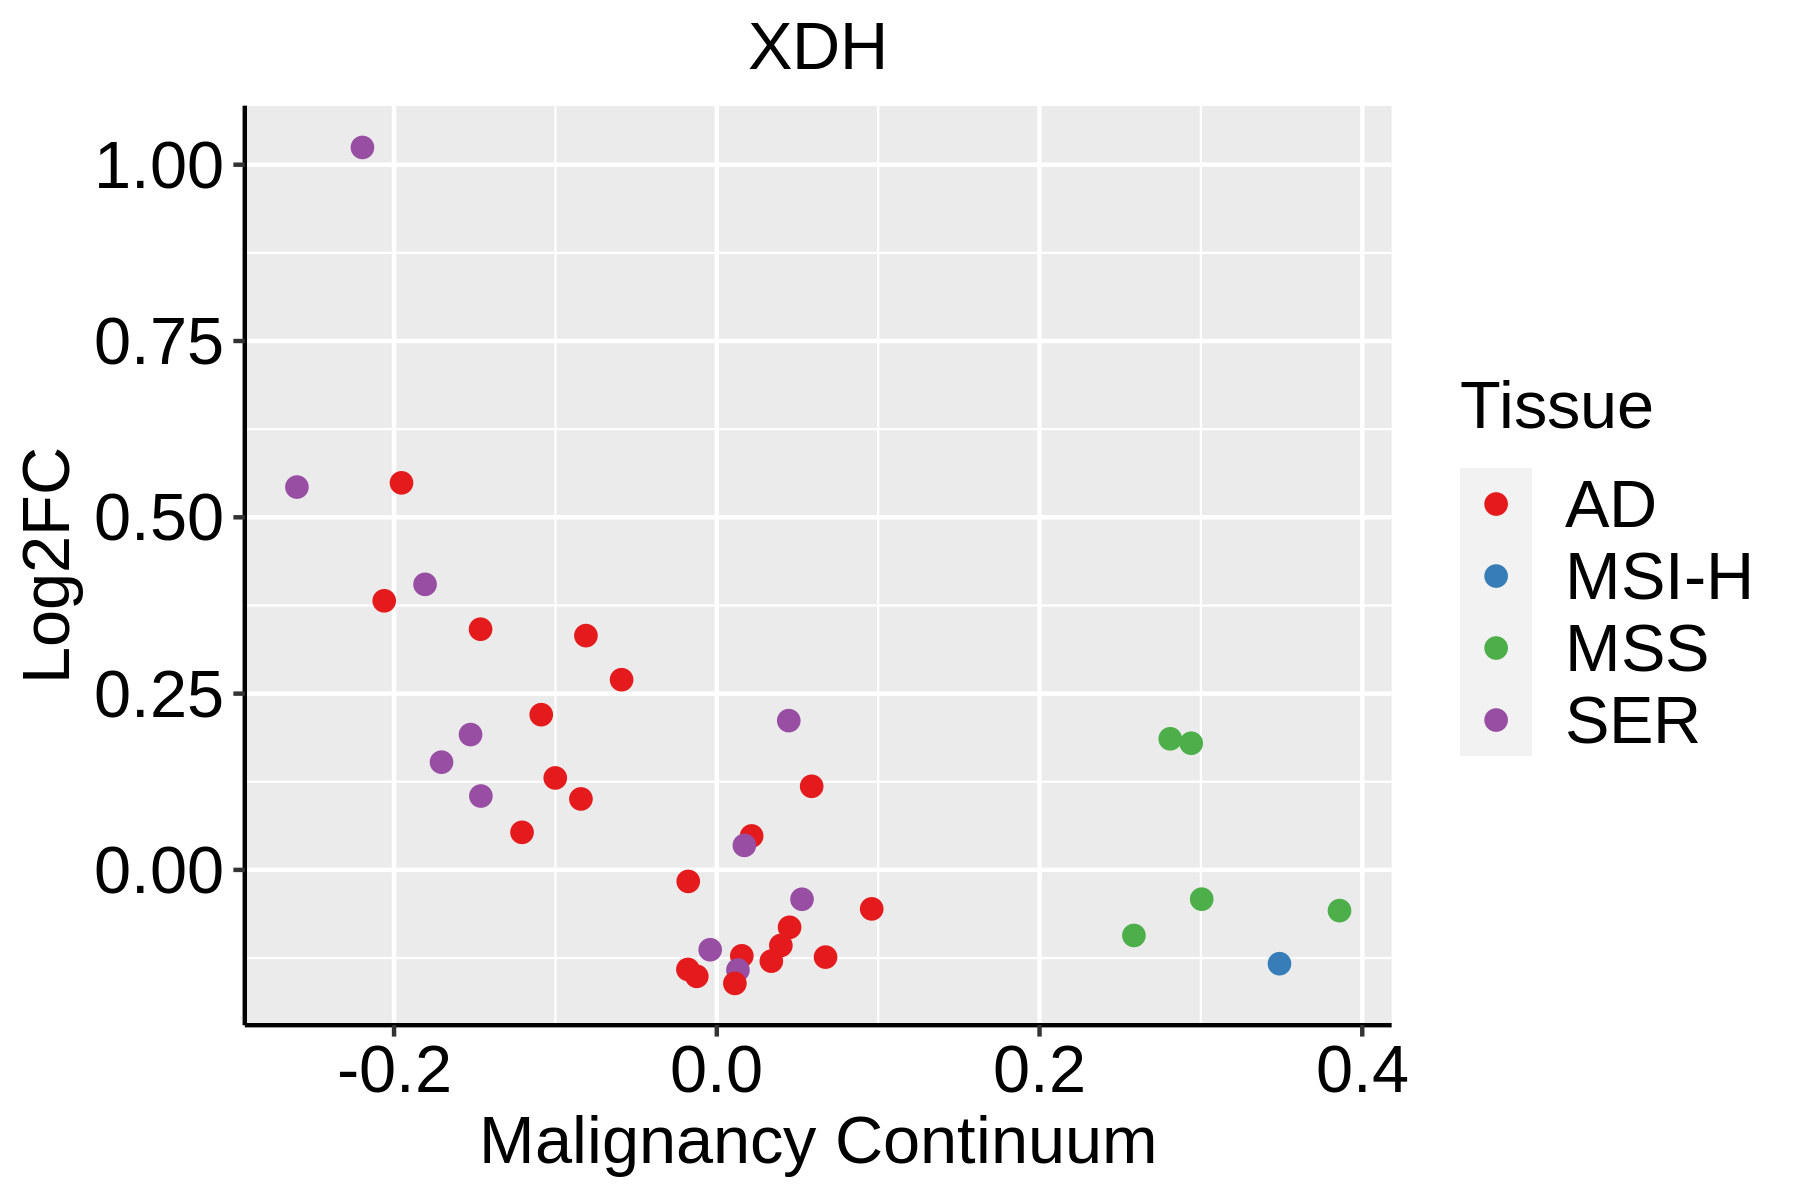 | AD: Adenomas |
| SER: Sessile serrated lesions | ||
| MSI-H: Microsatellite-high colorectal cancer | ||
| MSS: Microsatellite stable colorectal cancer | ||
| GC | 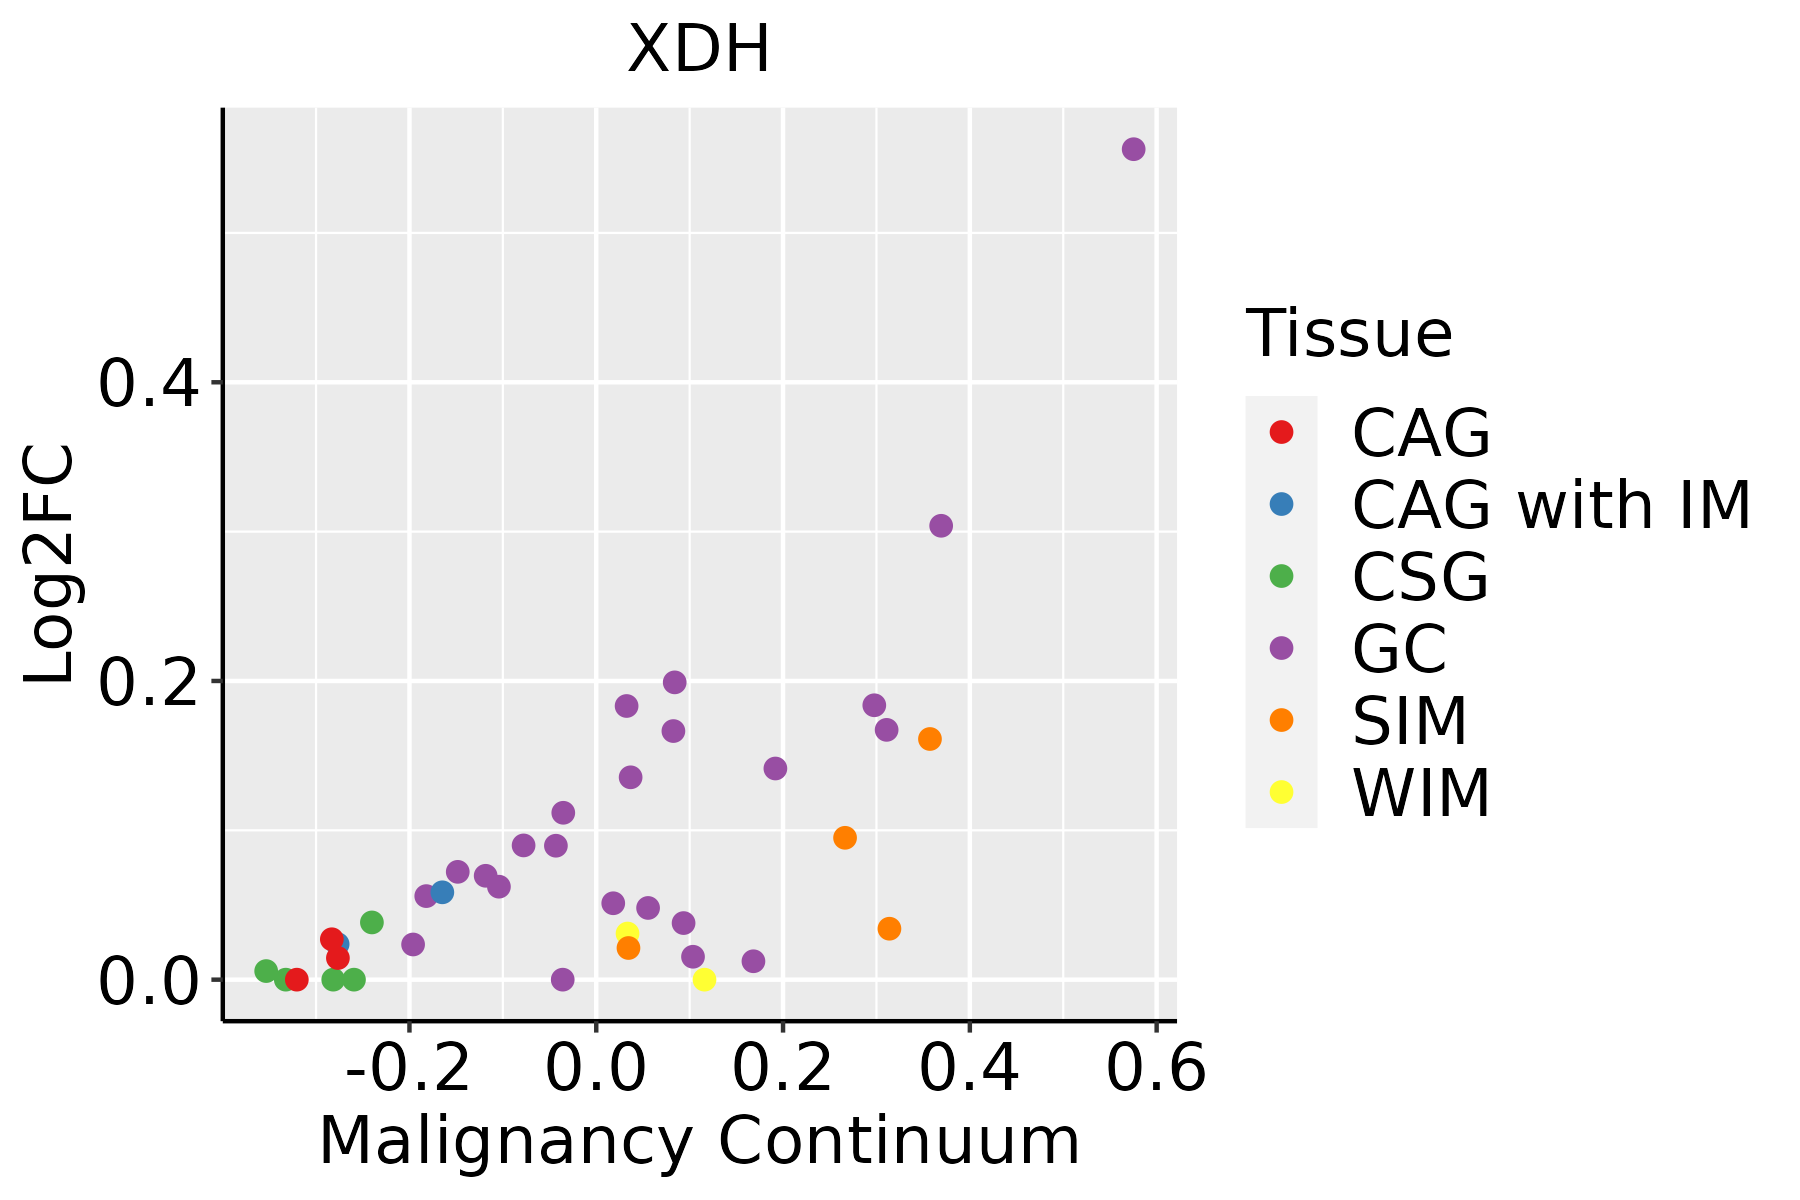 | CAG: Chronic atrophic gastritis |
| CAG with IM: Chronic atrophic gastritis with intestinal metaplasia | ||
| CSG: Chronic superficial gastritis | ||
| GC: Gastric cancer | ||
| SIM: Severe intestinal metaplasia | ||
| WIM: Wild intestinal metaplasia |
| ∗log2FC in expression of this searched gene in stem-like cells from each diseased tissue sample relative to stem-like cells in normal samples in each tissue plotted against the malignancy continuum. Samples are colored based on if they are from different disease stage. |
Top |
Malignant transformation related pathway analysis |
| Find out the enriched GO biological processes and KEGG pathways involved in transition from healthy to precancer to cancer |
| Tissue | Disease Stage | Enriched GO biological Processes |
| Colorectum | AD |  |
| Colorectum | SER |  |
| Colorectum | MSS |  |
| Colorectum | MSI-H |  |
| Colorectum | FAP |  |
| ∗Top 15 enriched GO BP terms are showed in the bar plot of each disease state in each tissue. Each row represents a significant GO biological process which is colored according to the -log10(p.adjust). |
| Page: 1 2 3 4 5 6 7 8 9 |
| GO ID | Tissue | Disease Stage | Description | Gene Ratio | Bg Ratio | pvalue | p.adjust | Count |
| GO:0009150 | Colorectum | AD | purine ribonucleotide metabolic process | 142/3918 | 368/18723 | 4.29e-15 | 1.17e-12 | 142 |
| GO:0006163 | Colorectum | AD | purine nucleotide metabolic process | 149/3918 | 396/18723 | 1.08e-14 | 2.80e-12 | 149 |
| GO:0072521 | Colorectum | AD | purine-containing compound metabolic process | 153/3918 | 416/18723 | 4.34e-14 | 1.01e-11 | 153 |
| GO:0009259 | Colorectum | AD | ribonucleotide metabolic process | 144/3918 | 385/18723 | 5.25e-14 | 1.13e-11 | 144 |
| GO:0019693 | Colorectum | AD | ribose phosphate metabolic process | 145/3918 | 396/18723 | 3.01e-13 | 5.71e-11 | 145 |
| GO:0009117 | Colorectum | AD | nucleotide metabolic process | 168/3918 | 489/18723 | 2.20e-12 | 3.36e-10 | 168 |
| GO:0006753 | Colorectum | AD | nucleoside phosphate metabolic process | 169/3918 | 497/18723 | 4.99e-12 | 6.98e-10 | 169 |
| GO:0048732 | Colorectum | AD | gland development | 149/3918 | 436/18723 | 6.07e-11 | 6.33e-09 | 149 |
| GO:0045862 | Colorectum | AD | positive regulation of proteolysis | 129/3918 | 372/18723 | 4.04e-10 | 3.46e-08 | 129 |
| GO:0044270 | Colorectum | AD | cellular nitrogen compound catabolic process | 147/3918 | 451/18723 | 3.35e-09 | 2.23e-07 | 147 |
| GO:0046700 | Colorectum | AD | heterocycle catabolic process | 145/3918 | 445/18723 | 4.37e-09 | 2.84e-07 | 145 |
| GO:0034655 | Colorectum | AD | nucleobase-containing compound catabolic process | 133/3918 | 407/18723 | 1.56e-08 | 9.12e-07 | 133 |
| GO:0019439 | Colorectum | AD | aromatic compound catabolic process | 146/3918 | 467/18723 | 7.48e-08 | 3.84e-06 | 146 |
| GO:1901361 | Colorectum | AD | organic cyclic compound catabolic process | 153/3918 | 495/18723 | 8.23e-08 | 4.18e-06 | 153 |
| GO:0044282 | Colorectum | AD | small molecule catabolic process | 118/3918 | 376/18723 | 1.05e-06 | 3.55e-05 | 118 |
| GO:0030879 | Colorectum | AD | mammary gland development | 53/3918 | 137/18723 | 1.46e-06 | 4.58e-05 | 53 |
| GO:0043281 | Colorectum | AD | regulation of cysteine-type endopeptidase activity involved in apoptotic process | 72/3918 | 209/18723 | 3.70e-06 | 1.03e-04 | 72 |
| GO:2000116 | Colorectum | AD | regulation of cysteine-type endopeptidase activity | 79/3918 | 235/18723 | 3.74e-06 | 1.03e-04 | 79 |
| GO:0052547 | Colorectum | AD | regulation of peptidase activity | 137/3918 | 461/18723 | 4.12e-06 | 1.12e-04 | 137 |
| GO:0010952 | Colorectum | AD | positive regulation of peptidase activity | 68/3918 | 197/18723 | 6.30e-06 | 1.59e-04 | 68 |
| Page: 1 2 3 4 5 6 7 8 9 |
| Pathway ID | Tissue | Disease Stage | Description | Gene Ratio | Bg Ratio | pvalue | p.adjust | qvalue | Count |
| Page: 1 |
Top |
Cell-cell communication analysis |
| Identification of potential cell-cell interactions between two cell types and their ligand-receptor pairs for different disease states |
| Ligand | Receptor | LRpair | Pathway | Tissue | Disease Stage |
| Page: 1 |
Top |
Single-cell gene regulatory network inference analysis |
| Find out the significant the regulons (TFs) and the target genes of each regulon across cell types for different disease states |
| TF | Cell Type | Tissue | Disease Stage | Target Gene | RSS | Regulon Activity |
| ∗The dot plots of a searched regulon are shown for all cell subpopulations in each disease state of each tissue based on the regulon specific score inferred using pySCENIC and by calculating the average expression. |
| Page: 1 |
Top |
Somatic mutation of malignant transformation related genes |
| Annotation of somatic variants for genes involved in malignant transformation |
| Hugo Symbol | Variant Class | Variant Classification | dbSNP RS | HGVSc | HGVSp | HGVSp Short | SWISSPROT | BIOTYPE | SIFT | PolyPhen | Tumor Sample Barcode | Tissue | Histology | Sex | Age | Stage | Therapy Types | Drugs | Outcome |
| XDH | SNV | Missense_Mutation | rs61731081 | c.1801N>A | p.Glu601Lys | p.E601K | P47989 | protein_coding | tolerated(0.15) | benign(0.081) | TCGA-A2-A0EV-01 | Breast | breast invasive carcinoma | Female | >=65 | I/II | Unknown | Unknown | SD |
| XDH | SNV | Missense_Mutation | novel | c.1826N>G | p.Val609Gly | p.V609G | P47989 | protein_coding | deleterious(0) | probably_damaging(0.95) | TCGA-A2-A1FW-01 | Breast | breast invasive carcinoma | Female | <65 | III/IV | Chemotherapy | cytoxan | SD |
| XDH | SNV | Missense_Mutation | rs745346331 | c.683N>A | p.Arg228Gln | p.R228Q | P47989 | protein_coding | tolerated(0.3) | benign(0.005) | TCGA-AN-A046-01 | Breast | breast invasive carcinoma | Female | >=65 | I/II | Unknown | Unknown | SD |
| XDH | SNV | Missense_Mutation | c.2924N>A | p.Ser975Asn | p.S975N | P47989 | protein_coding | tolerated(0.15) | benign(0.015) | TCGA-AN-A0FN-01 | Breast | breast invasive carcinoma | Female | <65 | I/II | Unknown | Unknown | SD | |
| XDH | SNV | Missense_Mutation | novel | c.366G>A | p.Met122Ile | p.M122I | P47989 | protein_coding | deleterious(0) | probably_damaging(0.998) | TCGA-AR-A2LE-01 | Breast | breast invasive carcinoma | Female | >=65 | I/II | Hormone Therapy | tamoxiphen | PD |
| XDH | SNV | Missense_Mutation | novel | c.1826N>G | p.Val609Gly | p.V609G | P47989 | protein_coding | deleterious(0) | probably_damaging(0.95) | TCGA-BH-A0BR-01 | Breast | breast invasive carcinoma | Female | <65 | I/II | Unknown | Unknown | SD |
| XDH | SNV | Missense_Mutation | rs781137664 | c.2488N>T | p.Arg830Cys | p.R830C | P47989 | protein_coding | deleterious(0.01) | probably_damaging(1) | TCGA-BH-A201-01 | Breast | breast invasive carcinoma | Female | <65 | I/II | Unknown | Unknown | SD |
| XDH | SNV | Missense_Mutation | c.414N>C | p.Glu138Asp | p.E138D | P47989 | protein_coding | tolerated(0.72) | benign(0.083) | TCGA-C8-A12K-01 | Breast | breast invasive carcinoma | Female | >=65 | I/II | Unknown | Unknown | SD | |
| XDH | SNV | Missense_Mutation | rs116290580 | c.3667C>T | p.Arg1223Cys | p.R1223C | P47989 | protein_coding | deleterious(0.01) | probably_damaging(0.944) | TCGA-C8-A273-01 | Breast | breast invasive carcinoma | Female | <65 | I/II | Hormone Therapy | tamoxiphen | SD |
| XDH | SNV | Missense_Mutation | c.3427N>G | p.Phe1143Val | p.F1143V | P47989 | protein_coding | deleterious(0.03) | benign(0.224) | TCGA-D8-A1XK-01 | Breast | breast invasive carcinoma | Female | <65 | I/II | Chemotherapy | doxorubicine+cyclophosphamide | SD |
| Page: 1 2 3 4 5 6 7 8 9 10 11 12 13 14 15 16 17 |
Top |
Related drugs of malignant transformation related genes |
| Identification of chemicals and drugs interact with genes involved in malignant transfromation |
| (DGIdb 4.0) |
| Entrez ID | Symbol | Category | Interaction Types | Drug Claim Name | Drug Name | PMIDs |
| 7498 | XDH | DRUGGABLE GENOME, ENZYME | PMID27841045-Compound-156 | |||
| 7498 | XDH | DRUGGABLE GENOME, ENZYME | Azaindole derivative 4 | |||
| 7498 | XDH | DRUGGABLE GENOME, ENZYME | FEBUXOSTAT | FEBUXOSTAT | ||
| 7498 | XDH | DRUGGABLE GENOME, ENZYME | PMID27841045-Compound-132 | |||
| 7498 | XDH | DRUGGABLE GENOME, ENZYME | allopurinol | ALLOPURINOL | 27798726,24915143 | |
| 7498 | XDH | DRUGGABLE GENOME, ENZYME | PMID27841045-Compound-134 | |||
| 7498 | XDH | DRUGGABLE GENOME, ENZYME | CLARITHROMYCIN | CLARITHROMYCIN | 14730107 | |
| 7498 | XDH | DRUGGABLE GENOME, ENZYME | PMID27841045-Compound-130 | |||
| 7498 | XDH | DRUGGABLE GENOME, ENZYME | IMMUNOMODULATORS | 8046245 | ||
| 7498 | XDH | DRUGGABLE GENOME, ENZYME | Fused heterocyclic compound 3 |
| Page: 1 2 3 4 5 6 7 8 9 |

Copyright 2023-Present -The University of Texas Health Science Center at Houston |