
|
|||||
|
 | |
| |
| |
| |
| |
| |
|
Gene: XAF1 |
Gene summary for XAF1 |
| Gene information | Species | Human | Gene symbol | XAF1 | Gene ID | 54739 |
| Gene name | XIAP associated factor 1 | |
| Gene Alias | BIRC4BP | |
| Cytomap | 17p13.1 | |
| Gene Type | protein-coding | GO ID | GO:0006915 | UniProtAcc | Q6GPH4 |
Top |
Malignant transformation analysis |
| Identification of the aberrant gene expression in precancerous and cancerous lesions by comparing the gene expression of stem-like cells in diseased tissues with normal stem cells |
| Entrez ID | Symbol | Replicates | Species | Organ | Tissue | Adj P-value | Log2FC | Malignancy |
| 54739 | XAF1 | LZE4T | Human | Esophagus | ESCC | 2.98e-04 | 2.24e-01 | 0.0811 |
| 54739 | XAF1 | LZE5T | Human | Esophagus | ESCC | 4.07e-06 | 5.39e-01 | 0.0514 |
| 54739 | XAF1 | LZE8T | Human | Esophagus | ESCC | 1.13e-05 | 2.60e-01 | 0.067 |
| 54739 | XAF1 | LZE20T | Human | Esophagus | ESCC | 8.96e-17 | 6.27e-01 | 0.0662 |
| 54739 | XAF1 | LZE22T | Human | Esophagus | ESCC | 3.08e-04 | 3.16e-01 | 0.068 |
| 54739 | XAF1 | LZE24T | Human | Esophagus | ESCC | 1.40e-55 | 1.65e+00 | 0.0596 |
| 54739 | XAF1 | LZE21T | Human | Esophagus | ESCC | 2.18e-06 | 5.93e-01 | 0.0655 |
| 54739 | XAF1 | LZE6T | Human | Esophagus | ESCC | 1.94e-04 | 2.94e-01 | 0.0845 |
| 54739 | XAF1 | P1T-E | Human | Esophagus | ESCC | 9.70e-16 | 1.12e+00 | 0.0875 |
| 54739 | XAF1 | P2T-E | Human | Esophagus | ESCC | 1.61e-75 | 1.51e+00 | 0.1177 |
| 54739 | XAF1 | P4T-E | Human | Esophagus | ESCC | 2.14e-11 | 3.11e-01 | 0.1323 |
| 54739 | XAF1 | P5T-E | Human | Esophagus | ESCC | 1.17e-14 | 3.54e-01 | 0.1327 |
| 54739 | XAF1 | P8T-E | Human | Esophagus | ESCC | 3.79e-42 | 9.57e-01 | 0.0889 |
| 54739 | XAF1 | P9T-E | Human | Esophagus | ESCC | 1.15e-56 | 1.47e+00 | 0.1131 |
| 54739 | XAF1 | P11T-E | Human | Esophagus | ESCC | 6.46e-43 | 1.62e+00 | 0.1426 |
| 54739 | XAF1 | P12T-E | Human | Esophagus | ESCC | 3.60e-02 | 1.50e-01 | 0.1122 |
| 54739 | XAF1 | P15T-E | Human | Esophagus | ESCC | 1.18e-15 | 4.44e-01 | 0.1149 |
| 54739 | XAF1 | P17T-E | Human | Esophagus | ESCC | 9.02e-24 | 1.03e+00 | 0.1278 |
| 54739 | XAF1 | P20T-E | Human | Esophagus | ESCC | 2.35e-35 | 8.93e-01 | 0.1124 |
| 54739 | XAF1 | P21T-E | Human | Esophagus | ESCC | 1.61e-33 | 6.28e-01 | 0.1617 |
| Page: 1 2 3 4 5 6 |
| Tissue | Expression Dynamics | Abbreviation |
| Esophagus |  | ESCC: Esophageal squamous cell carcinoma |
| HGIN: High-grade intraepithelial neoplasias | ||
| LGIN: Low-grade intraepithelial neoplasias | ||
| Liver | 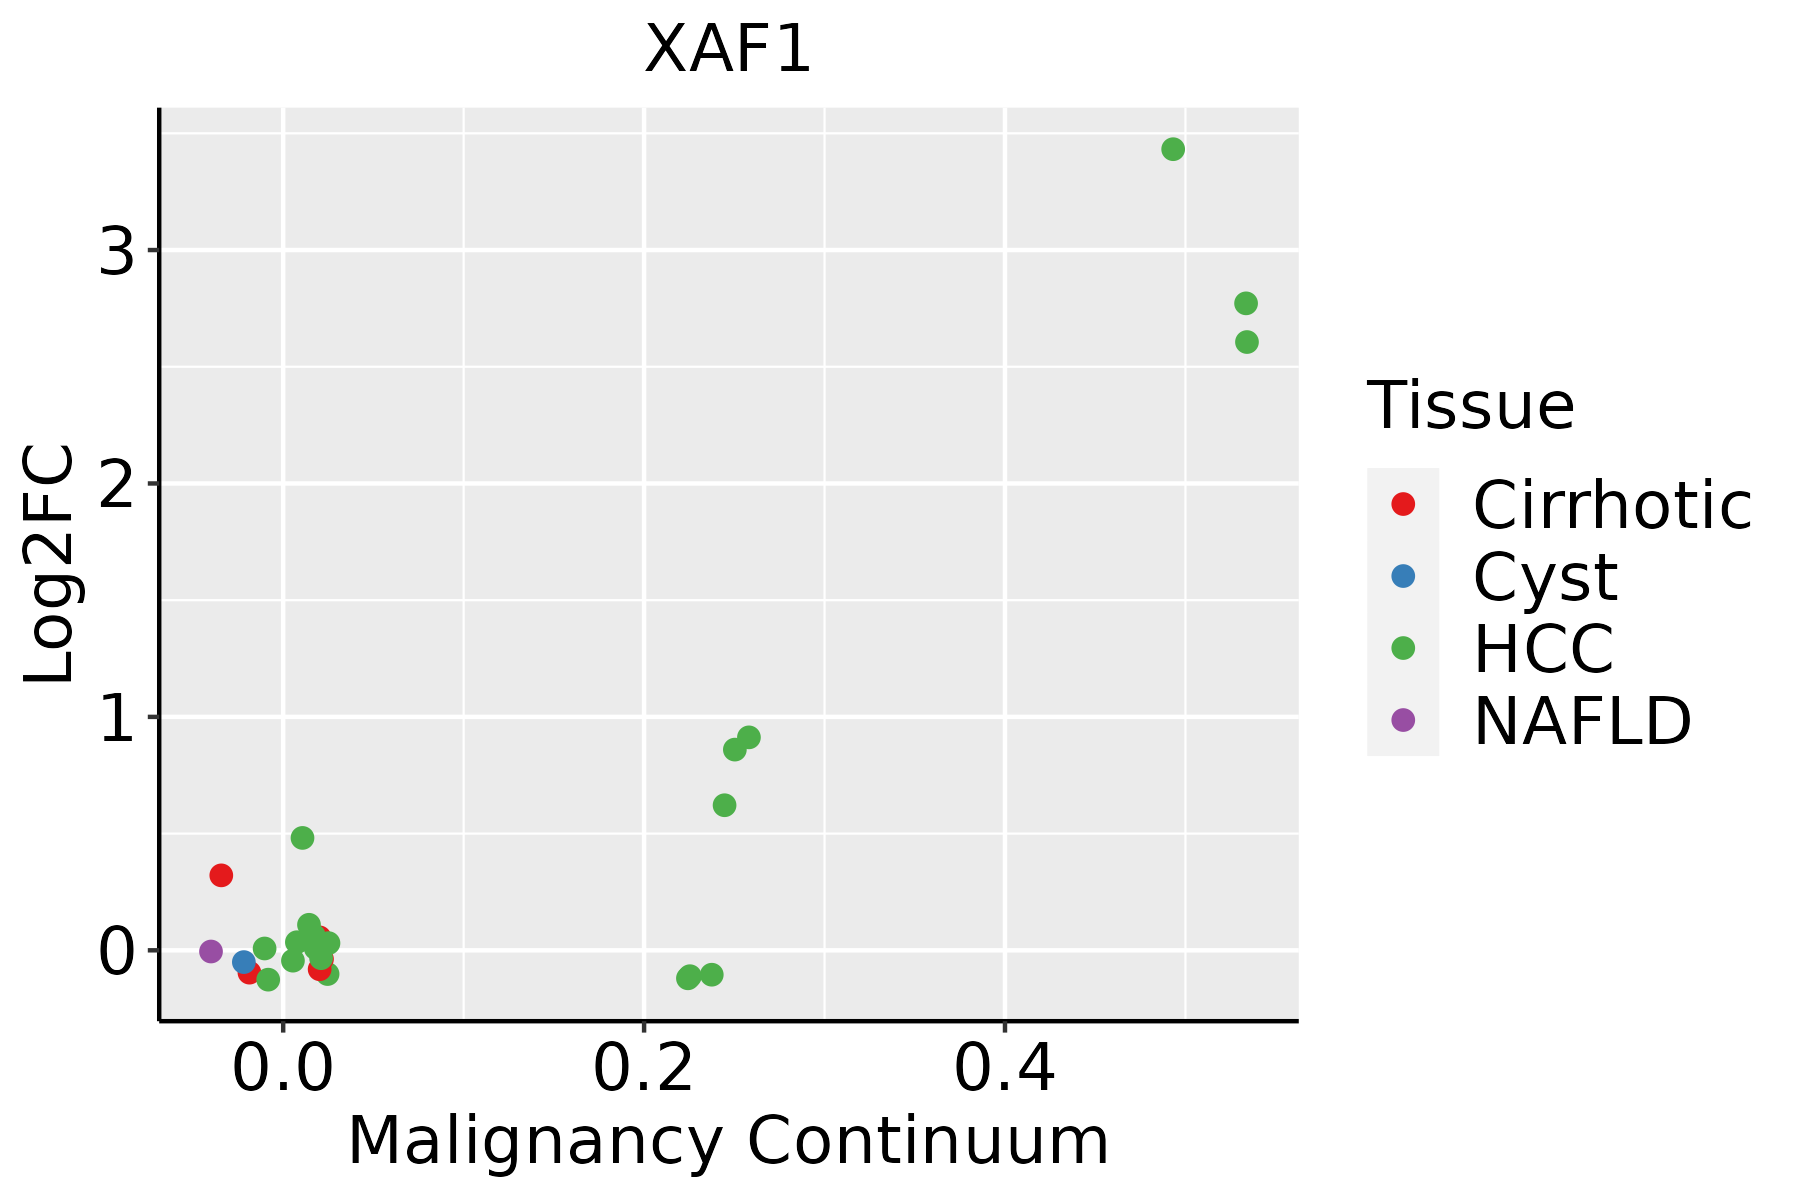 | HCC: Hepatocellular carcinoma |
| NAFLD: Non-alcoholic fatty liver disease | ||
| Oral Cavity | 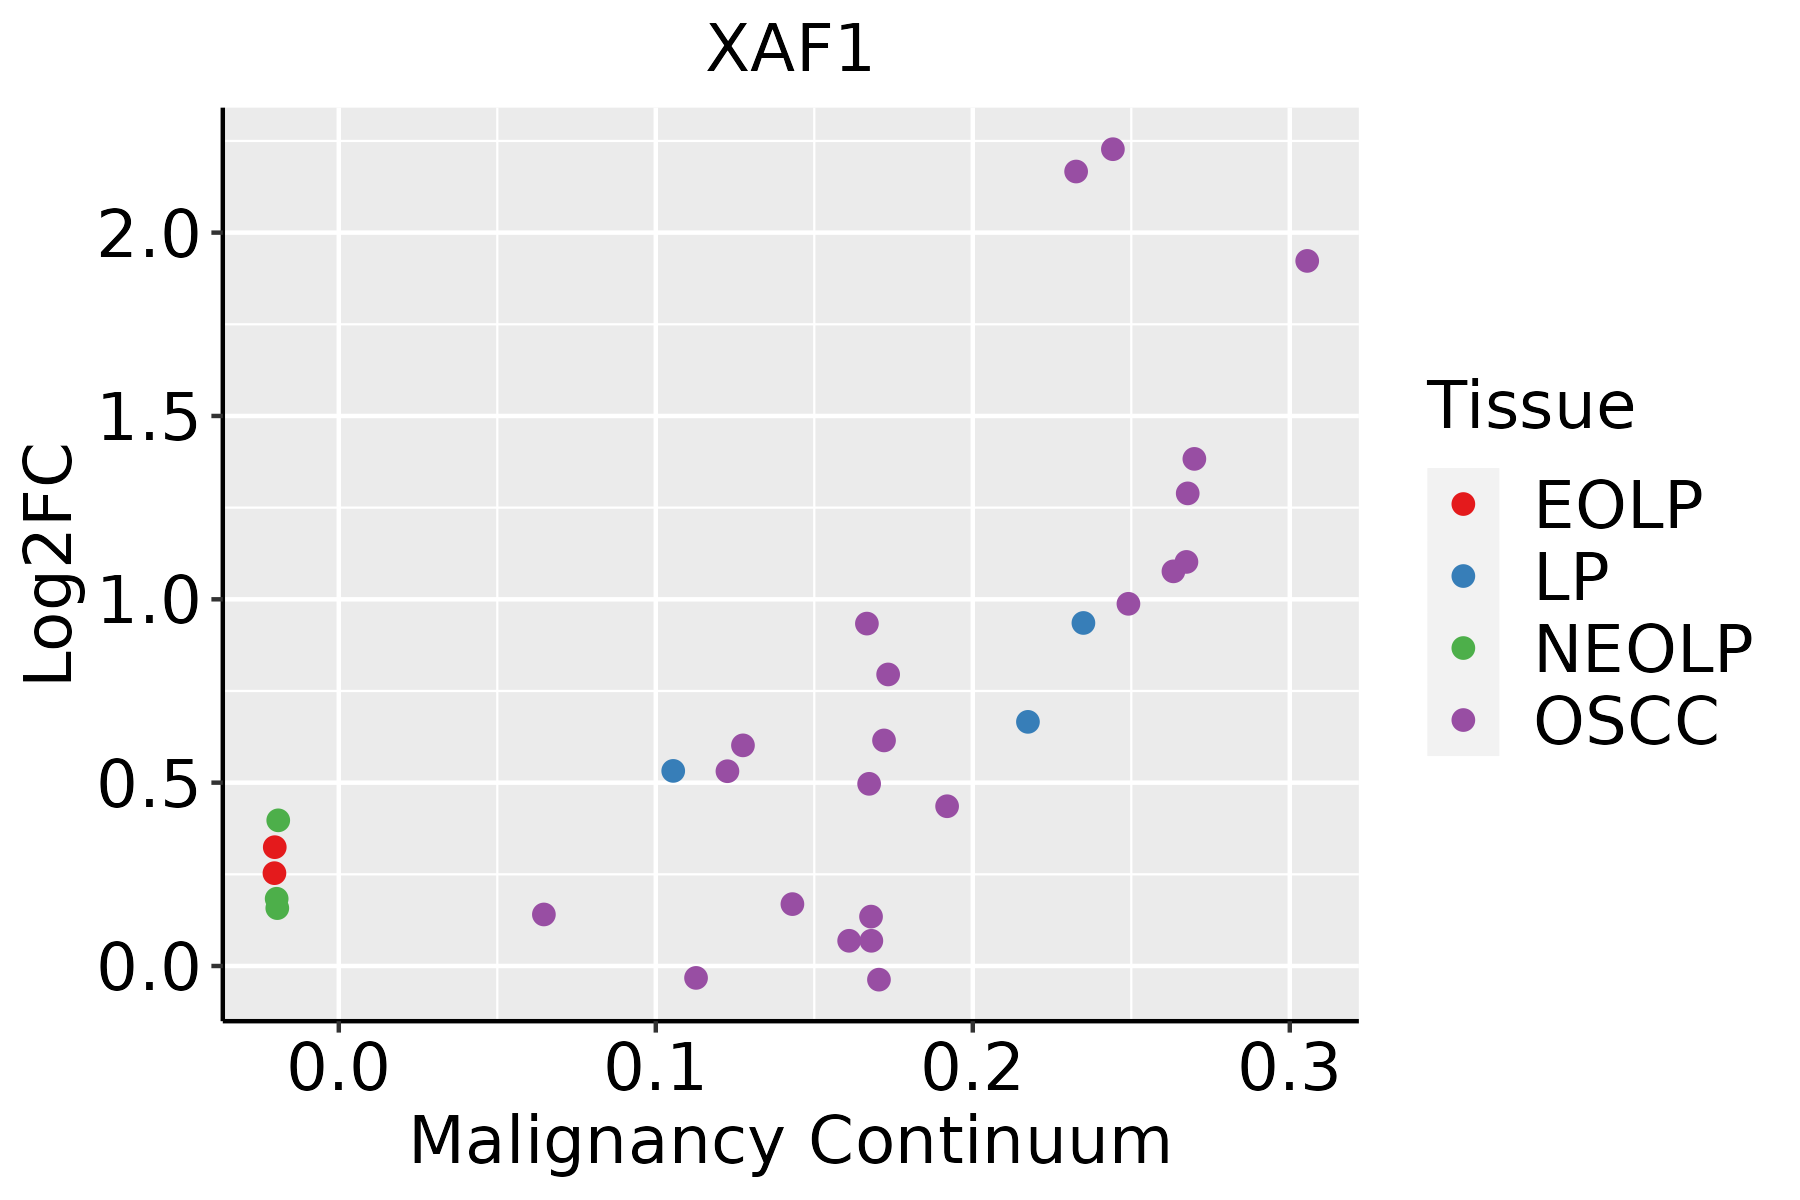 | EOLP: Erosive Oral lichen planus |
| LP: leukoplakia | ||
| NEOLP: Non-erosive oral lichen planus | ||
| OSCC: Oral squamous cell carcinoma | ||
| Prostate | 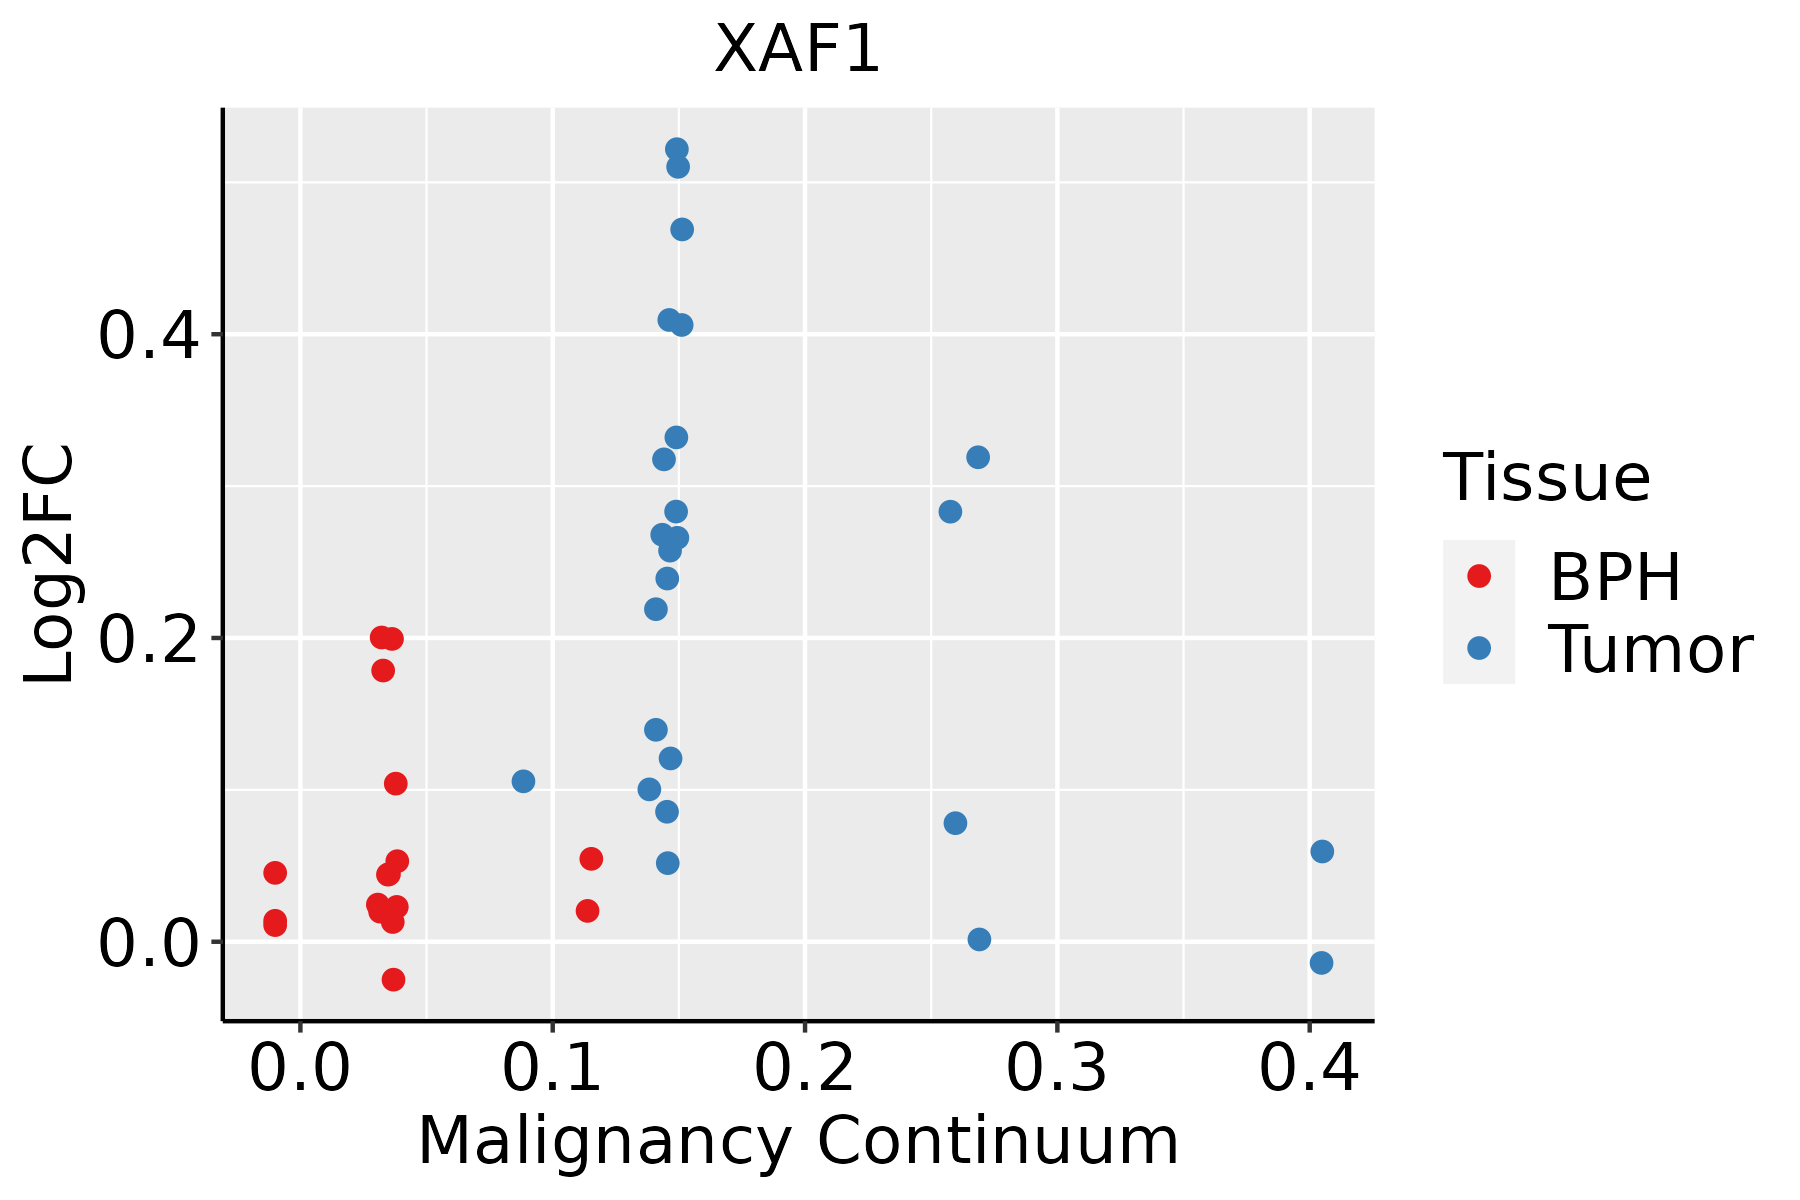 | BPH: Benign Prostatic Hyperplasia |
| Skin | 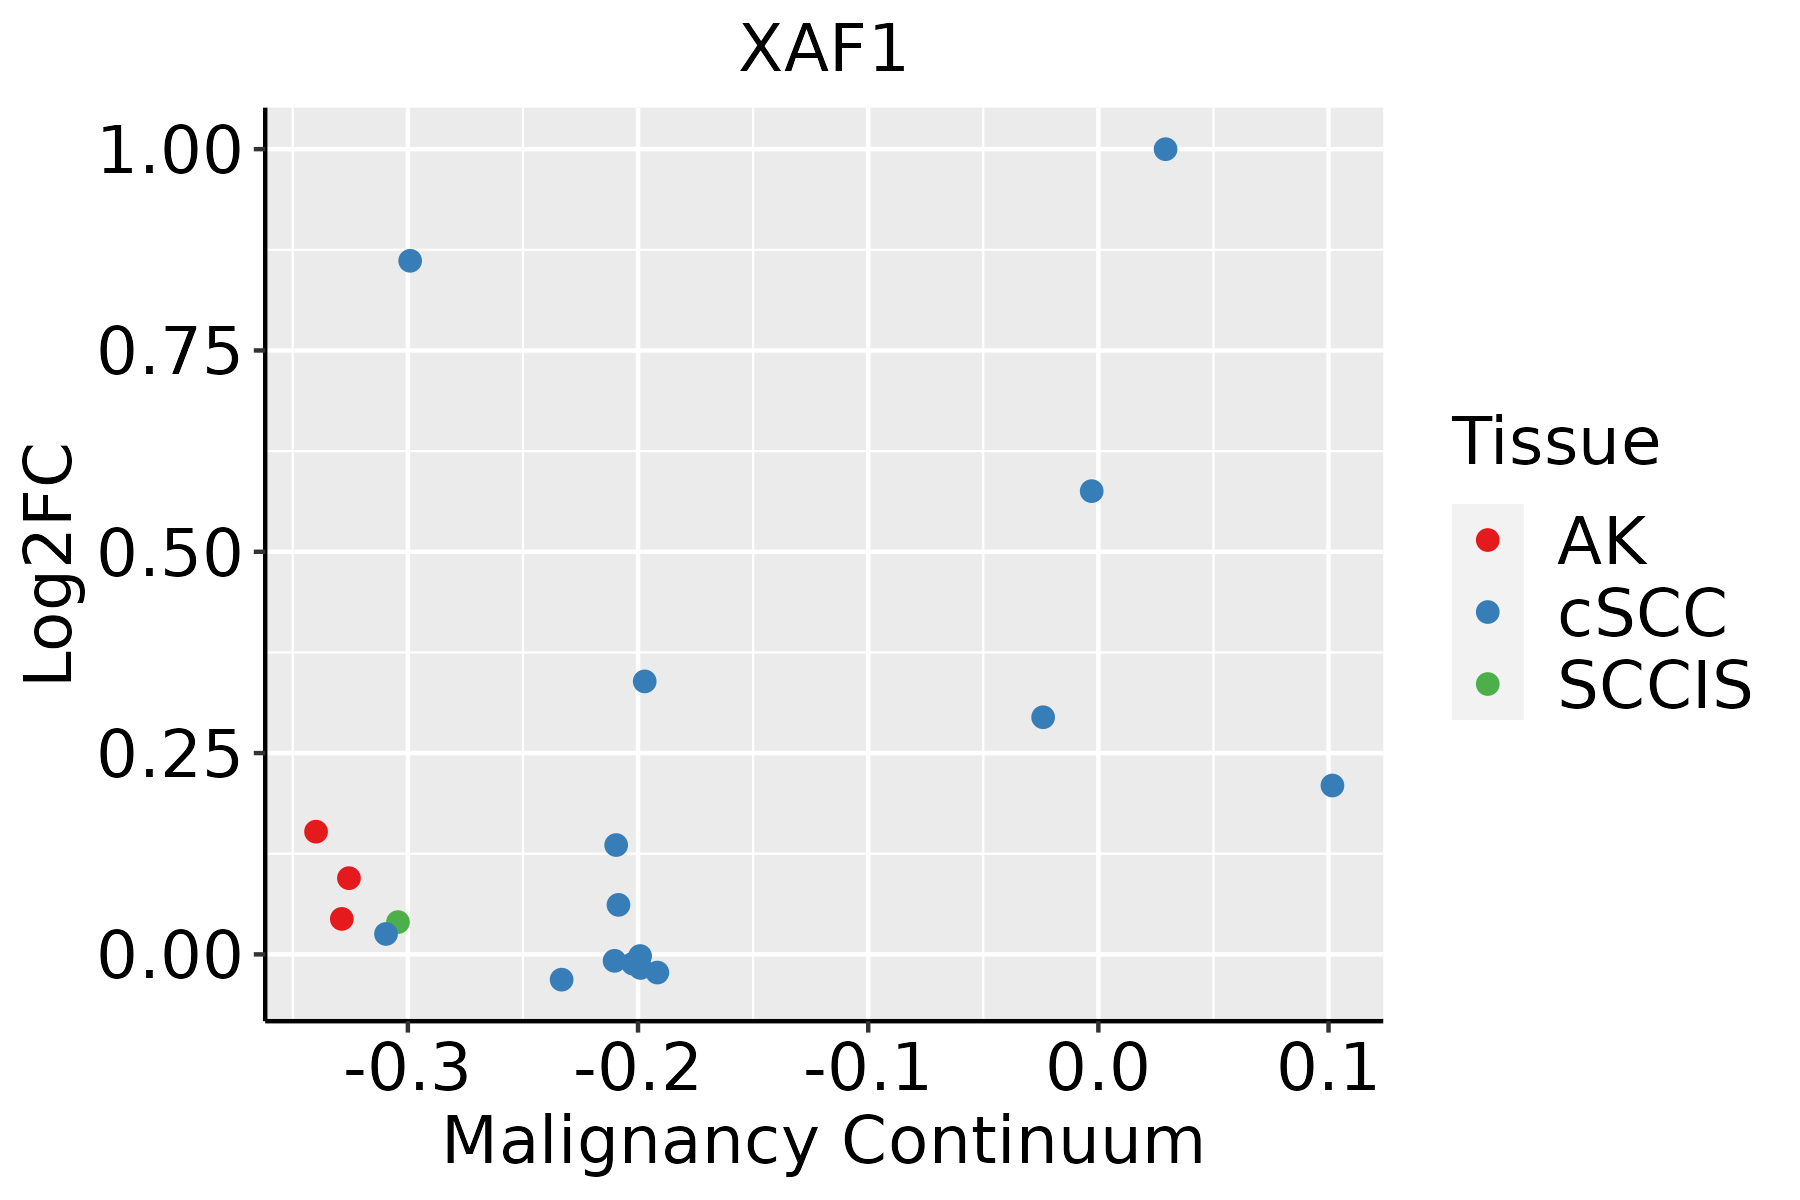 | AK: Actinic keratosis |
| cSCC: Cutaneous squamous cell carcinoma | ||
| SCCIS:squamous cell carcinoma in situ | ||
| Thyroid | 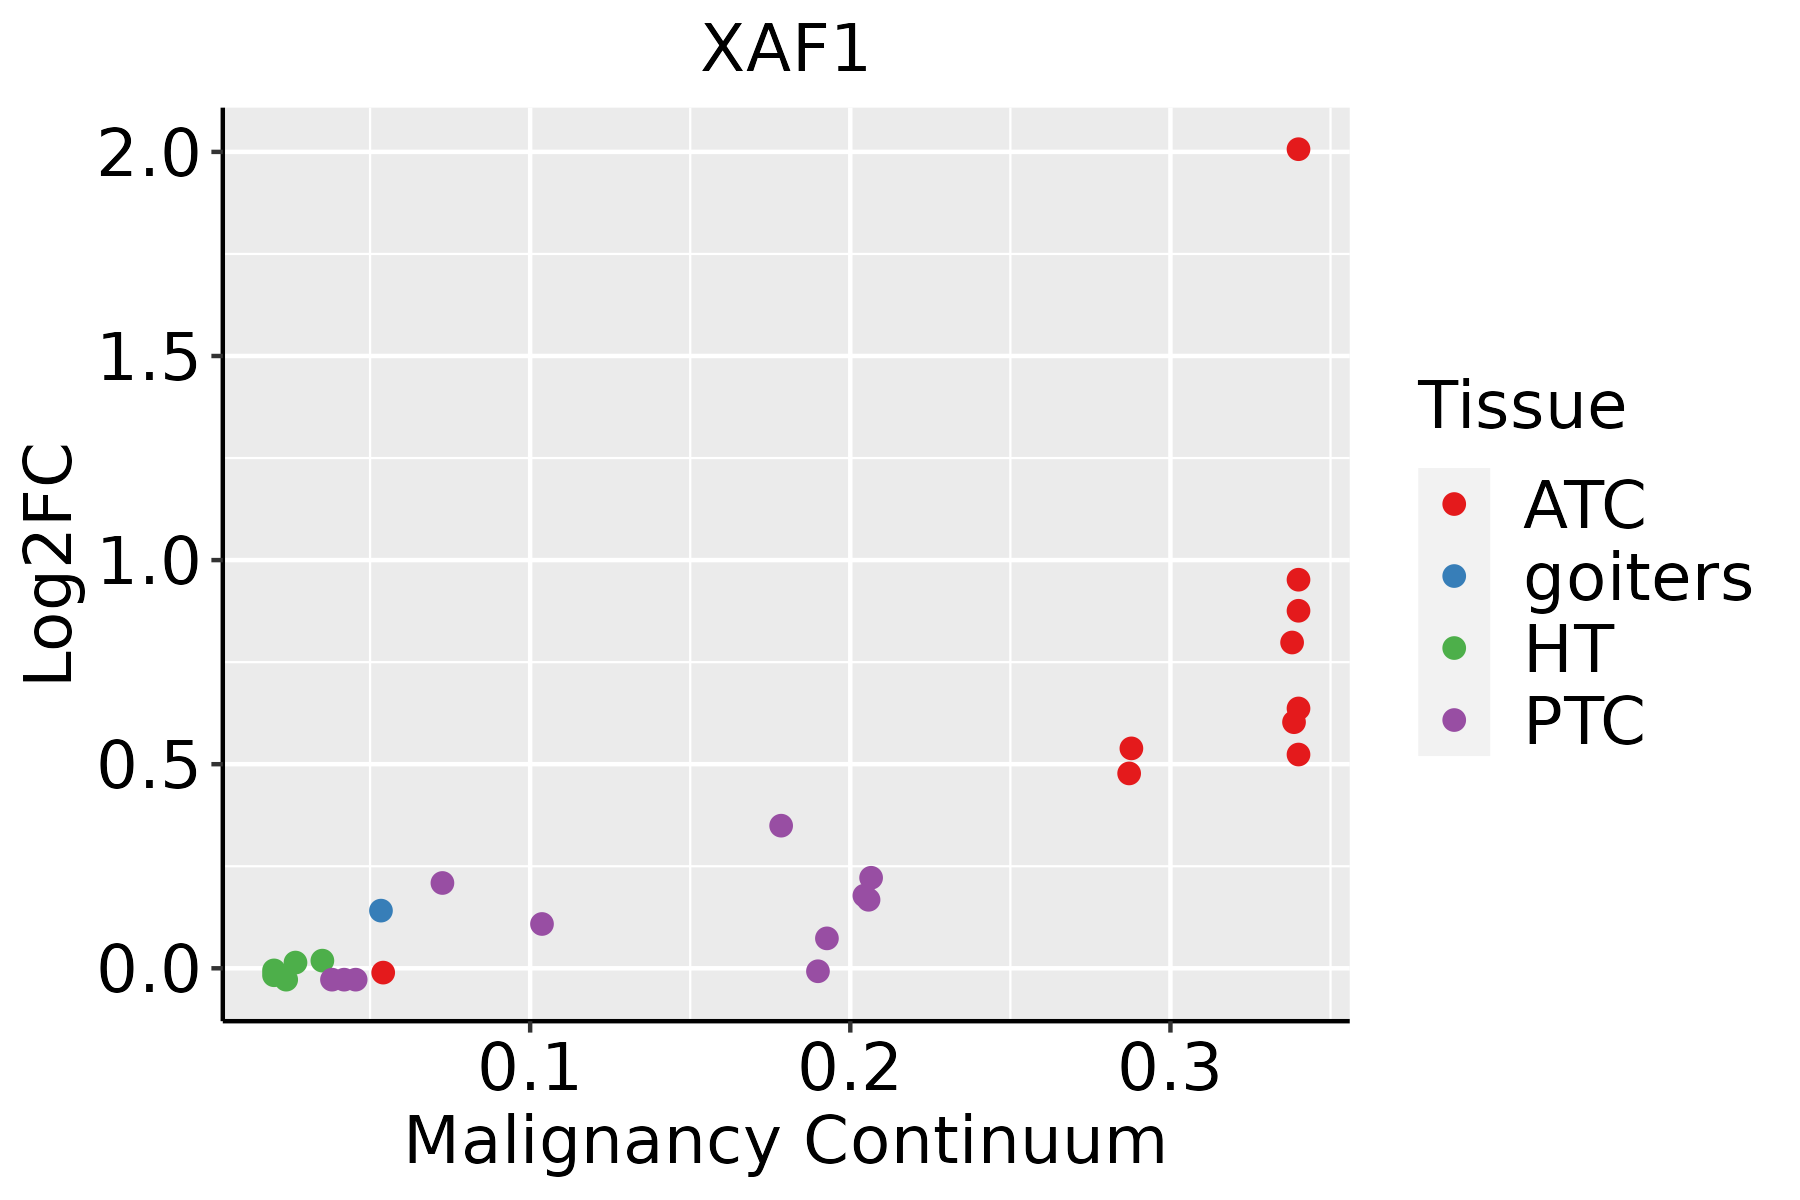 | ATC: Anaplastic thyroid cancer |
| HT: Hashimoto's thyroiditis | ||
| PTC: Papillary thyroid cancer |
| ∗log2FC in expression of this searched gene in stem-like cells from each diseased tissue sample relative to stem-like cells in normal samples in each tissue plotted against the malignancy continuum. Samples are colored based on if they are from different disease stage. |
Top |
Malignant transformation related pathway analysis |
| Find out the enriched GO biological processes and KEGG pathways involved in transition from healthy to precancer to cancer |
| Tissue | Disease Stage | Enriched GO biological Processes |
| Colorectum | AD |  |
| Colorectum | SER |  |
| Colorectum | MSS |  |
| Colorectum | MSI-H |  |
| Colorectum | FAP |  |
| ∗Top 15 enriched GO BP terms are showed in the bar plot of each disease state in each tissue. Each row represents a significant GO biological process which is colored according to the -log10(p.adjust). |
| Page: 1 2 3 4 5 6 7 8 9 |
| GO ID | Tissue | Disease Stage | Description | Gene Ratio | Bg Ratio | pvalue | p.adjust | Count |
| GO:00354566 | Oral cavity | OSCC | response to interferon-beta | 20/7305 | 32/18723 | 6.05e-03 | 2.28e-02 | 20 |
| GO:003545612 | Oral cavity | LP | response to interferon-beta | 16/4623 | 32/18723 | 1.73e-03 | 1.32e-02 | 16 |
| GO:003545621 | Oral cavity | EOLP | response to interferon-beta | 12/2218 | 32/18723 | 1.71e-04 | 1.78e-03 | 12 |
| GO:003545631 | Oral cavity | NEOLP | response to interferon-beta | 13/2005 | 32/18723 | 1.14e-05 | 2.10e-04 | 13 |
| GO:00354565 | Prostate | BPH | response to interferon-beta | 12/3107 | 32/18723 | 3.66e-03 | 1.85e-02 | 12 |
| GO:003545611 | Prostate | Tumor | response to interferon-beta | 12/3246 | 32/18723 | 5.30e-03 | 2.54e-02 | 12 |
| GO:00354567 | Skin | cSCC | response to interferon-beta | 16/4864 | 32/18723 | 3.04e-03 | 1.67e-02 | 16 |
| Page: 1 |
| Pathway ID | Tissue | Disease Stage | Description | Gene Ratio | Bg Ratio | pvalue | p.adjust | qvalue | Count |
| Page: 1 |
Top |
Cell-cell communication analysis |
| Identification of potential cell-cell interactions between two cell types and their ligand-receptor pairs for different disease states |
| Ligand | Receptor | LRpair | Pathway | Tissue | Disease Stage |
| Page: 1 |
Top |
Single-cell gene regulatory network inference analysis |
| Find out the significant the regulons (TFs) and the target genes of each regulon across cell types for different disease states |
| TF | Cell Type | Tissue | Disease Stage | Target Gene | RSS | Regulon Activity |
| ∗The dot plots of a searched regulon are shown for all cell subpopulations in each disease state of each tissue based on the regulon specific score inferred using pySCENIC and by calculating the average expression. |
| Page: 1 |
Top |
Somatic mutation of malignant transformation related genes |
| Annotation of somatic variants for genes involved in malignant transformation |
| Hugo Symbol | Variant Class | Variant Classification | dbSNP RS | HGVSc | HGVSp | HGVSp Short | SWISSPROT | BIOTYPE | SIFT | PolyPhen | Tumor Sample Barcode | Tissue | Histology | Sex | Age | Stage | Therapy Types | Drugs | Outcome |
| XAF1 | SNV | Missense_Mutation | novel | c.376N>G | p.Gln126Glu | p.Q126E | Q6GPH4 | protein_coding | tolerated(0.15) | benign(0.175) | TCGA-A8-A09M-01 | Breast | breast invasive carcinoma | Female | >=65 | III/IV | Chemotherapy | paclitaxel | CR |
| XAF1 | SNV | Missense_Mutation | rs774538537 | c.859C>T | p.Arg287Trp | p.R287W | Q6GPH4 | protein_coding | tolerated(0.05) | benign(0) | TCGA-EW-A1OV-01 | Breast | breast invasive carcinoma | Female | <65 | I/II | Chemotherapy | epirubicin | SD |
| XAF1 | SNV | Missense_Mutation | c.829N>T | p.Pro277Ser | p.P277S | Q6GPH4 | protein_coding | deleterious(0) | probably_damaging(0.999) | TCGA-AA-A01P-01 | Colorectum | colon adenocarcinoma | Female | >=65 | III/IV | Unknown | Unknown | PD | |
| XAF1 | SNV | Missense_Mutation | novel | c.653N>G | p.Asn218Ser | p.N218S | Q6GPH4 | protein_coding | tolerated(0.23) | benign(0.022) | TCGA-CA-6717-01 | Colorectum | colon adenocarcinoma | Male | <65 | I/II | Chemotherapy | oxaliplatin | CR |
| XAF1 | SNV | Missense_Mutation | rs778052611 | c.564N>T | p.Glu188Asp | p.E188D | Q6GPH4 | protein_coding | tolerated(0.49) | benign(0) | TCGA-CM-5348-01 | Colorectum | colon adenocarcinoma | Male | >=65 | III/IV | Unknown | Unknown | SD |
| XAF1 | SNV | Missense_Mutation | novel | c.28N>T | p.Asn10Tyr | p.N10Y | Q6GPH4 | protein_coding | tolerated(0.05) | possibly_damaging(0.724) | TCGA-AG-A002-01 | Colorectum | rectum adenocarcinoma | Male | <65 | I/II | Unknown | Unknown | SD |
| XAF1 | SNV | Missense_Mutation | novel | c.544T>C | p.Phe182Leu | p.F182L | Q6GPH4 | protein_coding | tolerated(0.64) | benign(0.003) | TCGA-AJ-A23O-01 | Endometrium | uterine corpus endometrioid carcinoma | Female | >=65 | I/II | Unknown | Unknown | SD |
| XAF1 | SNV | Missense_Mutation | novel | c.608C>A | p.Thr203Asn | p.T203N | Q6GPH4 | protein_coding | deleterious(0.01) | benign(0.444) | TCGA-AX-A06F-01 | Endometrium | uterine corpus endometrioid carcinoma | Female | <65 | III/IV | Chemotherapy | carboplatin | SD |
| XAF1 | SNV | Missense_Mutation | novel | c.889G>T | p.Val297Leu | p.V297L | Q6GPH4 | protein_coding | tolerated(0.09) | benign(0.06) | TCGA-B5-A1MX-01 | Endometrium | uterine corpus endometrioid carcinoma | Female | <65 | I/II | Hormone Therapy | megace | SD |
| XAF1 | SNV | Missense_Mutation | novel | c.172N>A | p.Gly58Arg | p.G58R | Q6GPH4 | protein_coding | tolerated(0.66) | benign(0.015) | TCGA-DF-A2KU-01 | Endometrium | uterine corpus endometrioid carcinoma | Female | Unknown | I/II | Unknown | Unknown | SD |
| Page: 1 2 |
Top |
Related drugs of malignant transformation related genes |
| Identification of chemicals and drugs interact with genes involved in malignant transfromation |
| (DGIdb 4.0) |
| Entrez ID | Symbol | Category | Interaction Types | Drug Claim Name | Drug Name | PMIDs |
| Page: 1 |

Copyright 2023-Present -The University of Texas Health Science Center at Houston |