| Tissue | Expression Dynamics | Abbreviation |
| Cervix | 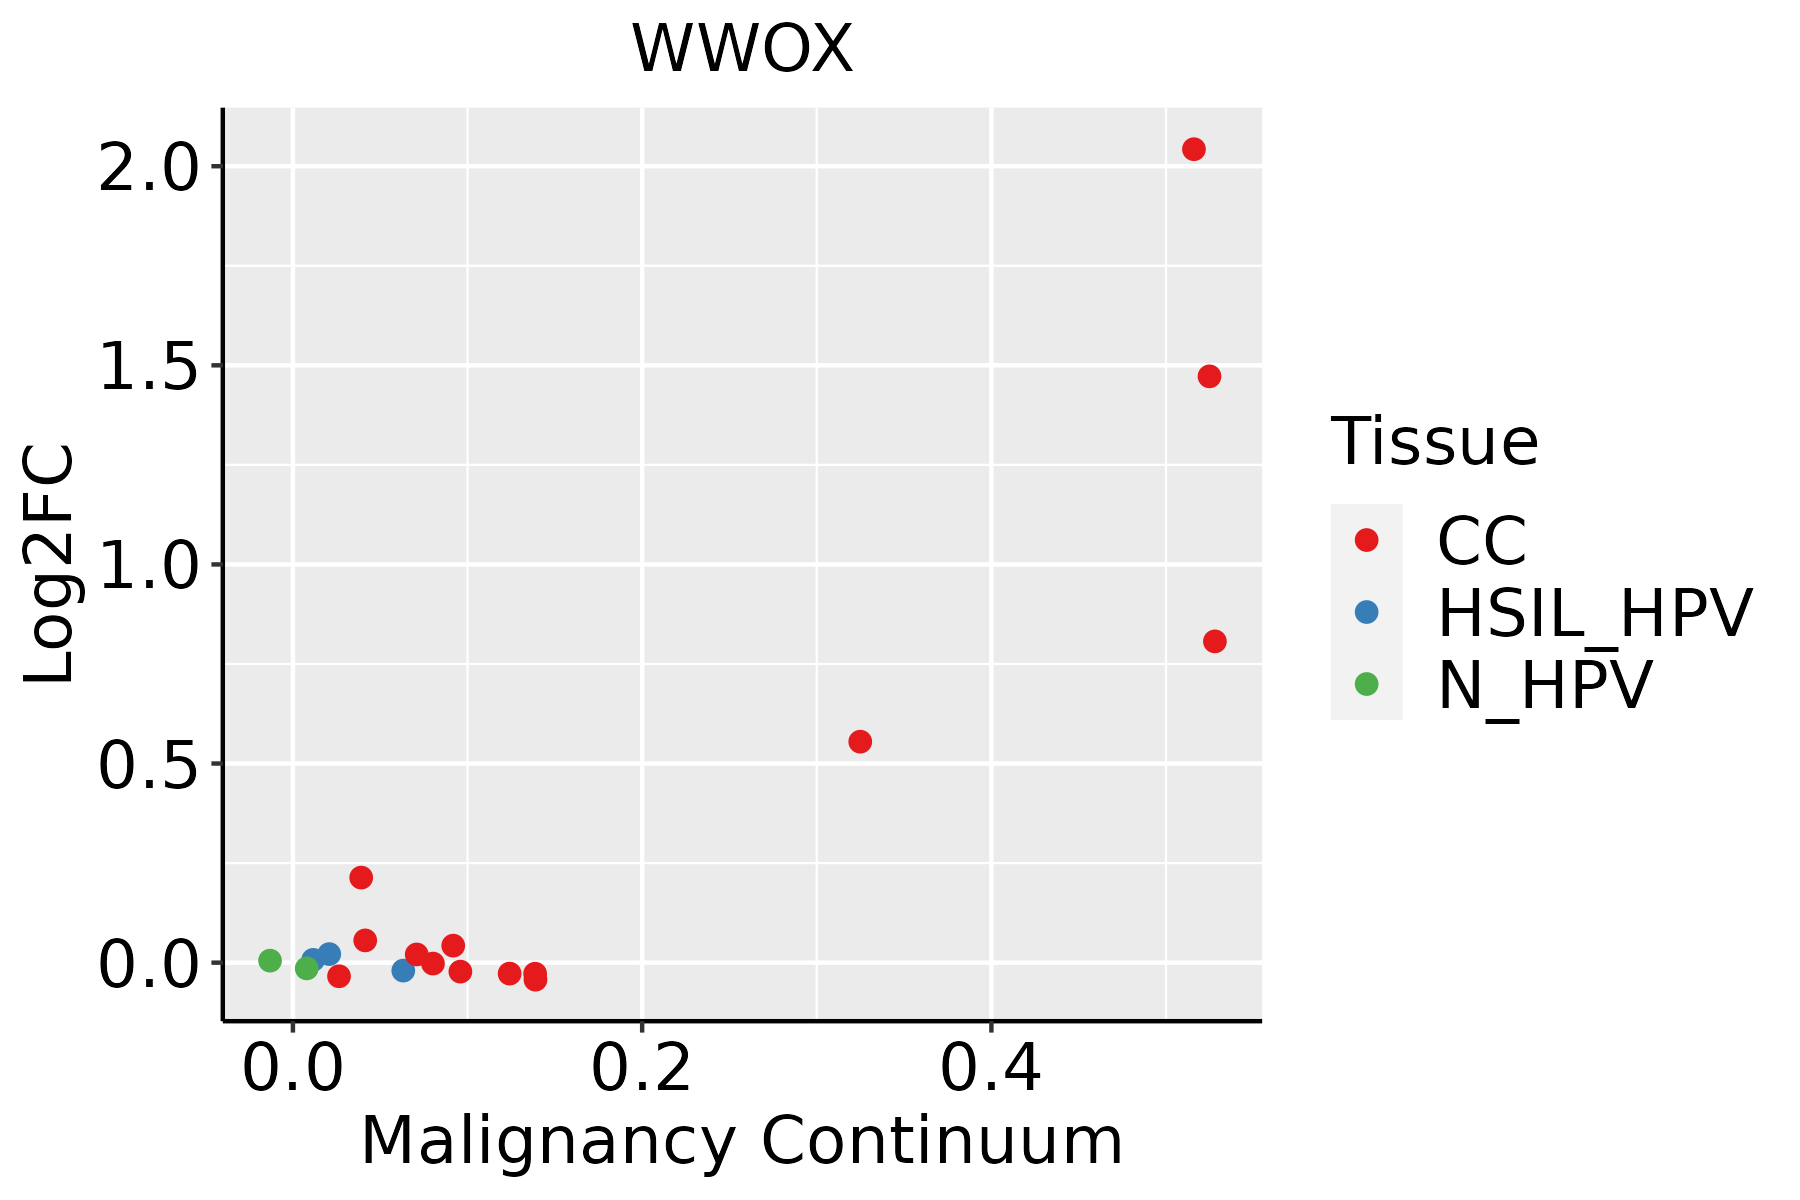 | CC: Cervix cancer |
| HSIL_HPV: HPV-infected high-grade squamous intraepithelial lesions |
| N_HPV: HPV-infected normal cervix |
| Colorectum (GSE201348) |  | FAP: Familial adenomatous polyposis |
| CRC: Colorectal cancer |
| Colorectum (HTA11) |  | AD: Adenomas |
| SER: Sessile serrated lesions |
| MSI-H: Microsatellite-high colorectal cancer |
| MSS: Microsatellite stable colorectal cancer |
| Endometrium |  | AEH: Atypical endometrial hyperplasia |
| EEC: Endometrioid Cancer |
| Esophagus | 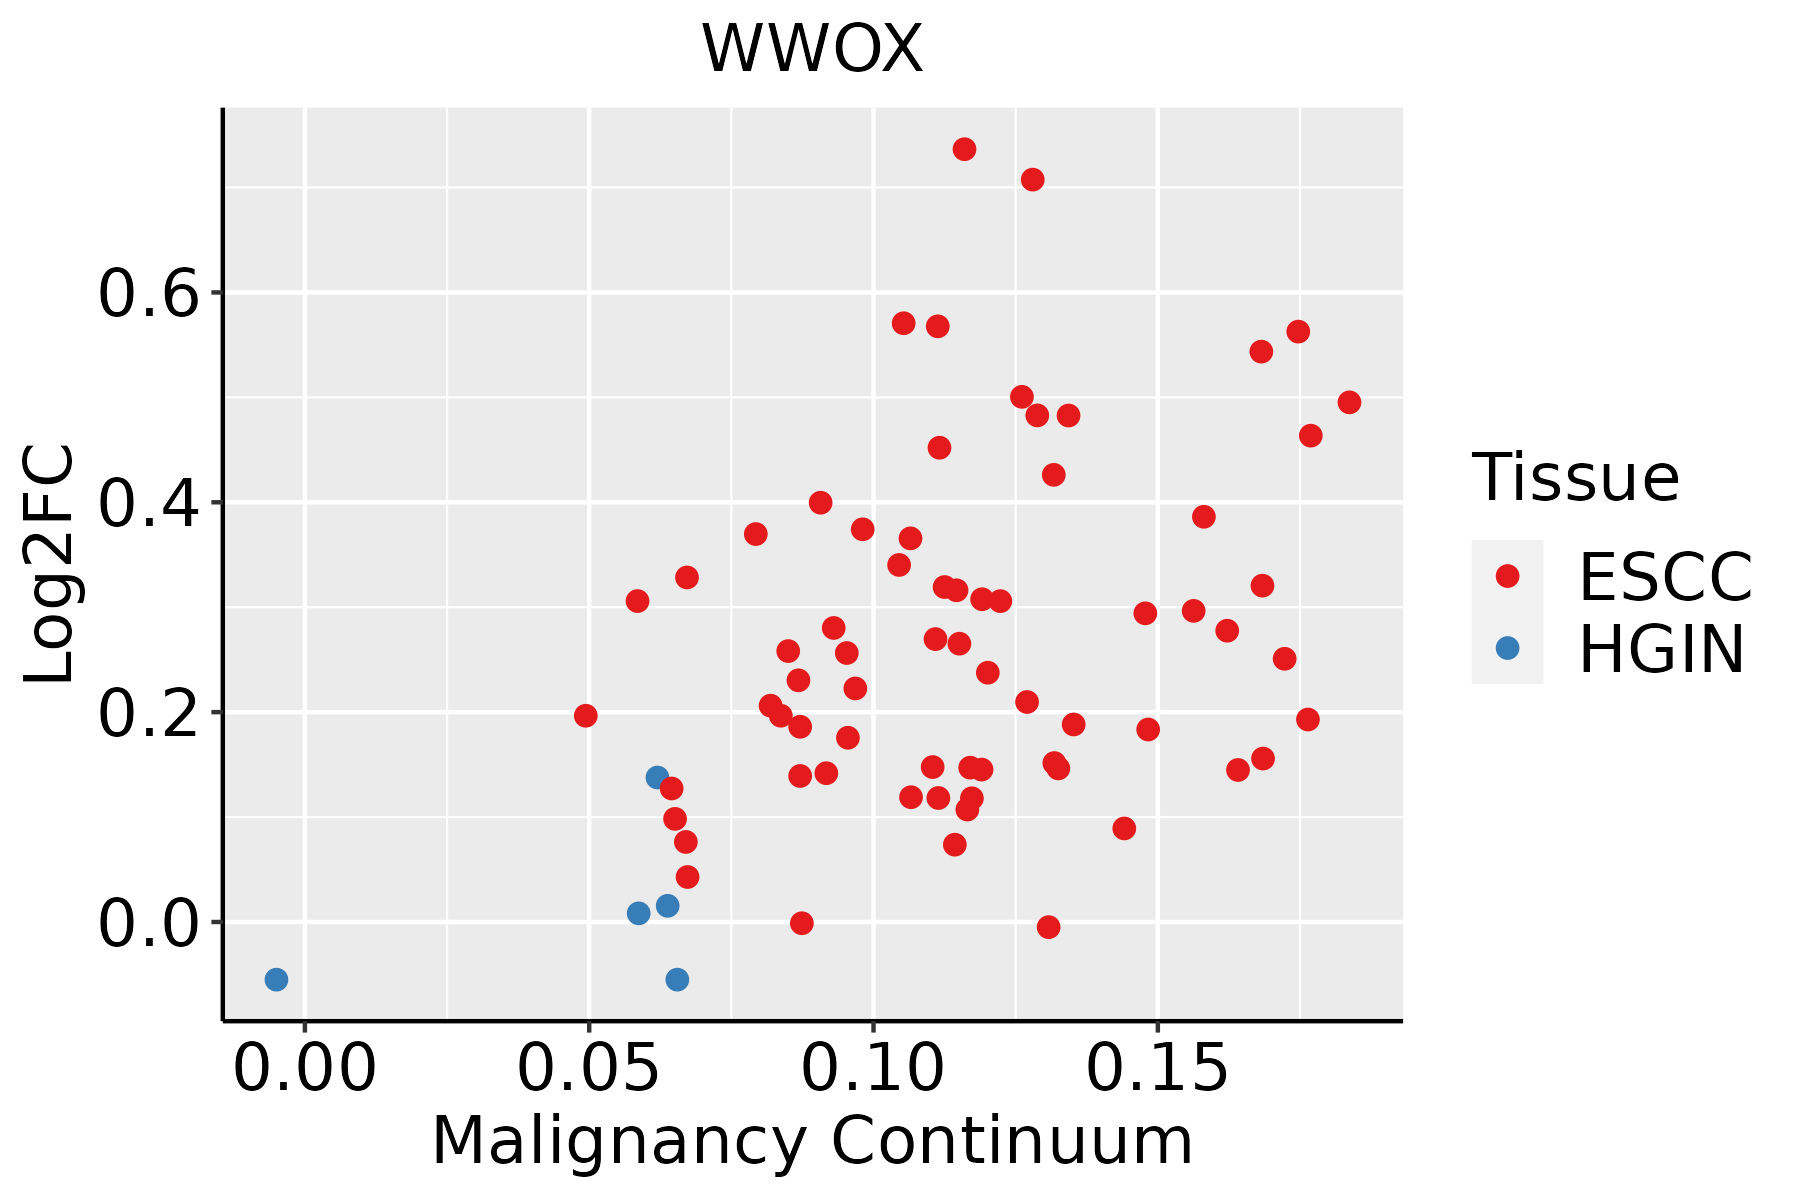 | ESCC: Esophageal squamous cell carcinoma |
| HGIN: High-grade intraepithelial neoplasias |
| LGIN: Low-grade intraepithelial neoplasias |
| GC | 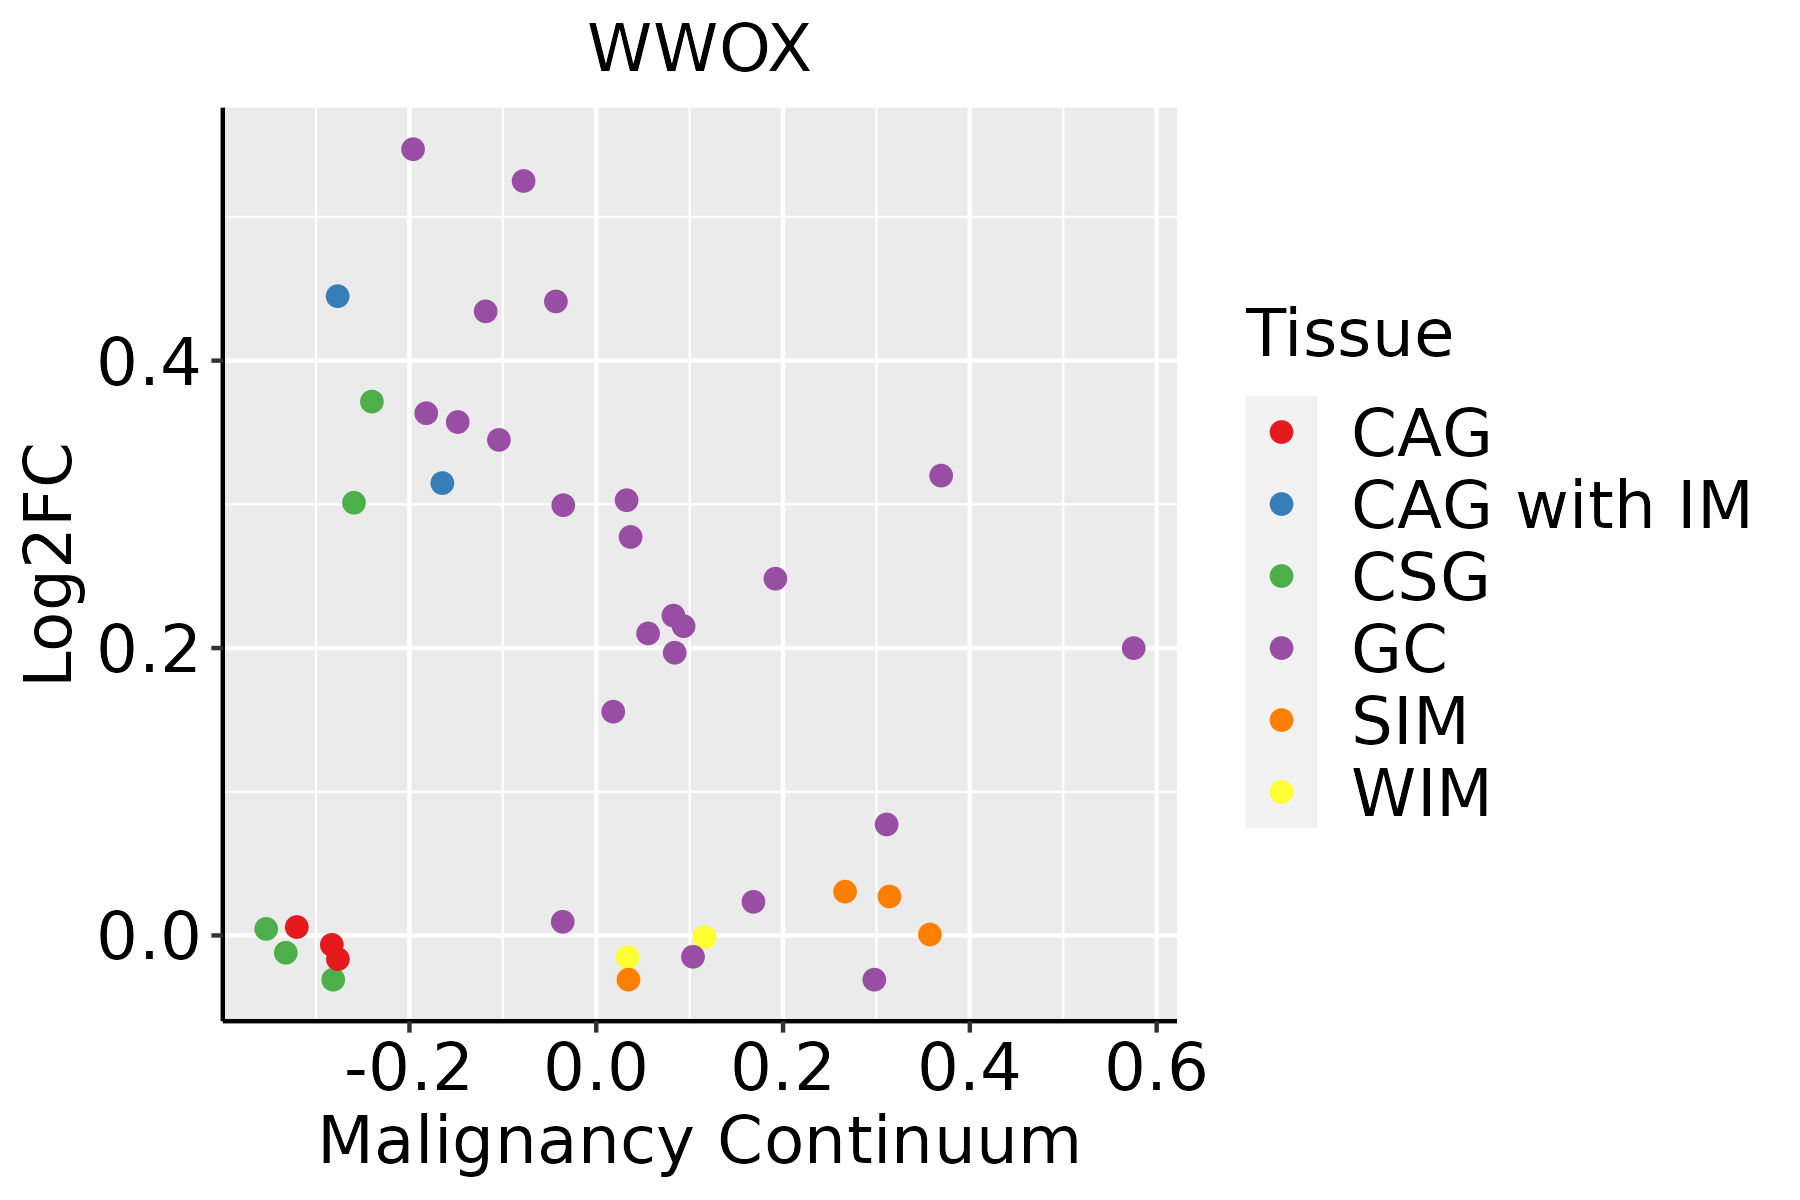 | CAG: Chronic atrophic gastritis |
| CAG with IM: Chronic atrophic gastritis with intestinal metaplasia |
| CSG: Chronic superficial gastritis |
| GC: Gastric cancer |
| SIM: Severe intestinal metaplasia |
| WIM: Wild intestinal metaplasia |
| Liver | 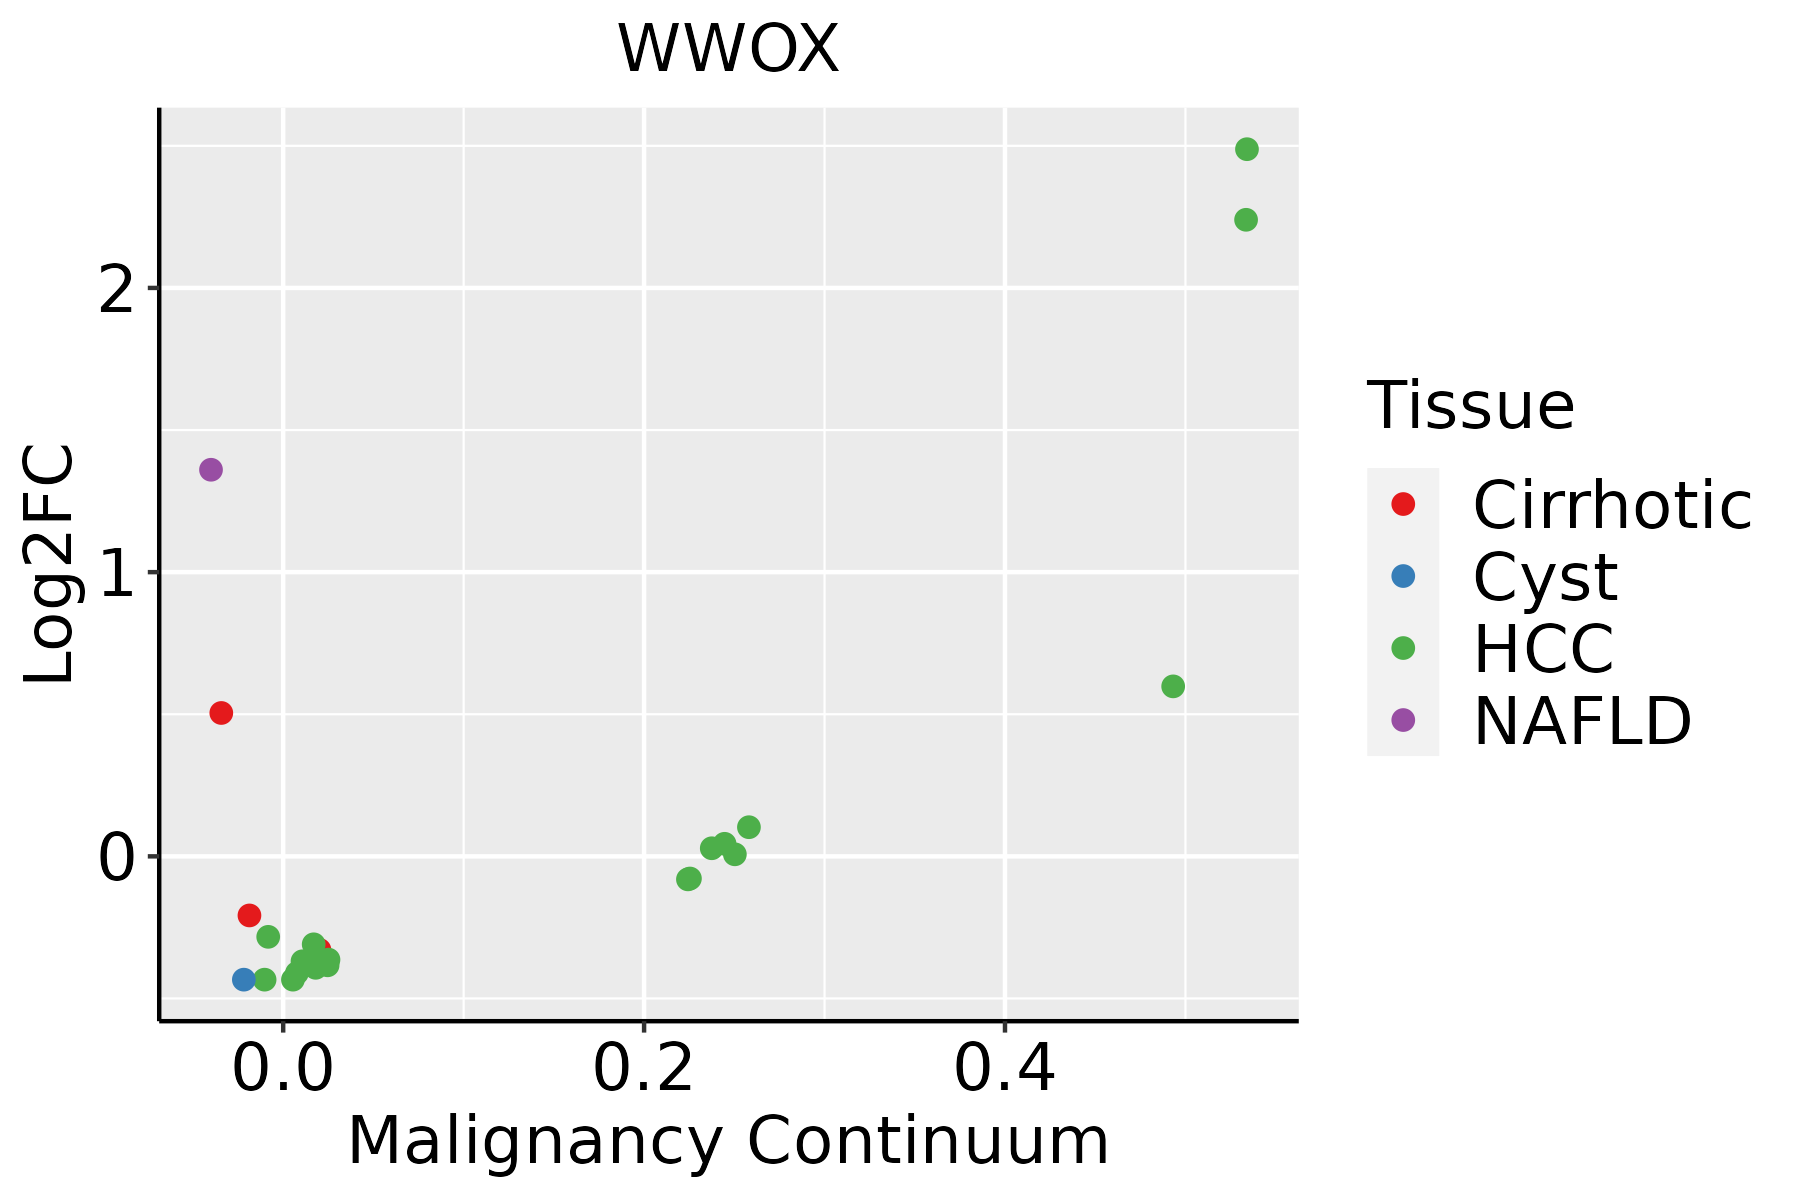 | HCC: Hepatocellular carcinoma |
| NAFLD: Non-alcoholic fatty liver disease |
| Lung | 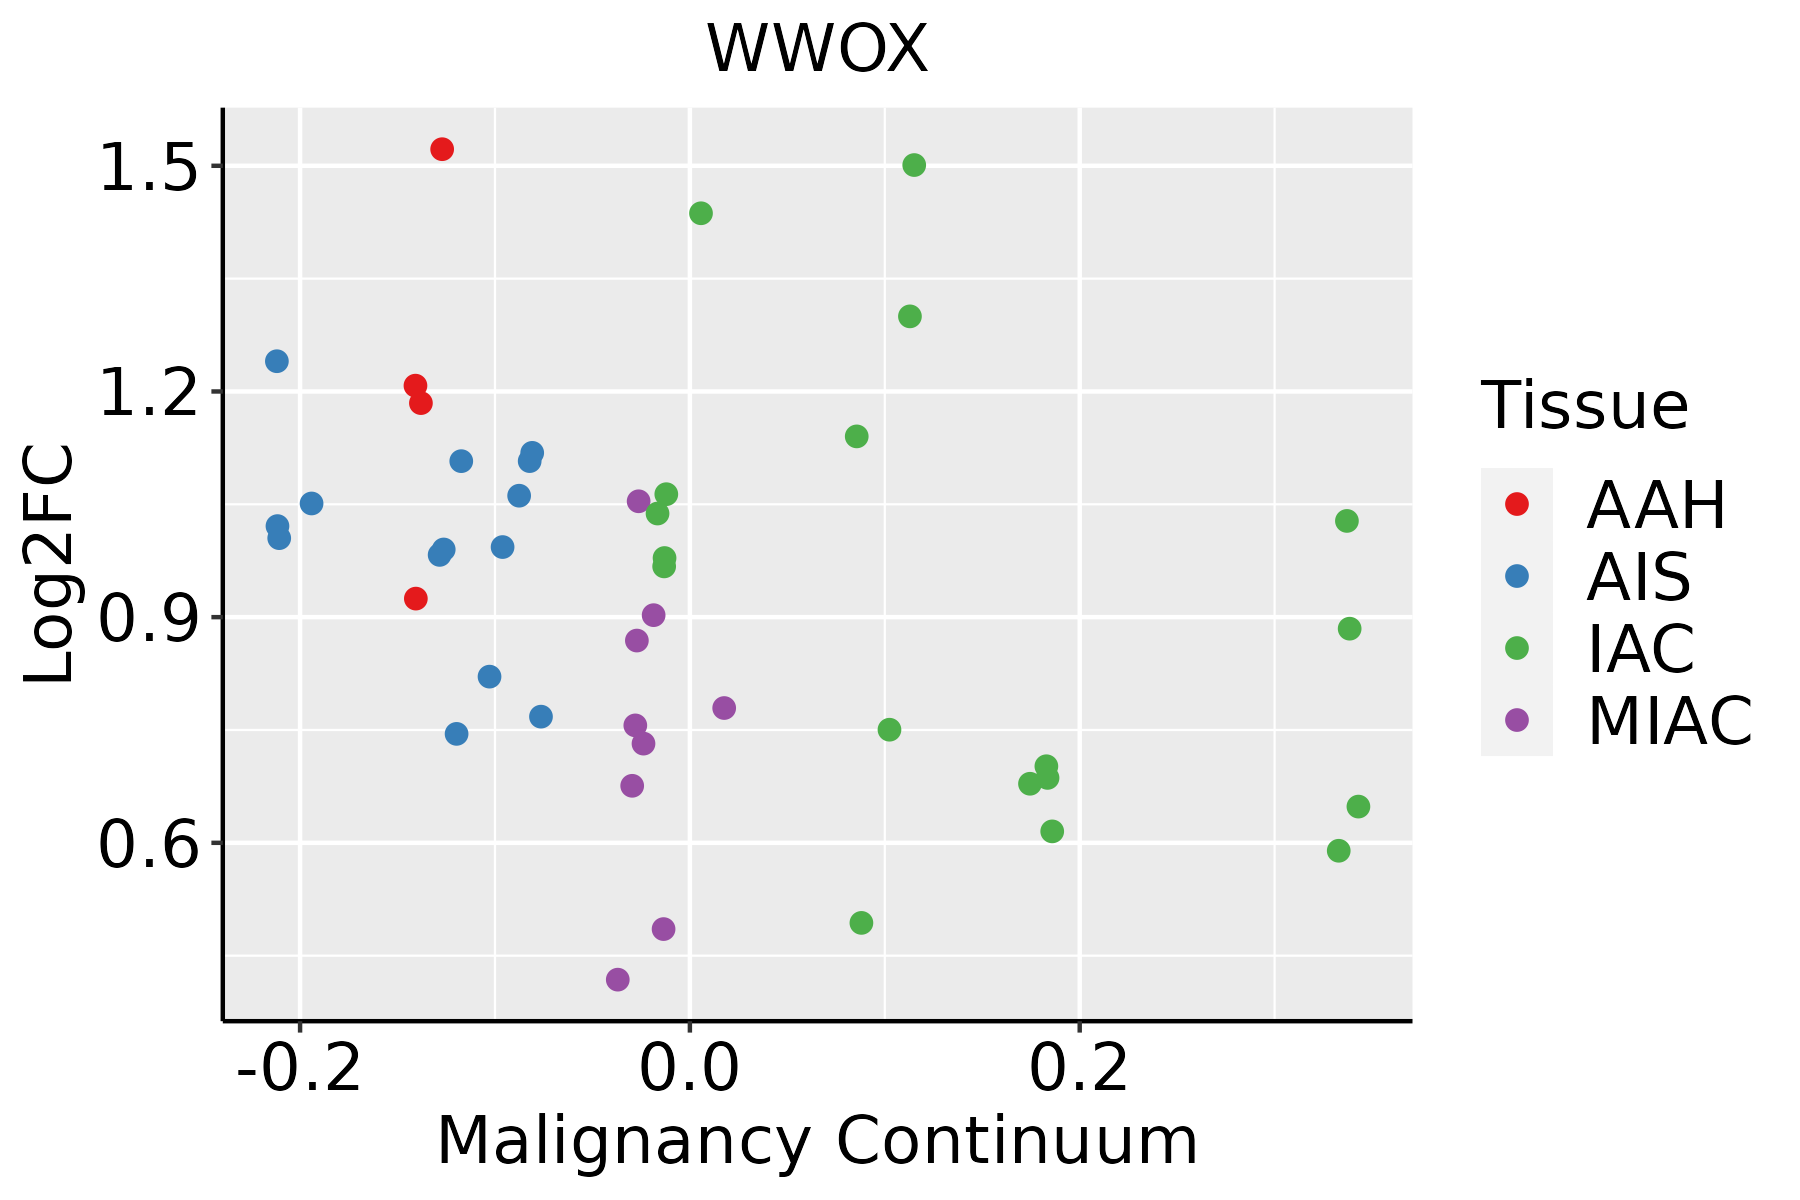 | AAH: Atypical adenomatous hyperplasia |
| AIS: Adenocarcinoma in situ |
| IAC: Invasive lung adenocarcinoma |
| MIA: Minimally invasive adenocarcinoma |
| Oral Cavity |  | EOLP: Erosive Oral lichen planus |
| LP: leukoplakia |
| NEOLP: Non-erosive oral lichen planus |
| OSCC: Oral squamous cell carcinoma |
| Prostate | 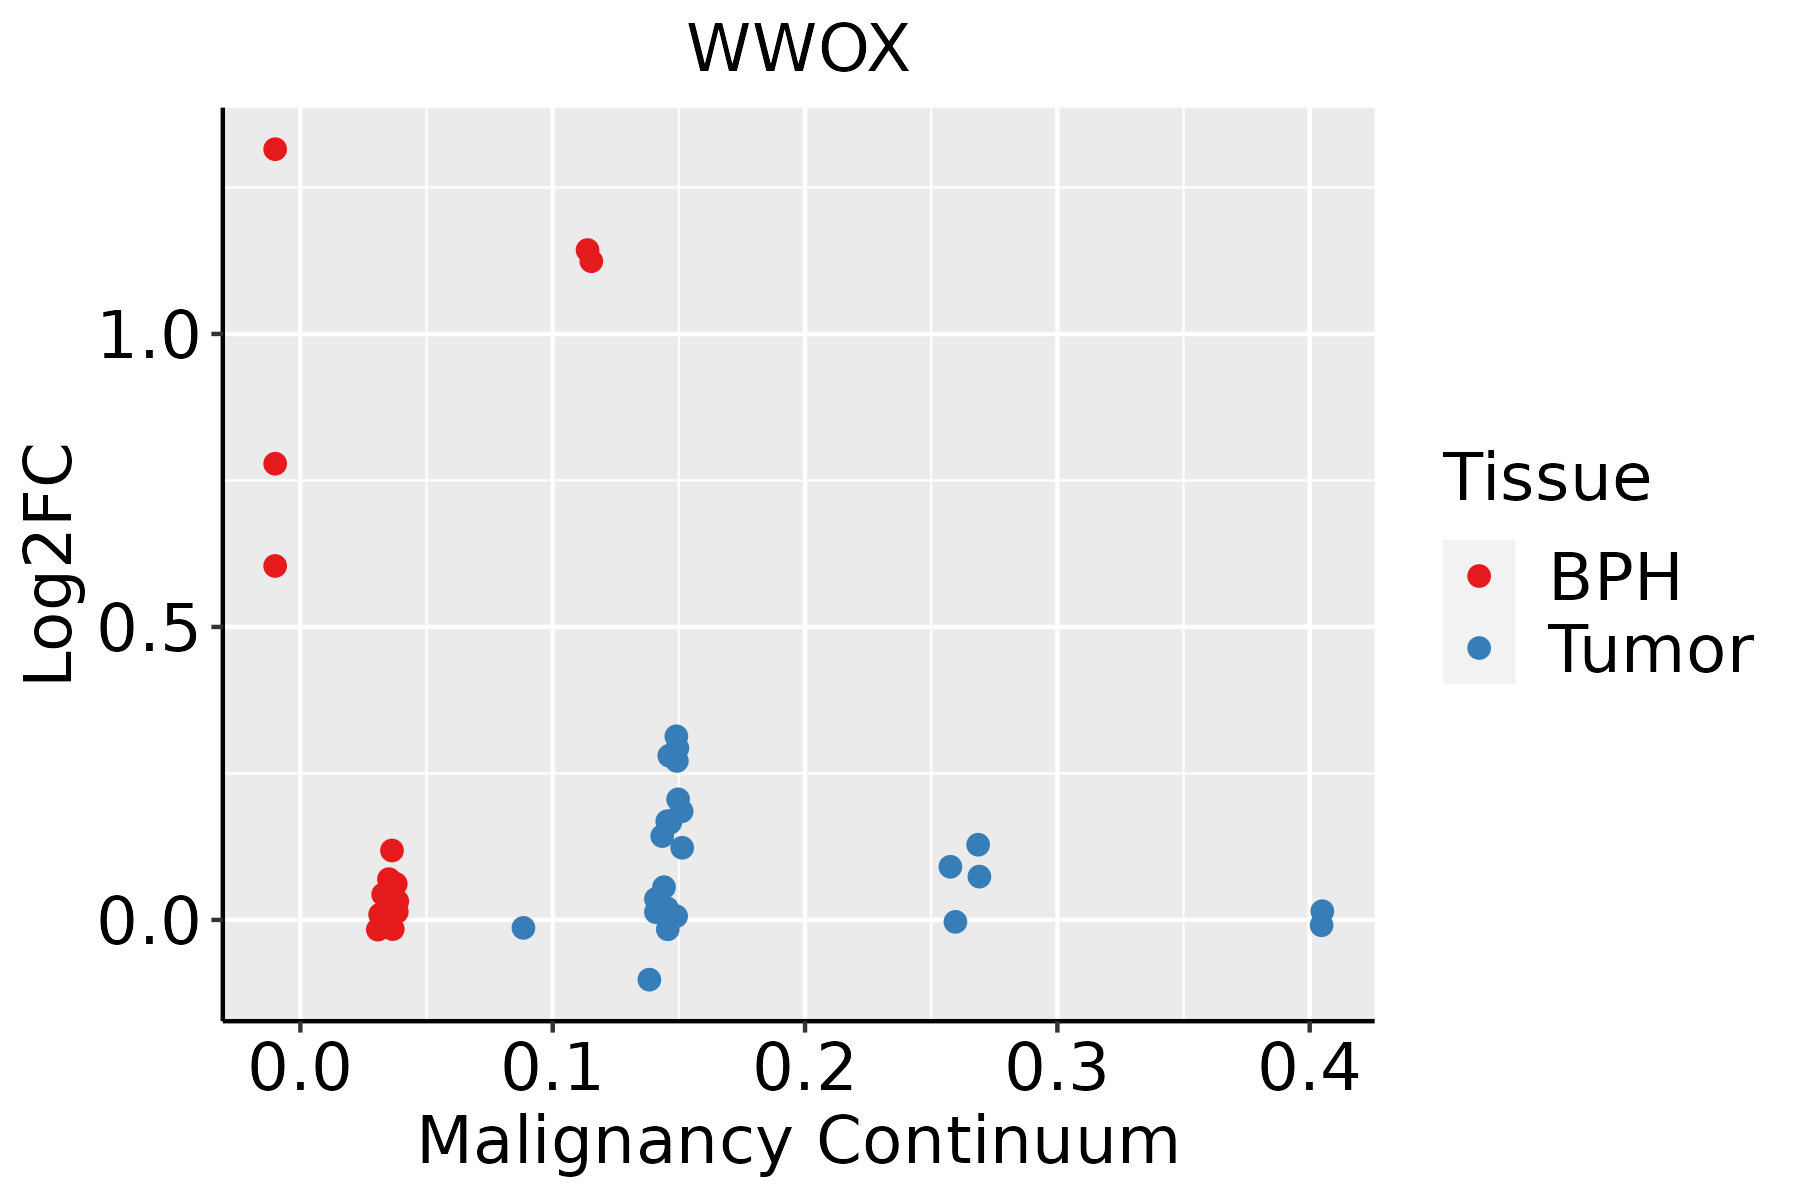 | BPH: Benign Prostatic Hyperplasia |
| Skin | 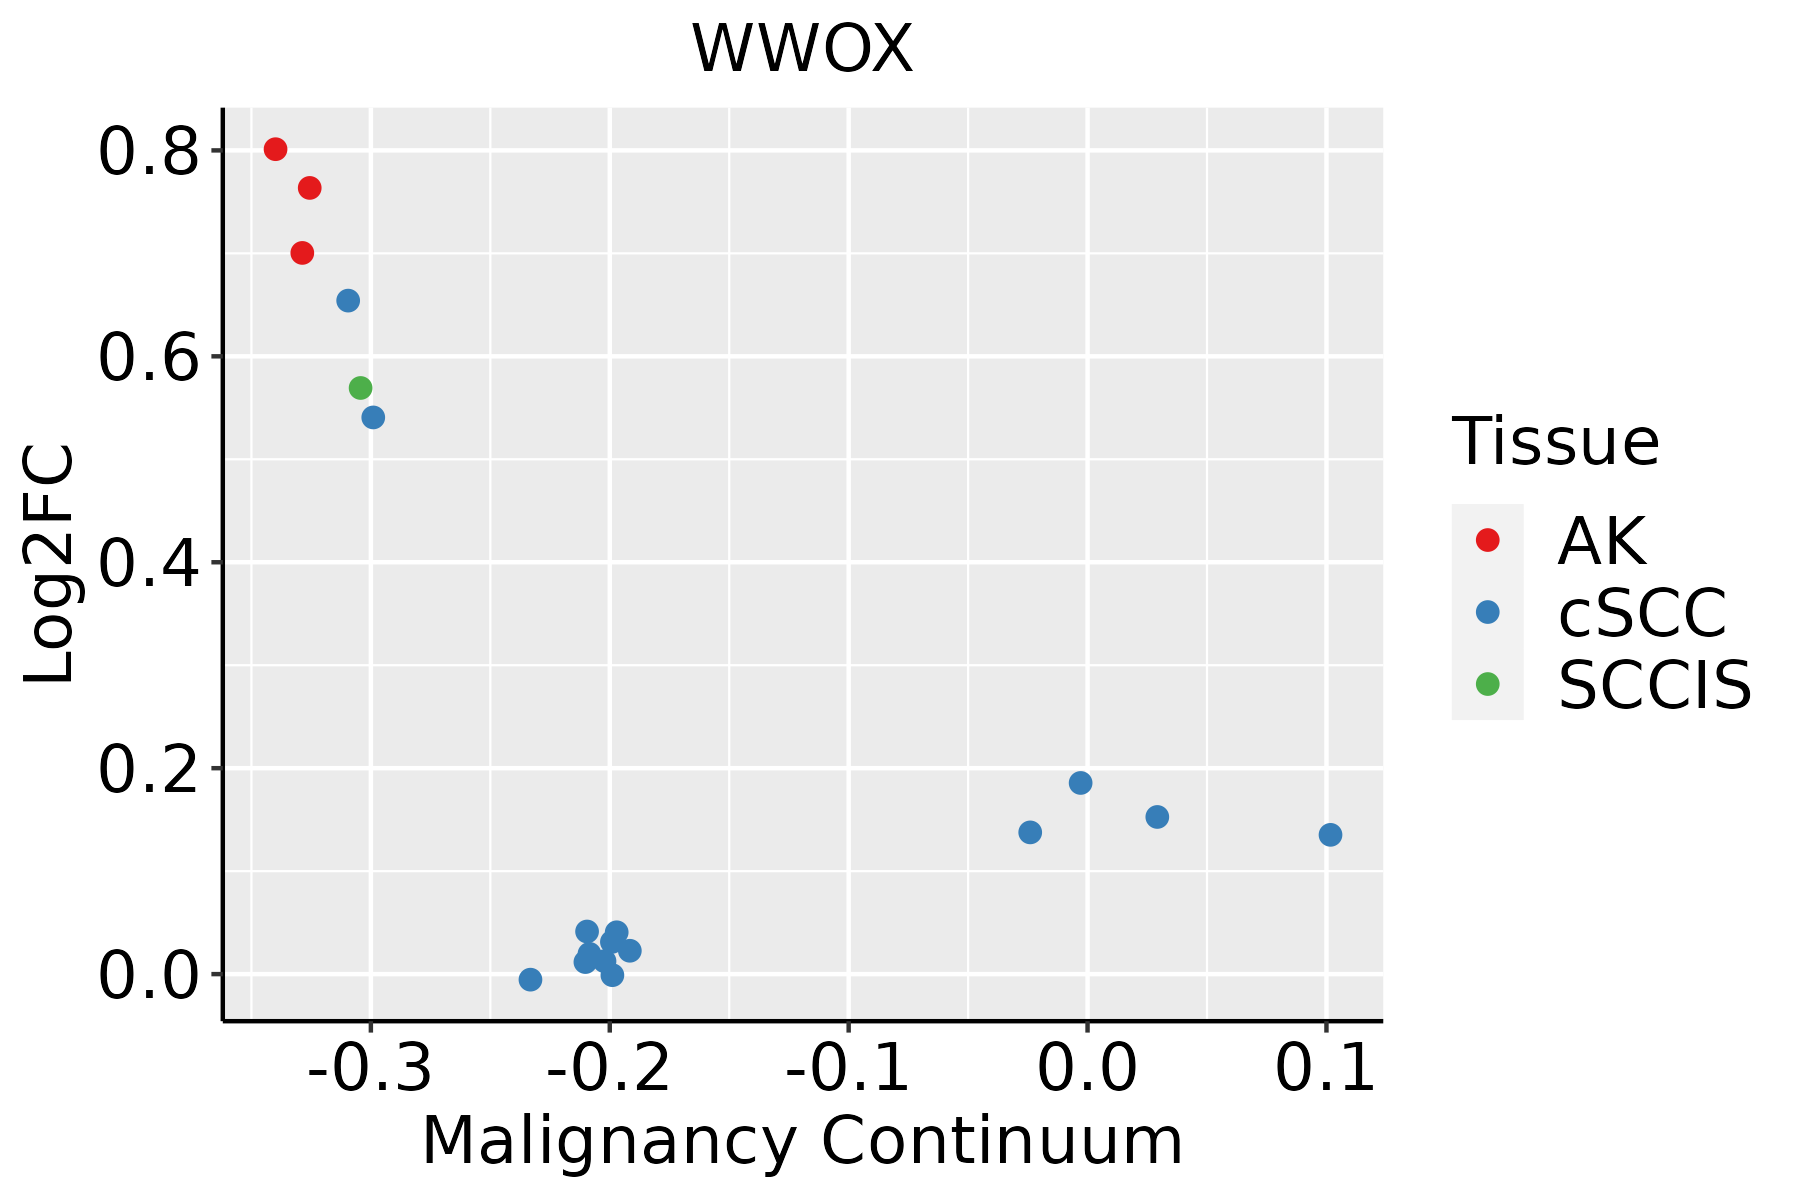 | AK: Actinic keratosis |
| cSCC: Cutaneous squamous cell carcinoma |
| SCCIS:squamous cell carcinoma in situ |
| Thyroid | 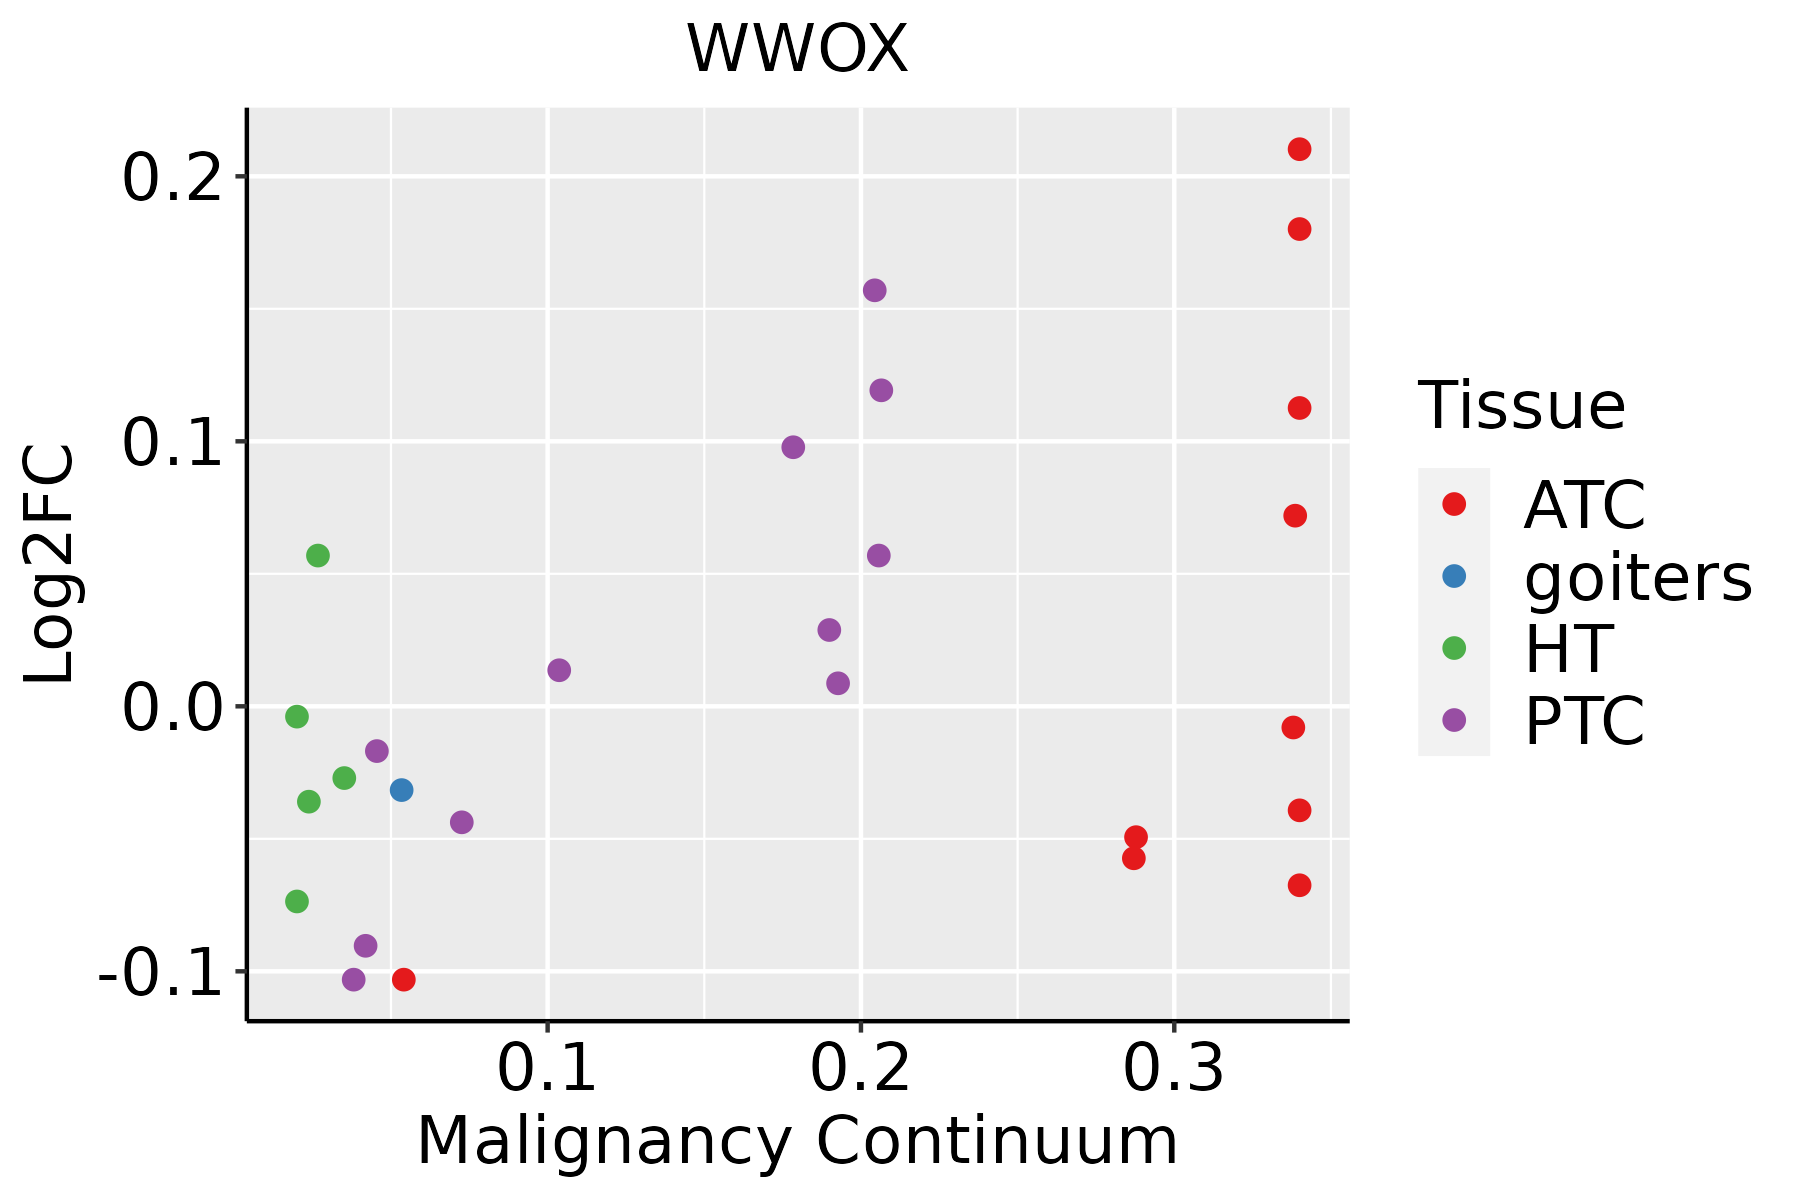 | ATC: Anaplastic thyroid cancer |
| HT: Hashimoto's thyroiditis |
| PTC: Papillary thyroid cancer |
| GO ID | Tissue | Disease Stage | Description | Gene Ratio | Bg Ratio | pvalue | p.adjust | Count |
| GO:009719310 | Cervix | CC | intrinsic apoptotic signaling pathway | 85/2311 | 288/18723 | 4.56e-15 | 6.46e-12 | 85 |
| GO:200123310 | Cervix | CC | regulation of apoptotic signaling pathway | 96/2311 | 356/18723 | 4.08e-14 | 3.05e-11 | 96 |
| GO:00160557 | Cervix | CC | Wnt signaling pathway | 98/2311 | 444/18723 | 4.82e-09 | 4.65e-07 | 98 |
| GO:01987387 | Cervix | CC | cell-cell signaling by wnt | 98/2311 | 446/18723 | 6.16e-09 | 5.58e-07 | 98 |
| GO:00301117 | Cervix | CC | regulation of Wnt signaling pathway | 76/2311 | 328/18723 | 3.05e-08 | 2.08e-06 | 76 |
| GO:20012357 | Cervix | CC | positive regulation of apoptotic signaling pathway | 37/2311 | 126/18723 | 2.70e-07 | 1.12e-05 | 37 |
| GO:009719110 | Cervix | CC | extrinsic apoptotic signaling pathway | 52/2311 | 219/18723 | 2.06e-06 | 6.34e-05 | 52 |
| GO:00723329 | Cervix | CC | intrinsic apoptotic signaling pathway by p53 class mediator | 23/2311 | 76/18723 | 2.76e-05 | 4.60e-04 | 23 |
| GO:200123610 | Cervix | CC | regulation of extrinsic apoptotic signaling pathway | 37/2311 | 151/18723 | 2.80e-05 | 4.65e-04 | 37 |
| GO:007233110 | Cervix | CC | signal transduction by p53 class mediator | 38/2311 | 163/18723 | 7.06e-05 | 9.85e-04 | 38 |
| GO:00016497 | Cervix | CC | osteoblast differentiation | 47/2311 | 229/18723 | 2.88e-04 | 3.11e-03 | 47 |
| GO:00715595 | Cervix | CC | response to transforming growth factor beta | 50/2311 | 256/18723 | 6.31e-04 | 5.91e-03 | 50 |
| GO:00715605 | Cervix | CC | cellular response to transforming growth factor beta stimulus | 49/2311 | 250/18723 | 6.55e-04 | 6.05e-03 | 49 |
| GO:20012386 | Cervix | CC | positive regulation of extrinsic apoptotic signaling pathway | 14/2311 | 48/18723 | 1.48e-03 | 1.15e-02 | 14 |
| GO:00301784 | Cervix | CC | negative regulation of Wnt signaling pathway | 35/2311 | 170/18723 | 1.52e-03 | 1.17e-02 | 35 |
| GO:00015037 | Cervix | CC | ossification | 71/2311 | 408/18723 | 1.67e-03 | 1.28e-02 | 71 |
| GO:0097193 | Colorectum | AD | intrinsic apoptotic signaling pathway | 108/3918 | 288/18723 | 6.25e-11 | 6.41e-09 | 108 |
| GO:2001233 | Colorectum | AD | regulation of apoptotic signaling pathway | 119/3918 | 356/18723 | 2.14e-08 | 1.21e-06 | 119 |
| GO:0030111 | Colorectum | AD | regulation of Wnt signaling pathway | 102/3918 | 328/18723 | 8.51e-06 | 2.03e-04 | 102 |
| GO:0072331 | Colorectum | AD | signal transduction by p53 class mediator | 58/3918 | 163/18723 | 1.04e-05 | 2.40e-04 | 58 |
| Hugo Symbol | Variant Class | Variant Classification | dbSNP RS | HGVSc | HGVSp | HGVSp Short | SWISSPROT | BIOTYPE | SIFT | PolyPhen | Tumor Sample Barcode | Tissue | Histology | Sex | Age | Stage | Therapy Types | Drugs | Outcome |
| WWOX | SNV | Missense_Mutation | novel | c.863N>T | p.Trp288Leu | p.W288L | Q9NZC7 | protein_coding | tolerated(0.18) | benign(0.112) | TCGA-AN-A0AM-01 | Breast | breast invasive carcinoma | Female | <65 | I/II | Unknown | Unknown | SD |
| WWOX | SNV | Missense_Mutation | | c.947T>C | p.Val316Ala | p.V316A | Q9NZC7 | protein_coding | deleterious(0) | possibly_damaging(0.64) | TCGA-D8-A1XK-01 | Breast | breast invasive carcinoma | Female | <65 | I/II | Chemotherapy | doxorubicine+cyclophosphamide | SD |
| WWOX | insertion | In_Frame_Ins | novel | c.1054_1055insTATTATCTT | p.Met352delinsIleLeuSerLeu | p.M352delinsILSL | Q9NZC7 | protein_coding | | | TCGA-AN-A0G0-01 | Breast | breast invasive carcinoma | Female | <65 | I/II | Unknown | Unknown | SD |
| WWOX | insertion | Frame_Shift_Ins | novel | c.1056_1056+1insAACTTCCTGTTGAAGGTTTTGAAAAATATAT | p.Gln353AsnfsTer186 | p.Q353Nfs*186 | Q9NZC7 | protein_coding | | | TCGA-AN-A0G0-01 | Breast | breast invasive carcinoma | Female | <65 | I/II | Unknown | Unknown | SD |
| WWOX | SNV | Missense_Mutation | | c.812C>G | p.Ser271Cys | p.S271C | Q9NZC7 | protein_coding | deleterious(0.01) | benign(0.285) | TCGA-C5-A1BQ-01 | Cervix | cervical & endocervical cancer | Female | >=65 | III/IV | Chemotherapy | cisplatin | CR |
| WWOX | SNV | Missense_Mutation | | c.978N>A | p.Met326Ile | p.M326I | Q9NZC7 | protein_coding | deleterious(0.01) | possibly_damaging(0.718) | TCGA-Q1-A6DT-01 | Cervix | cervical & endocervical cancer | Female | <65 | I/II | Unknown | Unknown | PD |
| WWOX | SNV | Missense_Mutation | | c.944N>A | p.Gly315Glu | p.G315E | Q9NZC7 | protein_coding | deleterious(0) | probably_damaging(0.985) | TCGA-UC-A7PF-01 | Cervix | cervical & endocervical cancer | Female | <65 | I/II | Unknown | Unknown | SD |
| WWOX | SNV | Missense_Mutation | | c.497N>T | p.Ser166Leu | p.S166L | Q9NZC7 | protein_coding | tolerated(0.29) | benign(0.011) | TCGA-AA-3811-01 | Colorectum | colon adenocarcinoma | Female | >=65 | III/IV | Unknown | Unknown | PD |
| WWOX | SNV | Missense_Mutation | rs200815431 | c.1196N>T | p.Ala399Val | p.A399V | Q9NZC7 | protein_coding | tolerated(0.23) | benign(0.014) | TCGA-AA-3854-01 | Colorectum | colon adenocarcinoma | Female | >=65 | I/II | Unknown | Unknown | SD |
| WWOX | SNV | Missense_Mutation | rs764089824 | c.415N>A | p.Glu139Lys | p.E139K | Q9NZC7 | protein_coding | deleterious(0) | probably_damaging(0.919) | TCGA-AA-A00N-01 | Colorectum | colon adenocarcinoma | Male | >=65 | I/II | Unknown | Unknown | PD |


