
|
|||||
|
 | |
| |
| |
| |
| |
| |
|
Gene: WWC3 |
Gene summary for WWC3 |
| Gene information | Species | Human | Gene symbol | WWC3 | Gene ID | 55841 |
| Gene name | WWC family member 3 | |
| Gene Alias | BM042 | |
| Cytomap | Xp22.2 | |
| Gene Type | protein-coding | GO ID | GO:0000122 | UniProtAcc | Q9ULE0 |
Top |
Malignant transformation analysis |
| Identification of the aberrant gene expression in precancerous and cancerous lesions by comparing the gene expression of stem-like cells in diseased tissues with normal stem cells |
| Entrez ID | Symbol | Replicates | Species | Organ | Tissue | Adj P-value | Log2FC | Malignancy |
| 55841 | WWC3 | HCC1_Meng | Human | Liver | HCC | 1.57e-15 | -1.38e-02 | 0.0246 |
| 55841 | WWC3 | HCC2_Meng | Human | Liver | HCC | 5.86e-06 | 2.53e-02 | 0.0107 |
| 55841 | WWC3 | HCC2 | Human | Liver | HCC | 3.43e-10 | 3.06e+00 | 0.5341 |
| 55841 | WWC3 | S027 | Human | Liver | HCC | 9.39e-09 | 6.22e-01 | 0.2446 |
| 55841 | WWC3 | S028 | Human | Liver | HCC | 1.72e-22 | 7.65e-01 | 0.2503 |
| 55841 | WWC3 | S029 | Human | Liver | HCC | 1.59e-13 | 6.35e-01 | 0.2581 |
| 55841 | WWC3 | GSM5252132_BPH389PrGF | Human | Prostate | BPH | 1.16e-08 | 4.72e-01 | -0.2247 |
| 55841 | WWC3 | GSM5252135_BPH511PrPUr_Fcol_3GEX | Human | Prostate | BPH | 7.02e-05 | 2.27e-01 | -0.1833 |
| 55841 | WWC3 | GSM5252136_BPH556PrGA1_Fcol | Human | Prostate | BPH | 5.04e-04 | 2.14e-01 | -0.23 |
| 55841 | WWC3 | GSM5252137_BPH556PrGA2_Fcol | Human | Prostate | BPH | 5.53e-12 | 5.09e-01 | -0.23 |
| 55841 | WWC3 | 048752_1579-all-cells | Human | Prostate | BPH | 4.91e-09 | 3.43e-01 | 0.1008 |
| 55841 | WWC3 | 052095_1628-all-cells | Human | Prostate | BPH | 8.62e-19 | 4.83e-01 | 0.1032 |
| 55841 | WWC3 | 052097_1595-all-cells | Human | Prostate | BPH | 6.02e-08 | 2.70e-01 | 0.0972 |
| 55841 | WWC3 | 052099_1652-all-cells | Human | Prostate | BPH | 2.91e-15 | 4.06e-01 | 0.1038 |
| 55841 | WWC3 | Dong_P1 | Human | Prostate | Tumor | 1.49e-10 | 1.07e-01 | 0.035 |
| 55841 | WWC3 | Dong_P3 | Human | Prostate | Tumor | 2.53e-05 | 1.17e-01 | 0.0278 |
| 55841 | WWC3 | Dong_P5 | Human | Prostate | Tumor | 1.71e-11 | 5.92e-02 | 0.053 |
| 55841 | WWC3 | GSM5353222_PA_PB2B_Pool_1_3_S52_L002 | Human | Prostate | Tumor | 1.08e-03 | 3.93e-01 | 0.1608 |
| 55841 | WWC3 | GSM5353224_PA_PR5186_Pool_1_2_3_S27_L001 | Human | Prostate | Tumor | 2.29e-04 | 4.25e-01 | 0.1621 |
| 55841 | WWC3 | GSM5353227_PA_PR5199-193K_Pool_1_2_3_S55_L002 | Human | Prostate | Tumor | 1.07e-04 | 4.71e-01 | 0.1602 |
| Page: 1 2 |
| Tissue | Expression Dynamics | Abbreviation |
| Liver | 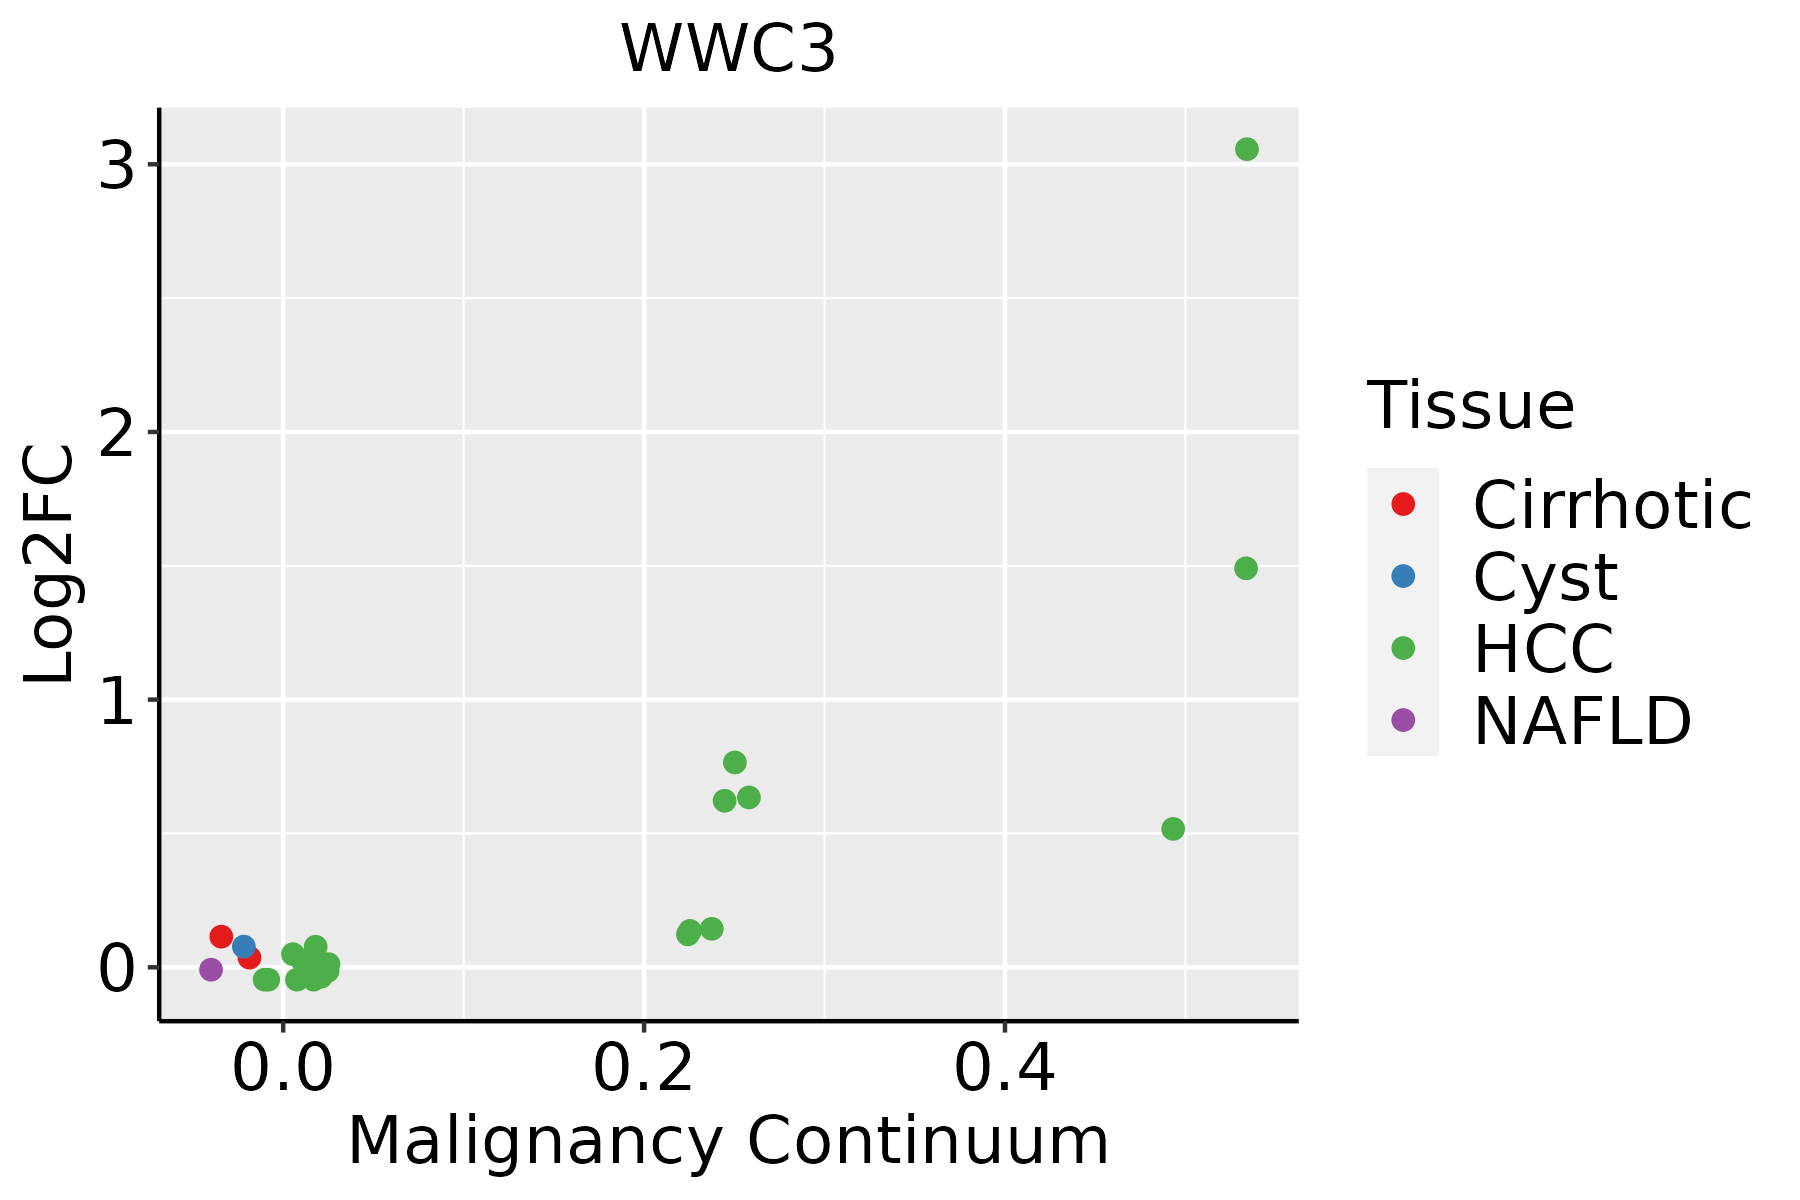 | HCC: Hepatocellular carcinoma |
| NAFLD: Non-alcoholic fatty liver disease | ||
| Prostate | 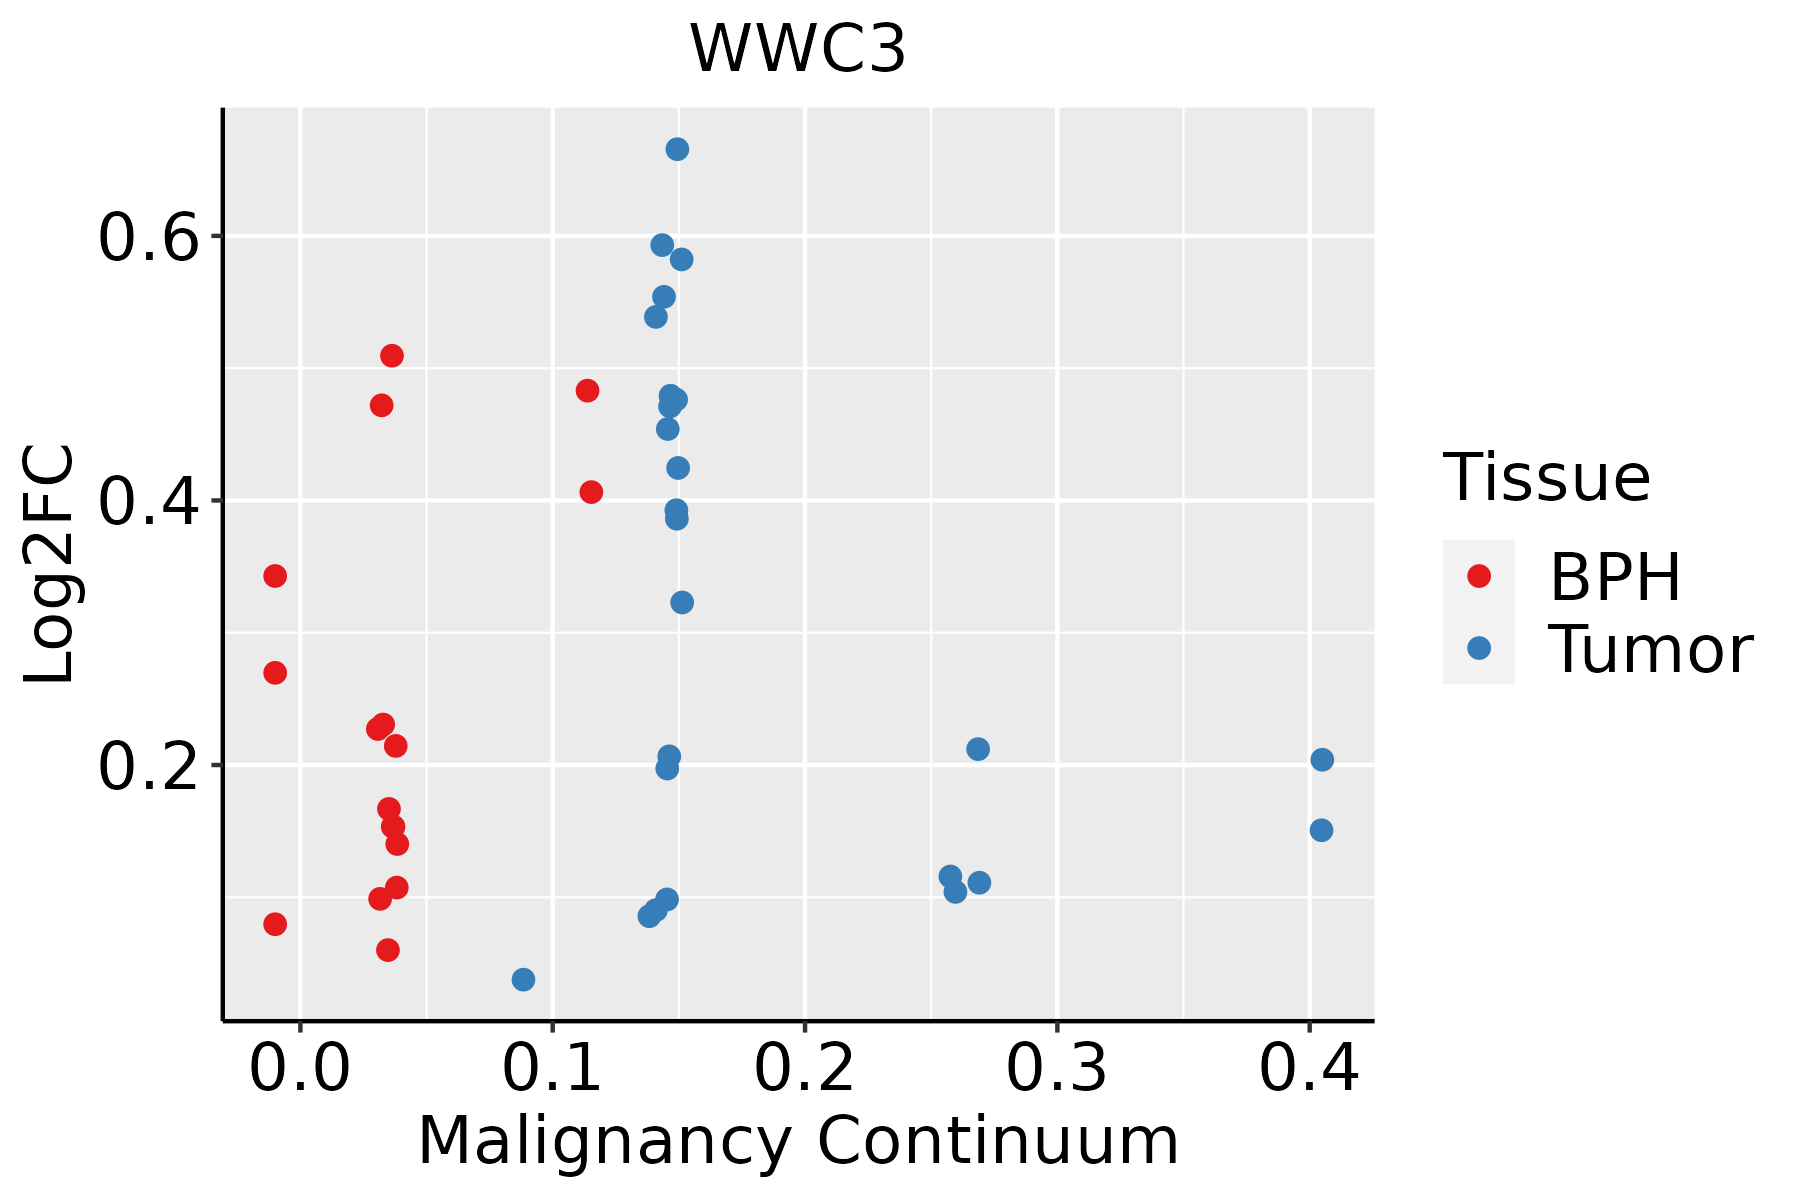 | BPH: Benign Prostatic Hyperplasia |
| Thyroid | 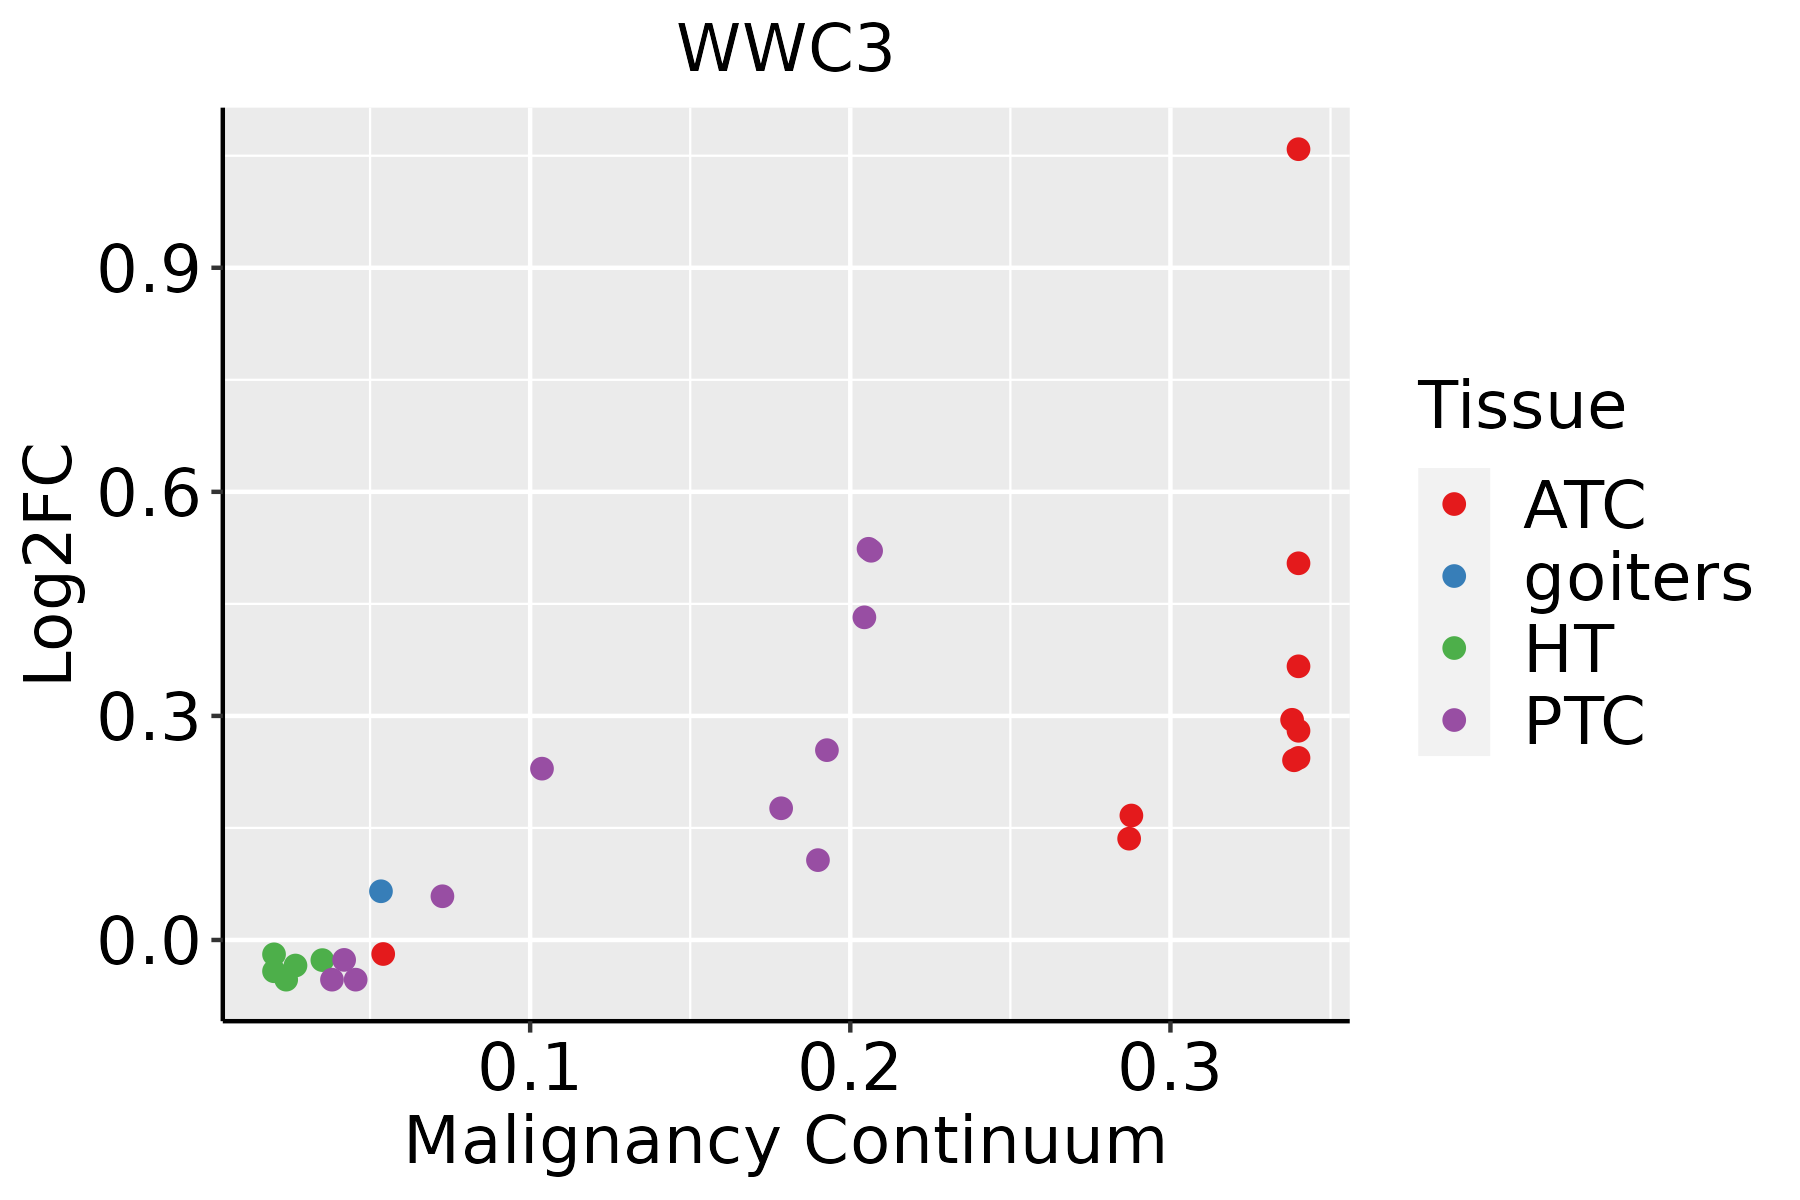 | ATC: Anaplastic thyroid cancer |
| HT: Hashimoto's thyroiditis | ||
| PTC: Papillary thyroid cancer |
| ∗log2FC in expression of this searched gene in stem-like cells from each diseased tissue sample relative to stem-like cells in normal samples in each tissue plotted against the malignancy continuum. Samples are colored based on if they are from different disease stage. |
Top |
Malignant transformation related pathway analysis |
| Find out the enriched GO biological processes and KEGG pathways involved in transition from healthy to precancer to cancer |
| Tissue | Disease Stage | Enriched GO biological Processes |
| Colorectum | AD |  |
| Colorectum | SER |  |
| Colorectum | MSS |  |
| Colorectum | MSI-H |  |
| Colorectum | FAP |  |
| ∗Top 15 enriched GO BP terms are showed in the bar plot of each disease state in each tissue. Each row represents a significant GO biological process which is colored according to the -log10(p.adjust). |
| Page: 1 2 3 4 5 6 7 8 9 |
| GO ID | Tissue | Disease Stage | Description | Gene Ratio | Bg Ratio | pvalue | p.adjust | Count |
| GO:00459263 | Liver | HCC | negative regulation of growth | 129/7958 | 249/18723 | 1.81e-03 | 9.37e-03 | 129 |
| GO:00353312 | Liver | HCC | negative regulation of hippo signaling | 10/7958 | 13/18723 | 1.28e-02 | 4.61e-02 | 10 |
| GO:00459265 | Prostate | BPH | negative regulation of growth | 68/3107 | 249/18723 | 1.26e-05 | 1.69e-04 | 68 |
| GO:00486388 | Prostate | BPH | regulation of developmental growth | 74/3107 | 330/18723 | 3.43e-03 | 1.76e-02 | 74 |
| GO:00353295 | Prostate | BPH | hippo signaling | 14/3107 | 40/18723 | 3.68e-03 | 1.85e-02 | 14 |
| GO:00353314 | Prostate | BPH | negative regulation of hippo signaling | 6/3107 | 13/18723 | 1.24e-02 | 4.94e-02 | 6 |
| GO:004592612 | Prostate | Tumor | negative regulation of growth | 70/3246 | 249/18723 | 1.48e-05 | 2.00e-04 | 70 |
| GO:003532911 | Prostate | Tumor | hippo signaling | 14/3246 | 40/18723 | 5.52e-03 | 2.61e-02 | 14 |
| GO:004863813 | Prostate | Tumor | regulation of developmental growth | 74/3246 | 330/18723 | 1.00e-02 | 4.20e-02 | 74 |
| GO:003532912 | Thyroid | PTC | hippo signaling | 24/5968 | 40/18723 | 2.27e-04 | 1.65e-03 | 24 |
| GO:004592614 | Thyroid | PTC | negative regulation of growth | 105/5968 | 249/18723 | 3.76e-04 | 2.54e-03 | 105 |
| GO:004863810 | Thyroid | PTC | regulation of developmental growth | 127/5968 | 330/18723 | 6.09e-03 | 2.71e-02 | 127 |
| GO:004592622 | Thyroid | ATC | negative regulation of growth | 115/6293 | 249/18723 | 2.34e-05 | 2.06e-04 | 115 |
| GO:003532921 | Thyroid | ATC | hippo signaling | 24/6293 | 40/18723 | 5.54e-04 | 3.20e-03 | 24 |
| GO:004863815 | Thyroid | ATC | regulation of developmental growth | 136/6293 | 330/18723 | 2.17e-03 | 1.02e-02 | 136 |
| GO:00352654 | Thyroid | ATC | organ growth | 77/6293 | 178/18723 | 4.45e-03 | 1.85e-02 | 77 |
| Page: 1 |
| Pathway ID | Tissue | Disease Stage | Description | Gene Ratio | Bg Ratio | pvalue | p.adjust | qvalue | Count |
| Page: 1 |
Top |
Cell-cell communication analysis |
| Identification of potential cell-cell interactions between two cell types and their ligand-receptor pairs for different disease states |
| Ligand | Receptor | LRpair | Pathway | Tissue | Disease Stage |
| Page: 1 |
Top |
Single-cell gene regulatory network inference analysis |
| Find out the significant the regulons (TFs) and the target genes of each regulon across cell types for different disease states |
| TF | Cell Type | Tissue | Disease Stage | Target Gene | RSS | Regulon Activity |
| ∗The dot plots of a searched regulon are shown for all cell subpopulations in each disease state of each tissue based on the regulon specific score inferred using pySCENIC and by calculating the average expression. |
| Page: 1 |
Top |
Somatic mutation of malignant transformation related genes |
| Annotation of somatic variants for genes involved in malignant transformation |
| Hugo Symbol | Variant Class | Variant Classification | dbSNP RS | HGVSc | HGVSp | HGVSp Short | SWISSPROT | BIOTYPE | SIFT | PolyPhen | Tumor Sample Barcode | Tissue | Histology | Sex | Age | Stage | Therapy Types | Drugs | Outcome |
| WWC3 | SNV | Missense_Mutation | c.2687C>G | p.Ser896Trp | p.S896W | Q9ULE0 | protein_coding | deleterious(0) | probably_damaging(0.998) | TCGA-A2-A25E-01 | Breast | breast invasive carcinoma | Female | <65 | III/IV | Chemotherapy | cytoxan | PD | |
| WWC3 | SNV | Missense_Mutation | c.602C>T | p.Ala201Val | p.A201V | Q9ULE0 | protein_coding | tolerated(0.61) | benign(0.075) | TCGA-A8-A09A-01 | Breast | breast invasive carcinoma | Female | <65 | I/II | Hormone Therapy | tamoxiphen | SD | |
| WWC3 | SNV | Missense_Mutation | rs376544629 | c.1301N>T | p.Ser434Leu | p.S434L | Q9ULE0 | protein_coding | tolerated(0.75) | benign(0.007) | TCGA-BH-A0DX-01 | Breast | breast invasive carcinoma | Female | <65 | I/II | Chemotherapy | taxotere | CR |
| WWC3 | SNV | Missense_Mutation | novel | c.605G>A | p.Gly202Asp | p.G202D | Q9ULE0 | protein_coding | tolerated(0.27) | benign(0.079) | TCGA-BH-A0HU-01 | Breast | breast invasive carcinoma | Female | <65 | I/II | Chemotherapy | docetaxel | SD |
| WWC3 | SNV | Missense_Mutation | c.2891N>A | p.Arg964His | p.R964H | Q9ULE0 | protein_coding | deleterious(0) | probably_damaging(0.999) | TCGA-BH-A18G-01 | Breast | breast invasive carcinoma | Female | >=65 | I/II | Unknown | Unknown | SD | |
| WWC3 | SNV | Missense_Mutation | rs371007227 | c.2662N>T | p.Arg888Trp | p.R888W | Q9ULE0 | protein_coding | deleterious(0.01) | benign(0.171) | TCGA-BH-A18P-01 | Breast | breast invasive carcinoma | Female | <65 | I/II | Unknown | Unknown | PD |
| WWC3 | SNV | Missense_Mutation | novel | c.1141N>C | p.Ser381Pro | p.S381P | Q9ULE0 | protein_coding | deleterious(0) | probably_damaging(0.964) | TCGA-BH-A1F6-01 | Breast | breast invasive carcinoma | Female | <65 | III/IV | Unknown | Unknown | SD |
| WWC3 | SNV | Missense_Mutation | c.1798N>A | p.Gly600Arg | p.G600R | Q9ULE0 | protein_coding | tolerated(0.2) | benign(0.01) | TCGA-D8-A1X9-01 | Breast | breast invasive carcinoma | Female | >=65 | I/II | Chemotherapy | adriamycin+cyclophosphamide | SD | |
| WWC3 | deletion | Frame_Shift_Del | c.2678delN | p.Arg894GlufsTer90 | p.R894Efs*90 | Q9ULE0 | protein_coding | TCGA-BH-A0B9-01 | Breast | breast invasive carcinoma | Female | <65 | I/II | Chemotherapy | cyclophosphamide | SD | |||
| WWC3 | deletion | Frame_Shift_Del | c.143delN | p.Gln48ArgfsTer46 | p.Q48Rfs*46 | Q9ULE0 | protein_coding | TCGA-D8-A145-01 | Breast | breast invasive carcinoma | Female | >=65 | I/II | Hormone Therapy | tamoxiphen | SD |
| Page: 1 2 3 4 5 6 7 8 9 10 11 12 13 14 15 16 17 18 |
Top |
Related drugs of malignant transformation related genes |
| Identification of chemicals and drugs interact with genes involved in malignant transfromation |
| (DGIdb 4.0) |
| Entrez ID | Symbol | Category | Interaction Types | Drug Claim Name | Drug Name | PMIDs |
| Page: 1 |

Copyright 2023-Present -The University of Texas Health Science Center at Houston |