
|
|||||
|
 | |
| |
| |
| |
| |
| |
|
Gene: WWC2 |
Gene summary for WWC2 |
| Gene information | Species | Human | Gene symbol | WWC2 | Gene ID | 80014 |
| Gene name | WW and C2 domain containing 2 | |
| Gene Alias | BOMB | |
| Cytomap | 4q35.1 | |
| Gene Type | protein-coding | GO ID | GO:0000122 | UniProtAcc | Q6AWC2 |
Top |
Malignant transformation analysis |
| Identification of the aberrant gene expression in precancerous and cancerous lesions by comparing the gene expression of stem-like cells in diseased tissues with normal stem cells |
| Entrez ID | Symbol | Replicates | Species | Organ | Tissue | Adj P-value | Log2FC | Malignancy |
| 80014 | WWC2 | AEH-subject1 | Human | Endometrium | AEH | 1.37e-06 | 3.78e-01 | -0.3059 |
| 80014 | WWC2 | AEH-subject3 | Human | Endometrium | AEH | 1.98e-06 | 2.68e-01 | -0.2576 |
| 80014 | WWC2 | AEH-subject4 | Human | Endometrium | AEH | 1.31e-08 | 3.85e-01 | -0.2657 |
| 80014 | WWC2 | AEH-subject5 | Human | Endometrium | AEH | 2.77e-29 | 7.64e-01 | -0.2953 |
| 80014 | WWC2 | EEC-subject1 | Human | Endometrium | EEC | 1.14e-19 | 5.62e-01 | -0.2682 |
| 80014 | WWC2 | EEC-subject2 | Human | Endometrium | EEC | 4.62e-04 | 2.32e-01 | -0.2607 |
| 80014 | WWC2 | EEC-subject3 | Human | Endometrium | EEC | 7.80e-03 | 1.80e-01 | -0.2525 |
| 80014 | WWC2 | GSM6177620_NYU_UCEC1_lib1_lib1 | Human | Endometrium | EEC | 1.14e-03 | -4.98e-02 | -0.1869 |
| 80014 | WWC2 | GSM6177620_NYU_UCEC1_lib2_lib2 | Human | Endometrium | EEC | 9.24e-07 | -6.91e-03 | -0.1875 |
| 80014 | WWC2 | GSM6177620_NYU_UCEC1_lib3_lib3 | Human | Endometrium | EEC | 2.15e-04 | -3.96e-02 | -0.1883 |
| 80014 | WWC2 | GSM6177622_NYU_UCEC3_lib1_lib1 | Human | Endometrium | EEC | 1.08e-06 | -3.41e-02 | -0.1917 |
| 80014 | WWC2 | GSM6177622_NYU_UCEC3_lib2_lib2 | Human | Endometrium | EEC | 3.09e-08 | -8.16e-03 | -0.1916 |
| 80014 | WWC2 | LZE24T | Human | Esophagus | ESCC | 1.98e-02 | 2.57e-02 | 0.0596 |
| 80014 | WWC2 | P2T-E | Human | Esophagus | ESCC | 3.33e-19 | 2.79e-01 | 0.1177 |
| 80014 | WWC2 | P8T-E | Human | Esophagus | ESCC | 2.04e-09 | 1.51e-01 | 0.0889 |
| 80014 | WWC2 | P10T-E | Human | Esophagus | ESCC | 1.04e-10 | 1.34e-01 | 0.116 |
| 80014 | WWC2 | P11T-E | Human | Esophagus | ESCC | 1.41e-08 | 3.06e-01 | 0.1426 |
| 80014 | WWC2 | P12T-E | Human | Esophagus | ESCC | 1.19e-19 | 4.66e-01 | 0.1122 |
| 80014 | WWC2 | P15T-E | Human | Esophagus | ESCC | 2.68e-05 | 2.51e-01 | 0.1149 |
| 80014 | WWC2 | P16T-E | Human | Esophagus | ESCC | 1.70e-10 | 1.76e-01 | 0.1153 |
| Page: 1 2 3 4 5 |
| Tissue | Expression Dynamics | Abbreviation |
| Endometrium | 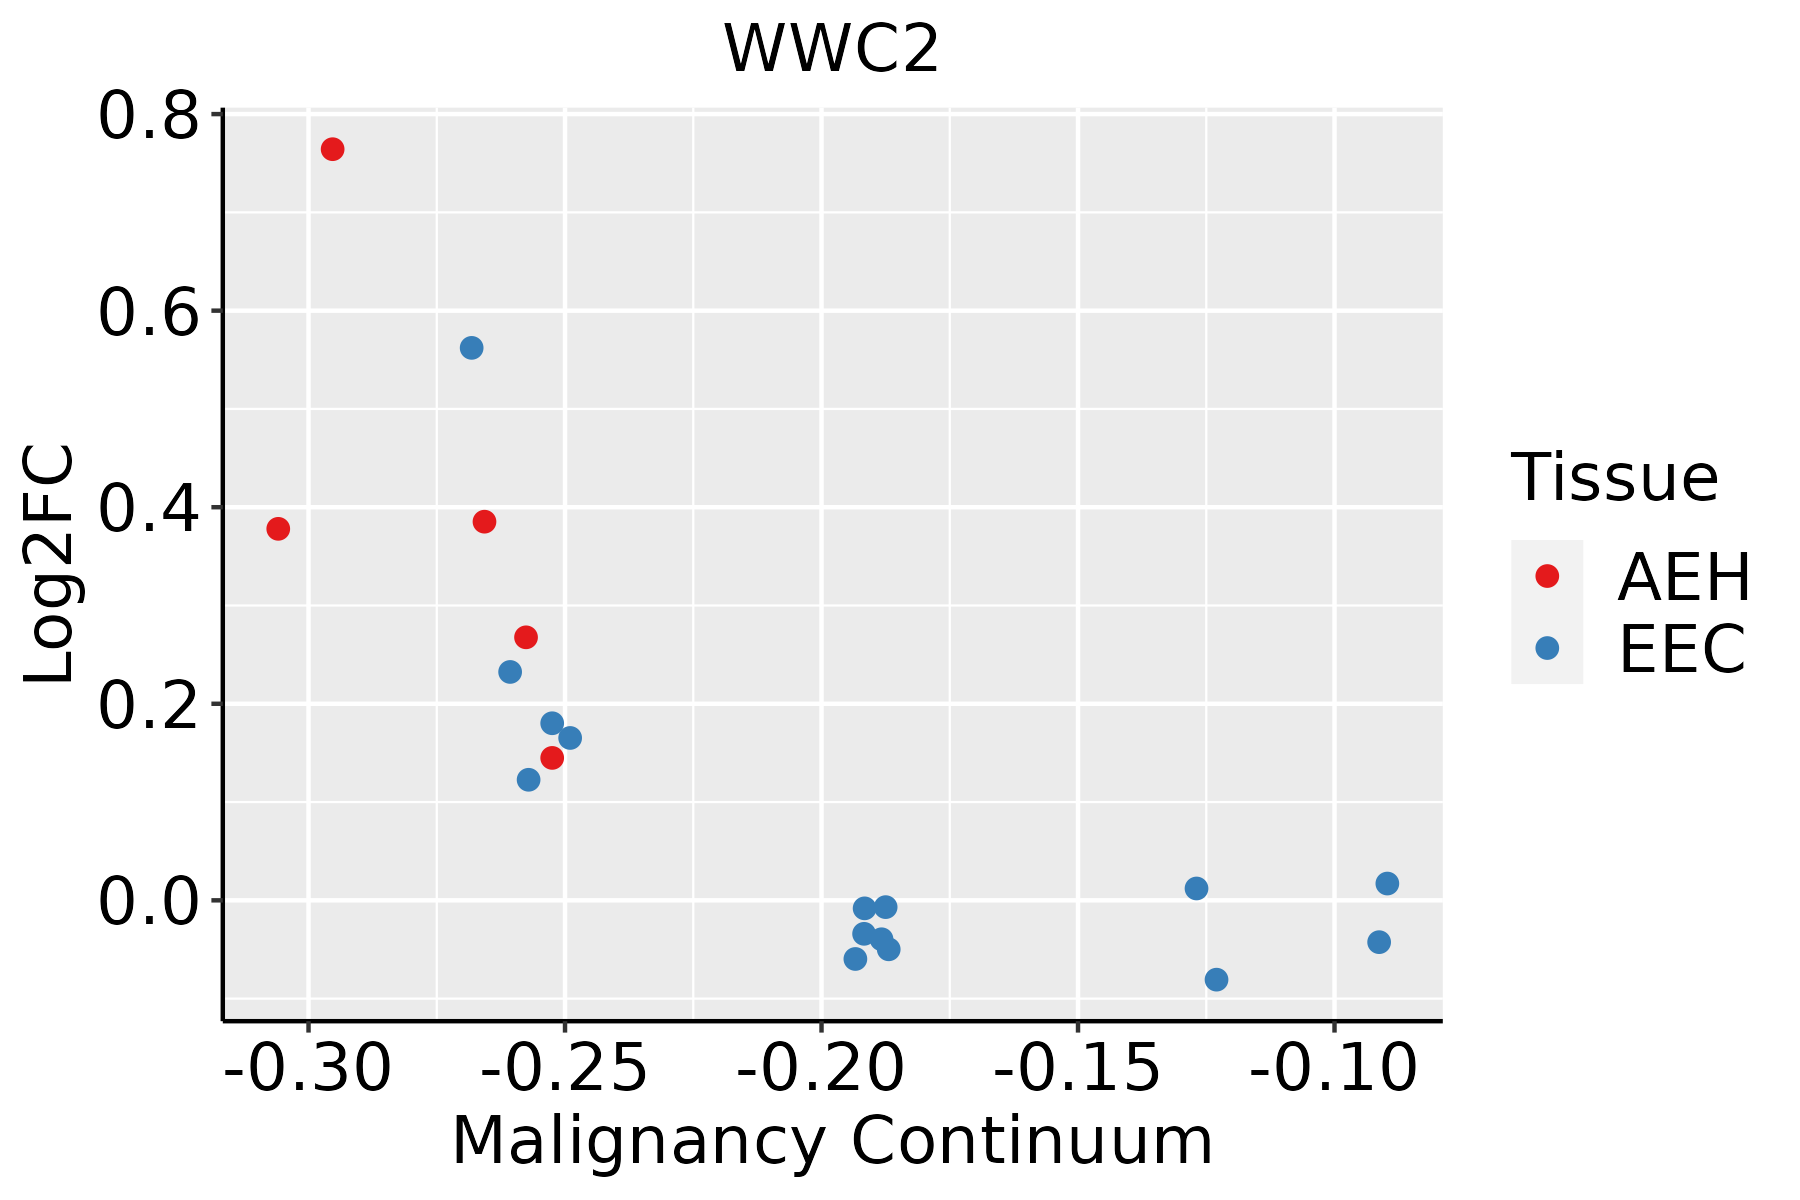 | AEH: Atypical endometrial hyperplasia |
| EEC: Endometrioid Cancer | ||
| Esophagus | 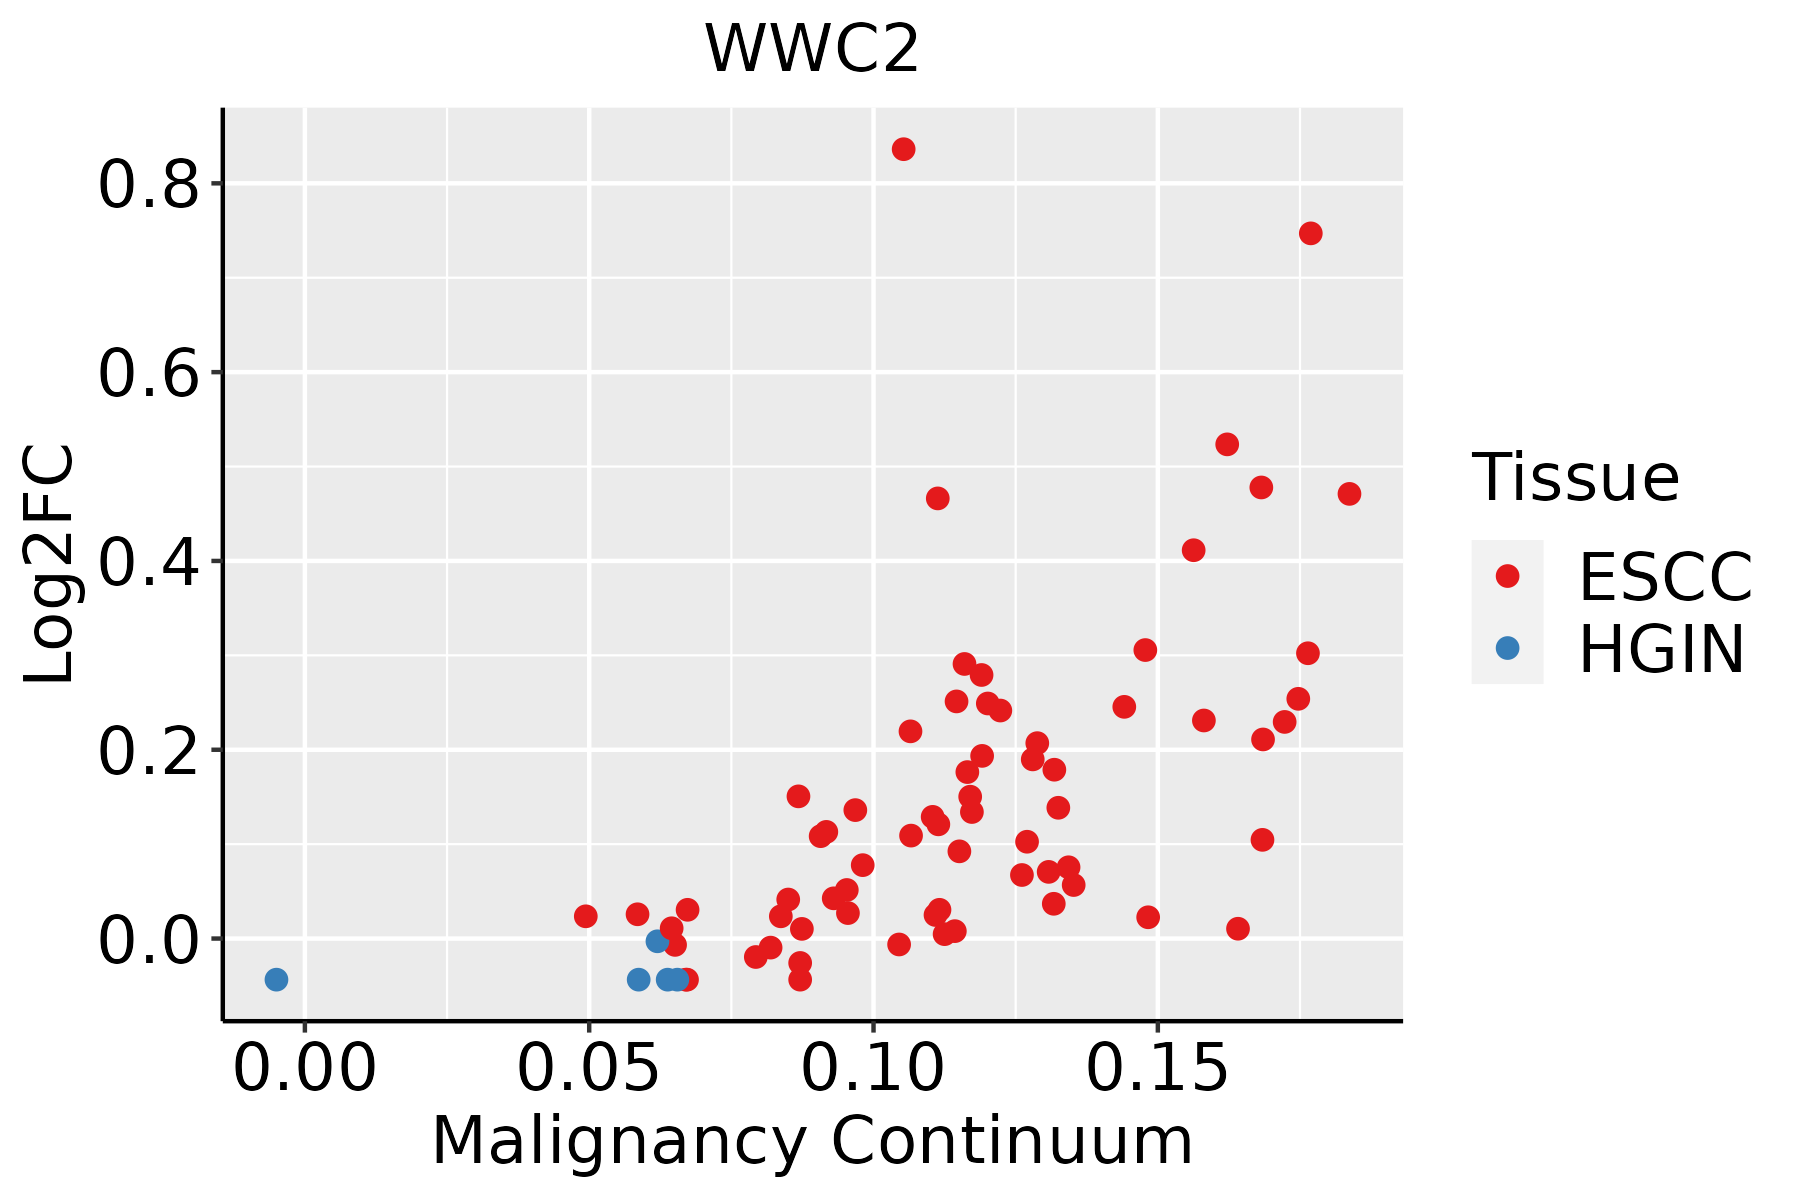 | ESCC: Esophageal squamous cell carcinoma |
| HGIN: High-grade intraepithelial neoplasias | ||
| LGIN: Low-grade intraepithelial neoplasias | ||
| Liver | 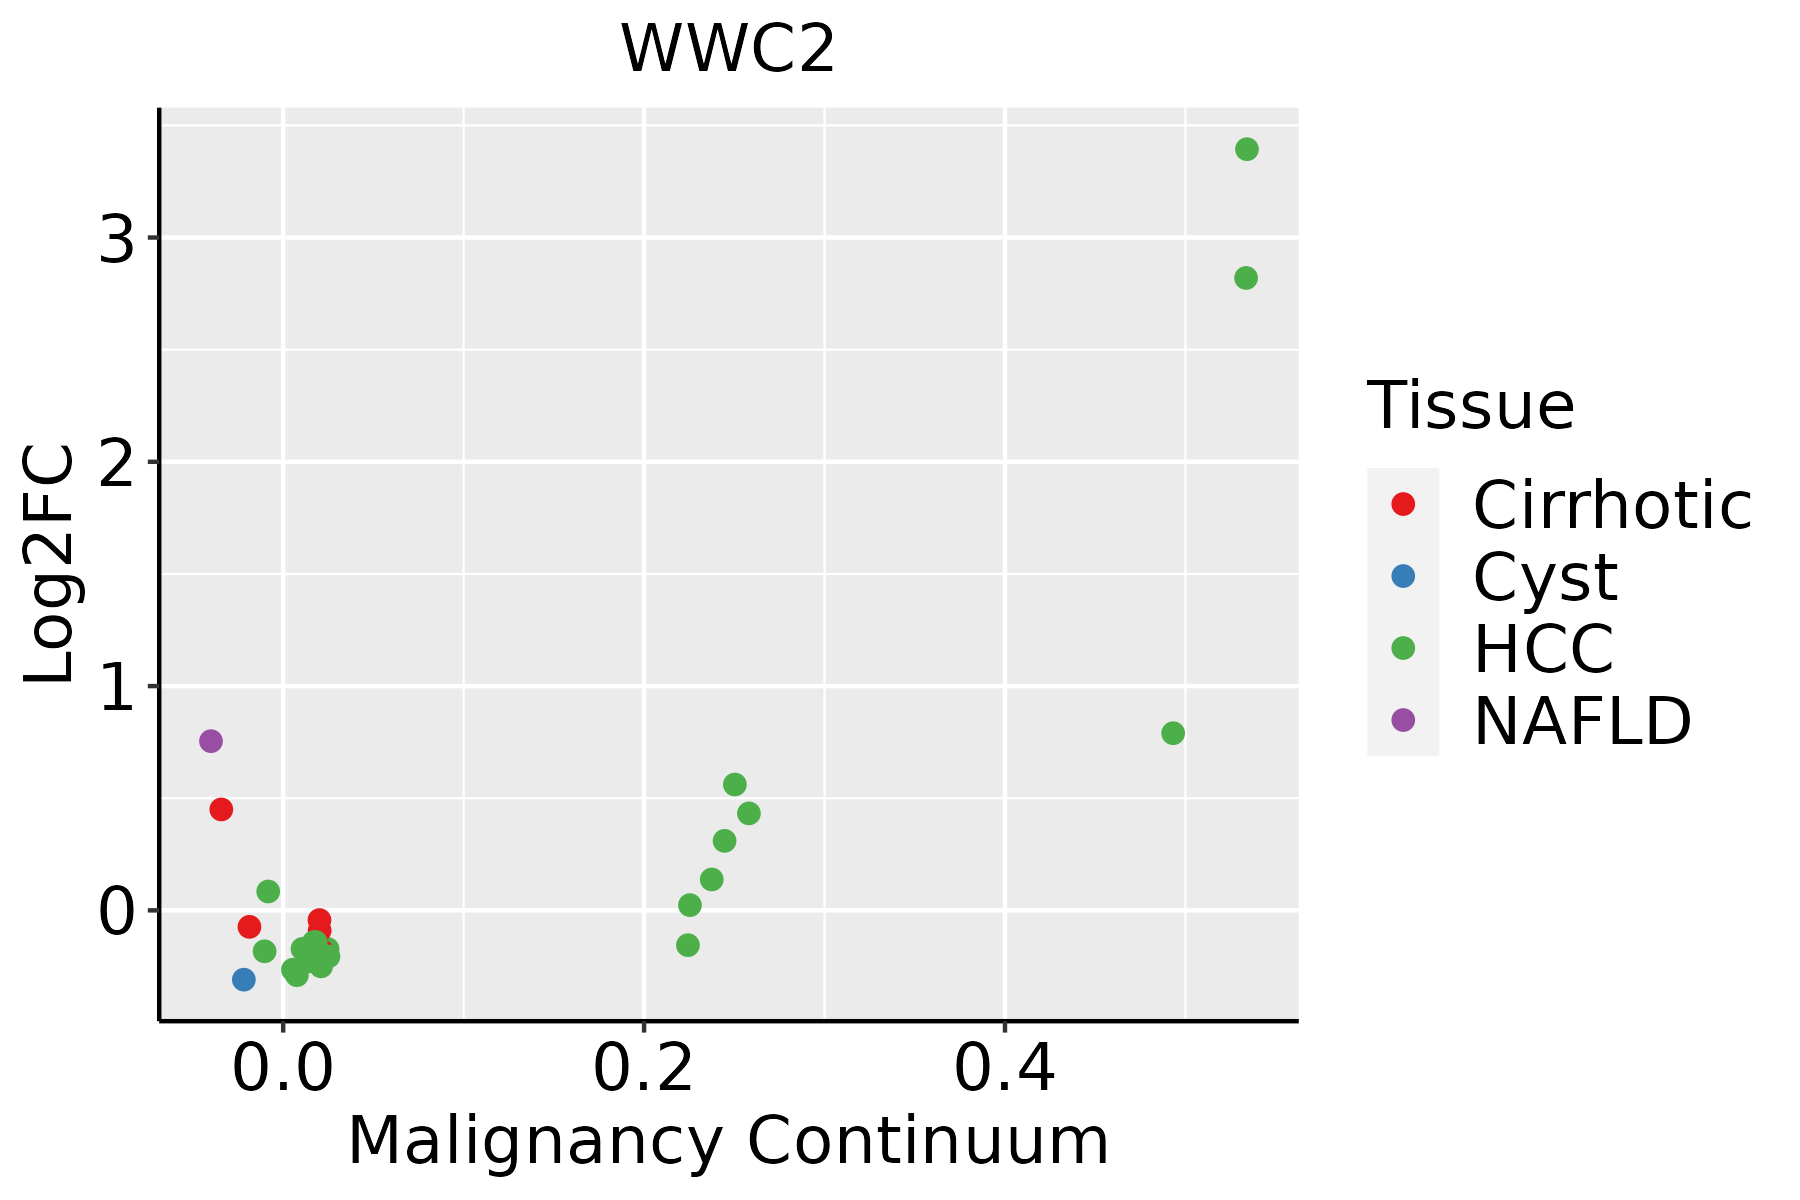 | HCC: Hepatocellular carcinoma |
| NAFLD: Non-alcoholic fatty liver disease | ||
| Lung |  | AAH: Atypical adenomatous hyperplasia |
| AIS: Adenocarcinoma in situ | ||
| IAC: Invasive lung adenocarcinoma | ||
| MIA: Minimally invasive adenocarcinoma | ||
| Thyroid | 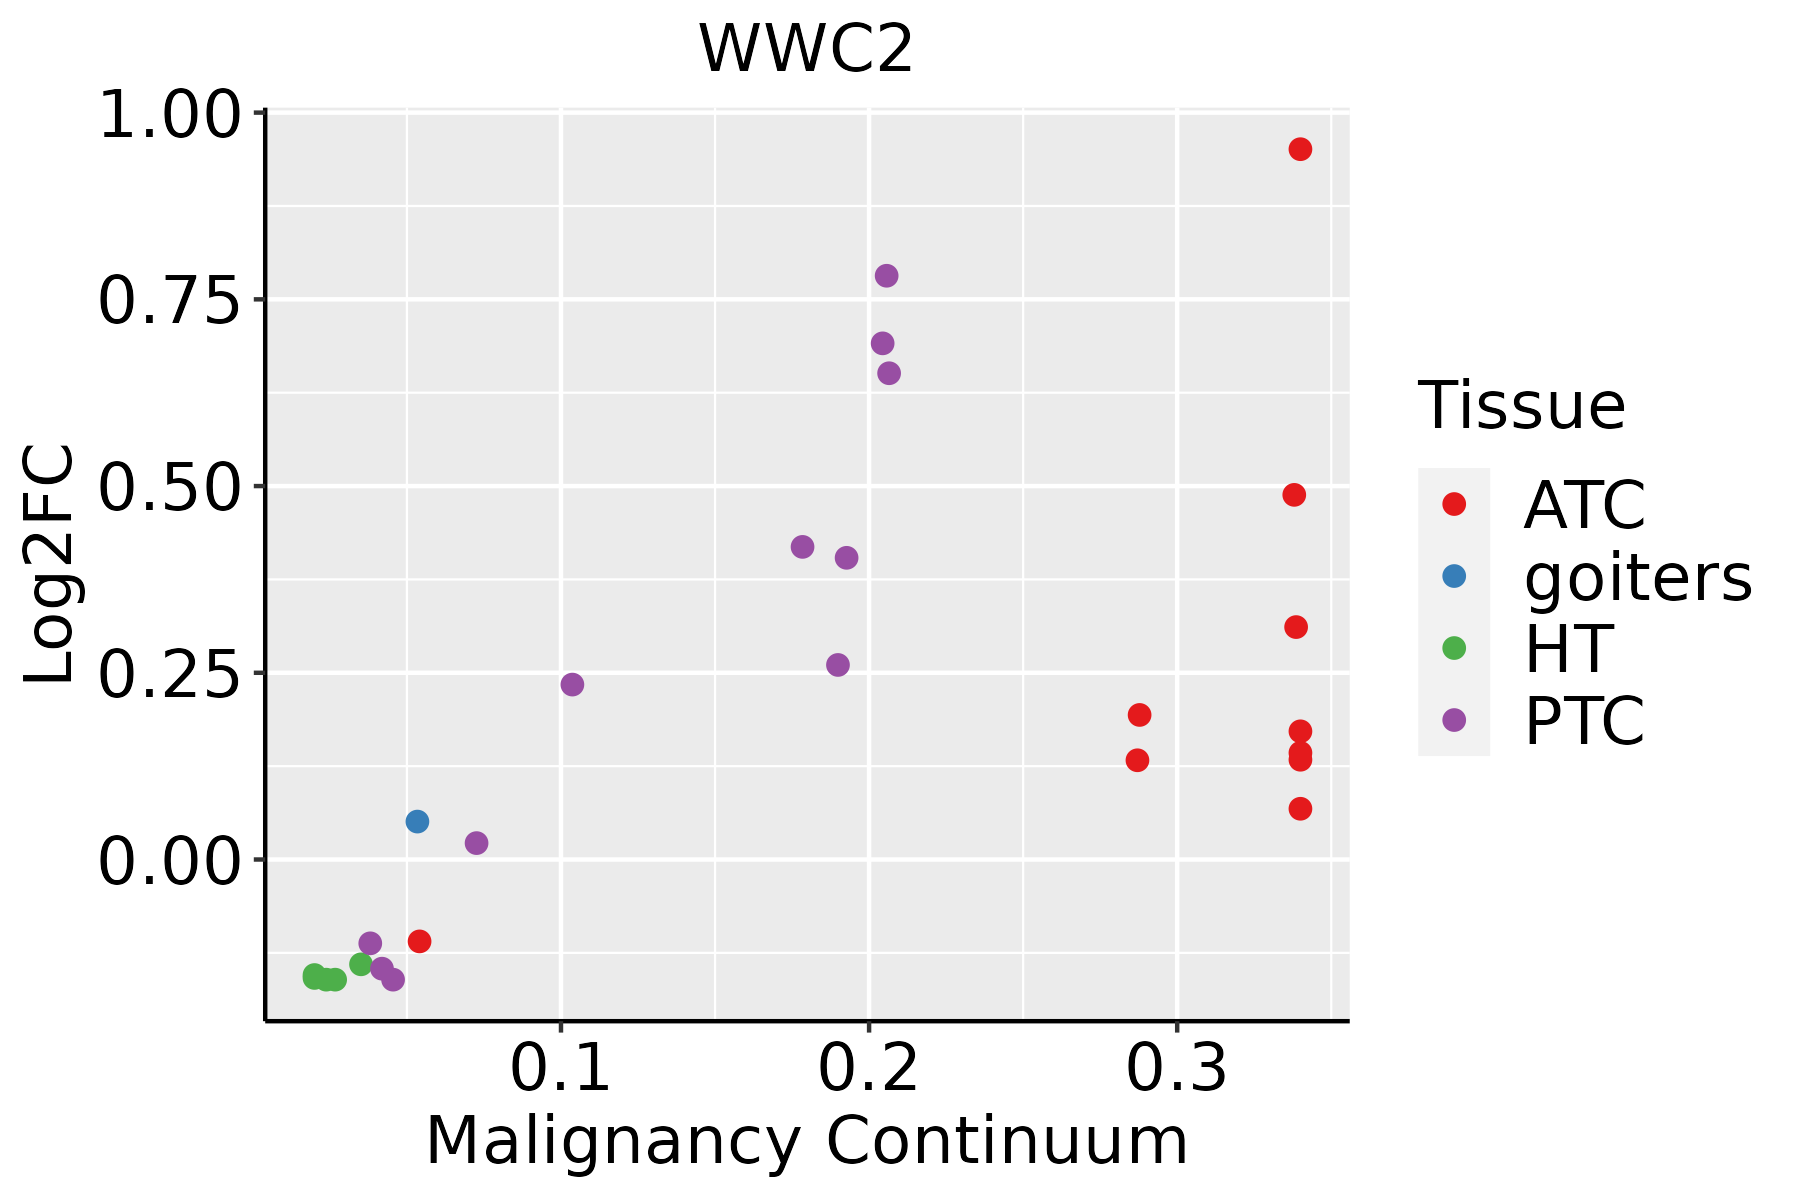 | ATC: Anaplastic thyroid cancer |
| HT: Hashimoto's thyroiditis | ||
| PTC: Papillary thyroid cancer |
| ∗log2FC in expression of this searched gene in stem-like cells from each diseased tissue sample relative to stem-like cells in normal samples in each tissue plotted against the malignancy continuum. Samples are colored based on if they are from different disease stage. |
Top |
Malignant transformation related pathway analysis |
| Find out the enriched GO biological processes and KEGG pathways involved in transition from healthy to precancer to cancer |
| Tissue | Disease Stage | Enriched GO biological Processes |
| Colorectum | AD |  |
| Colorectum | SER |  |
| Colorectum | MSS |  |
| Colorectum | MSI-H |  |
| Colorectum | FAP |  |
| ∗Top 15 enriched GO BP terms are showed in the bar plot of each disease state in each tissue. Each row represents a significant GO biological process which is colored according to the -log10(p.adjust). |
| Page: 1 2 3 4 5 6 7 8 9 |
| GO ID | Tissue | Disease Stage | Description | Gene Ratio | Bg Ratio | pvalue | p.adjust | Count |
| GO:00459264 | Endometrium | AEH | negative regulation of growth | 47/2100 | 249/18723 | 2.36e-04 | 2.84e-03 | 47 |
| GO:00486387 | Endometrium | AEH | regulation of developmental growth | 58/2100 | 330/18723 | 3.45e-04 | 3.80e-03 | 58 |
| GO:0035265 | Endometrium | AEH | organ growth | 33/2100 | 178/18723 | 2.53e-03 | 1.87e-02 | 33 |
| GO:004592611 | Endometrium | EEC | negative regulation of growth | 48/2168 | 249/18723 | 2.58e-04 | 2.98e-03 | 48 |
| GO:004863812 | Endometrium | EEC | regulation of developmental growth | 58/2168 | 330/18723 | 7.65e-04 | 7.16e-03 | 58 |
| GO:00352651 | Endometrium | EEC | organ growth | 32/2168 | 178/18723 | 7.54e-03 | 4.22e-02 | 32 |
| GO:00459267 | Esophagus | ESCC | negative regulation of growth | 148/8552 | 249/18723 | 7.88e-06 | 7.73e-05 | 148 |
| GO:00353297 | Esophagus | ESCC | hippo signaling | 26/8552 | 40/18723 | 1.08e-02 | 3.66e-02 | 26 |
| GO:0035329 | Liver | NAFLD | hippo signaling | 10/1882 | 40/18723 | 5.20e-03 | 4.05e-02 | 10 |
| GO:00486384 | Liver | NAFLD | regulation of developmental growth | 48/1882 | 330/18723 | 5.74e-03 | 4.37e-02 | 48 |
| GO:0035331 | Liver | NAFLD | negative regulation of hippo signaling | 5/1882 | 13/18723 | 6.58e-03 | 4.69e-02 | 5 |
| GO:00353311 | Liver | Cirrhotic | negative regulation of hippo signaling | 8/4634 | 13/18723 | 5.27e-03 | 2.70e-02 | 8 |
| GO:00459263 | Liver | HCC | negative regulation of growth | 129/7958 | 249/18723 | 1.81e-03 | 9.37e-03 | 129 |
| GO:00353312 | Liver | HCC | negative regulation of hippo signaling | 10/7958 | 13/18723 | 1.28e-02 | 4.61e-02 | 10 |
| GO:00486385 | Lung | IAC | regulation of developmental growth | 59/2061 | 330/18723 | 1.17e-04 | 2.22e-03 | 59 |
| GO:00353313 | Lung | IAC | negative regulation of hippo signaling | 6/2061 | 13/18723 | 1.53e-03 | 1.62e-02 | 6 |
| GO:00353293 | Lung | IAC | hippo signaling | 11/2061 | 40/18723 | 3.13e-03 | 2.75e-02 | 11 |
| GO:0035330 | Lung | IAC | regulation of hippo signaling | 7/2061 | 21/18723 | 5.59e-03 | 4.12e-02 | 7 |
| GO:004863811 | Lung | AIS | regulation of developmental growth | 55/1849 | 330/18723 | 7.63e-05 | 1.95e-03 | 55 |
| GO:00353291 | Lung | AIS | hippo signaling | 10/1849 | 40/18723 | 4.59e-03 | 4.03e-02 | 10 |
| Page: 1 2 |
| Pathway ID | Tissue | Disease Stage | Description | Gene Ratio | Bg Ratio | pvalue | p.adjust | qvalue | Count |
| Page: 1 |
Top |
Cell-cell communication analysis |
| Identification of potential cell-cell interactions between two cell types and their ligand-receptor pairs for different disease states |
| Ligand | Receptor | LRpair | Pathway | Tissue | Disease Stage |
| Page: 1 |
Top |
Single-cell gene regulatory network inference analysis |
| Find out the significant the regulons (TFs) and the target genes of each regulon across cell types for different disease states |
| TF | Cell Type | Tissue | Disease Stage | Target Gene | RSS | Regulon Activity |
| ∗The dot plots of a searched regulon are shown for all cell subpopulations in each disease state of each tissue based on the regulon specific score inferred using pySCENIC and by calculating the average expression. |
| Page: 1 |
Top |
Somatic mutation of malignant transformation related genes |
| Annotation of somatic variants for genes involved in malignant transformation |
| Hugo Symbol | Variant Class | Variant Classification | dbSNP RS | HGVSc | HGVSp | HGVSp Short | SWISSPROT | BIOTYPE | SIFT | PolyPhen | Tumor Sample Barcode | Tissue | Histology | Sex | Age | Stage | Therapy Types | Drugs | Outcome |
| WWC2 | SNV | Missense_Mutation | novel | c.1873G>A | p.Glu625Lys | p.E625K | Q6AWC2 | protein_coding | tolerated(0.18) | benign(0) | TCGA-A2-A25A-01 | Breast | breast invasive carcinoma | Female | <65 | I/II | Unspecific | Cytoxan | SD |
| WWC2 | SNV | Missense_Mutation | c.2852N>A | p.Arg951Lys | p.R951K | Q6AWC2 | protein_coding | tolerated(1) | benign(0.003) | TCGA-A8-A09M-01 | Breast | breast invasive carcinoma | Female | >=65 | III/IV | Chemotherapy | paclitaxel | CR | |
| WWC2 | SNV | Missense_Mutation | c.1402N>A | p.Glu468Lys | p.E468K | Q6AWC2 | protein_coding | deleterious(0) | benign(0.048) | TCGA-AR-A1AJ-01 | Breast | breast invasive carcinoma | Female | >=65 | I/II | Unknown | Unknown | SD | |
| WWC2 | SNV | Missense_Mutation | novel | c.2876N>T | p.Pro959Leu | p.P959L | Q6AWC2 | protein_coding | tolerated(0.07) | benign(0.003) | TCGA-BH-A0BD-01 | Breast | breast invasive carcinoma | Female | <65 | I/II | Chemotherapy | doxorubicin | SD |
| WWC2 | insertion | Nonsense_Mutation | rs758531535 | c.2674_2675insGTAGAACAGAAATATA | p.Asp892GlyfsTer6 | p.D892Gfs*6 | Q6AWC2 | protein_coding | TCGA-A1-A0SM-01 | Breast | breast invasive carcinoma | Male | >=65 | I/II | Unknown | Unknown | SD | ||
| WWC2 | deletion | Frame_Shift_Del | novel | c.1960delN | p.Thr655ProfsTer24 | p.T655Pfs*24 | Q6AWC2 | protein_coding | TCGA-D8-A27V-01 | Breast | breast invasive carcinoma | Female | <65 | I/II | Hormone Therapy | tamoxiphen | SD | ||
| WWC2 | SNV | Missense_Mutation | novel | c.2754G>T | p.Glu918Asp | p.E918D | Q6AWC2 | protein_coding | tolerated(0.47) | benign(0.101) | TCGA-2W-A8YY-01 | Cervix | cervical & endocervical cancer | Female | <65 | I/II | Chemotherapy | cisplatin | CR |
| WWC2 | SNV | Missense_Mutation | novel | c.765N>C | p.Leu255Phe | p.L255F | Q6AWC2 | protein_coding | tolerated(0.43) | possibly_damaging(0.499) | TCGA-C5-A2LZ-01 | Cervix | cervical & endocervical cancer | Female | >=65 | III/IV | Unknown | Unknown | PD |
| WWC2 | SNV | Missense_Mutation | novel | c.1756G>A | p.Glu586Lys | p.E586K | Q6AWC2 | protein_coding | deleterious(0.04) | benign(0.086) | TCGA-C5-A7X5-01 | Cervix | cervical & endocervical cancer | Female | >=65 | I/II | Chemotherapy | carboplatin | PD |
| WWC2 | SNV | Missense_Mutation | novel | c.2512N>C | p.Glu838Gln | p.E838Q | Q6AWC2 | protein_coding | tolerated(0.19) | benign(0.203) | TCGA-EA-A3HS-01 | Cervix | cervical & endocervical cancer | Female | <65 | I/II | Unknown | Unknown | SD |
| Page: 1 2 3 4 5 6 7 8 9 10 11 12 |
Top |
Related drugs of malignant transformation related genes |
| Identification of chemicals and drugs interact with genes involved in malignant transfromation |
| (DGIdb 4.0) |
| Entrez ID | Symbol | Category | Interaction Types | Drug Claim Name | Drug Name | PMIDs |
| Page: 1 |

Copyright 2023-Present -The University of Texas Health Science Center at Houston |