
|
|||||
|
 | |
| |
| |
| |
| |
| |
|
Gene: WWC1 |
Gene summary for WWC1 |
| Gene information | Species | Human | Gene symbol | WWC1 | Gene ID | 23286 |
| Gene name | WW and C2 domain containing 1 | |
| Gene Alias | HBEBP3 | |
| Cytomap | 5q34 | |
| Gene Type | protein-coding | GO ID | GO:0000122 | UniProtAcc | Q8IX03 |
Top |
Malignant transformation analysis |
| Identification of the aberrant gene expression in precancerous and cancerous lesions by comparing the gene expression of stem-like cells in diseased tissues with normal stem cells |
| Entrez ID | Symbol | Replicates | Species | Organ | Tissue | Adj P-value | Log2FC | Malignancy |
| 23286 | WWC1 | CCI_2 | Human | Cervix | CC | 1.33e-05 | 8.65e-01 | 0.5249 |
| 23286 | WWC1 | CCI_3 | Human | Cervix | CC | 1.97e-03 | 5.04e-01 | 0.516 |
| 23286 | WWC1 | H2 | Human | Cervix | HSIL_HPV | 2.74e-05 | 2.41e-01 | 0.0632 |
| 23286 | WWC1 | AEH-subject1 | Human | Endometrium | AEH | 2.36e-30 | 7.61e-01 | -0.3059 |
| 23286 | WWC1 | AEH-subject2 | Human | Endometrium | AEH | 2.04e-09 | 4.44e-01 | -0.2525 |
| 23286 | WWC1 | AEH-subject3 | Human | Endometrium | AEH | 8.07e-15 | 5.19e-01 | -0.2576 |
| 23286 | WWC1 | AEH-subject4 | Human | Endometrium | AEH | 1.86e-06 | 4.01e-01 | -0.2657 |
| 23286 | WWC1 | AEH-subject5 | Human | Endometrium | AEH | 8.81e-39 | 9.30e-01 | -0.2953 |
| 23286 | WWC1 | EEC-subject1 | Human | Endometrium | EEC | 1.80e-31 | 8.98e-01 | -0.2682 |
| 23286 | WWC1 | EEC-subject2 | Human | Endometrium | EEC | 7.09e-15 | 5.51e-01 | -0.2607 |
| 23286 | WWC1 | EEC-subject3 | Human | Endometrium | EEC | 1.29e-08 | 4.49e-01 | -0.2525 |
| 23286 | WWC1 | EEC-subject4 | Human | Endometrium | EEC | 1.68e-17 | 5.90e-01 | -0.2571 |
| 23286 | WWC1 | EEC-subject5 | Human | Endometrium | EEC | 1.68e-18 | 5.35e-01 | -0.249 |
| 23286 | WWC1 | GSM6177620_NYU_UCEC1_lib2_lib2 | Human | Endometrium | EEC | 1.04e-02 | 5.62e-02 | -0.1875 |
| 23286 | WWC1 | GSM6177622_NYU_UCEC3_lib1_lib1 | Human | Endometrium | EEC | 8.33e-07 | 1.67e-01 | -0.1917 |
| 23286 | WWC1 | S43 | Human | Liver | Cirrhotic | 3.18e-10 | -1.37e-01 | -0.0187 |
| 23286 | WWC1 | HCC1_Meng | Human | Liver | HCC | 8.07e-37 | -2.06e-01 | 0.0246 |
| 23286 | WWC1 | HCC2_Meng | Human | Liver | HCC | 1.84e-18 | -1.16e-01 | 0.0107 |
| 23286 | WWC1 | cirrhotic2 | Human | Liver | Cirrhotic | 1.70e-02 | -8.23e-02 | 0.0201 |
| 23286 | WWC1 | cirrhotic3 | Human | Liver | Cirrhotic | 2.86e-02 | -1.03e-01 | 0.0215 |
| Page: 1 2 3 4 5 |
| Tissue | Expression Dynamics | Abbreviation |
| Cervix | 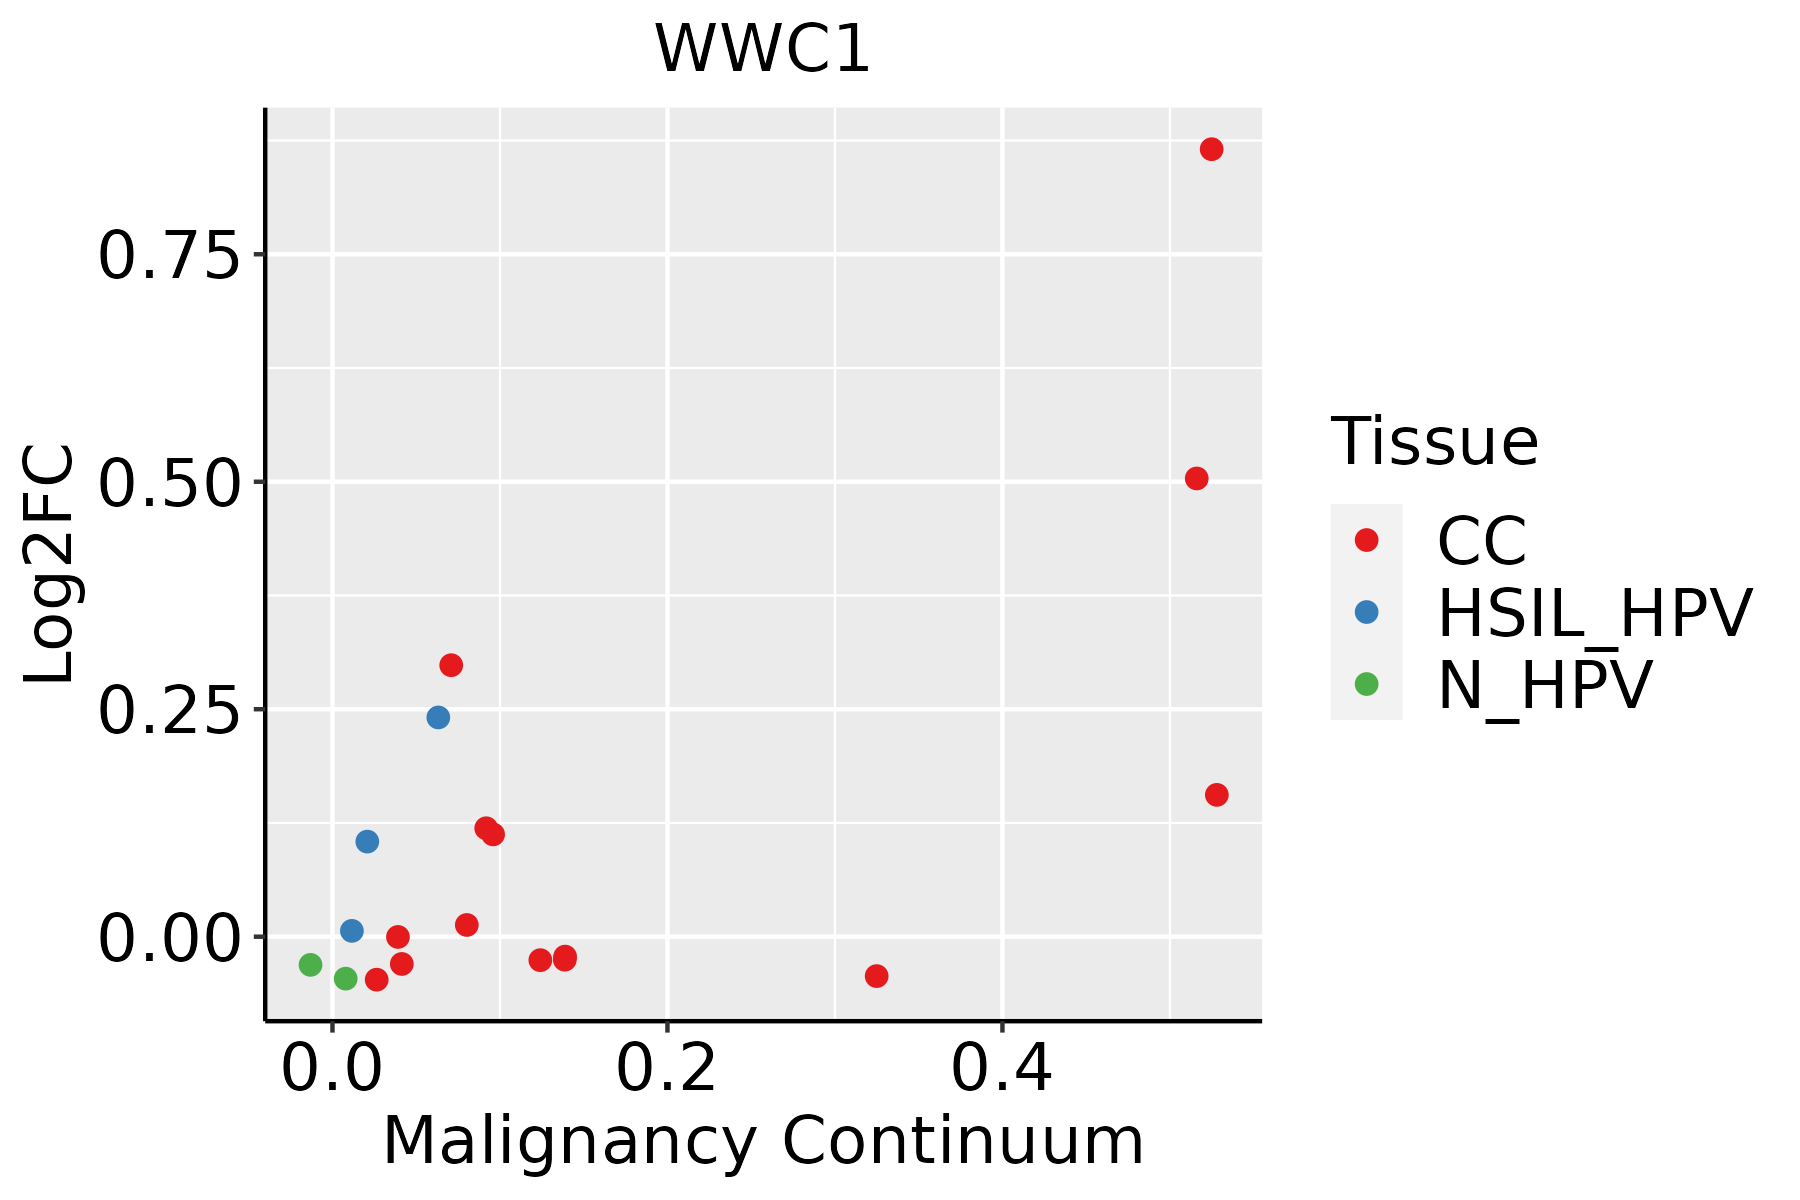 | CC: Cervix cancer |
| HSIL_HPV: HPV-infected high-grade squamous intraepithelial lesions | ||
| N_HPV: HPV-infected normal cervix | ||
| Endometrium | 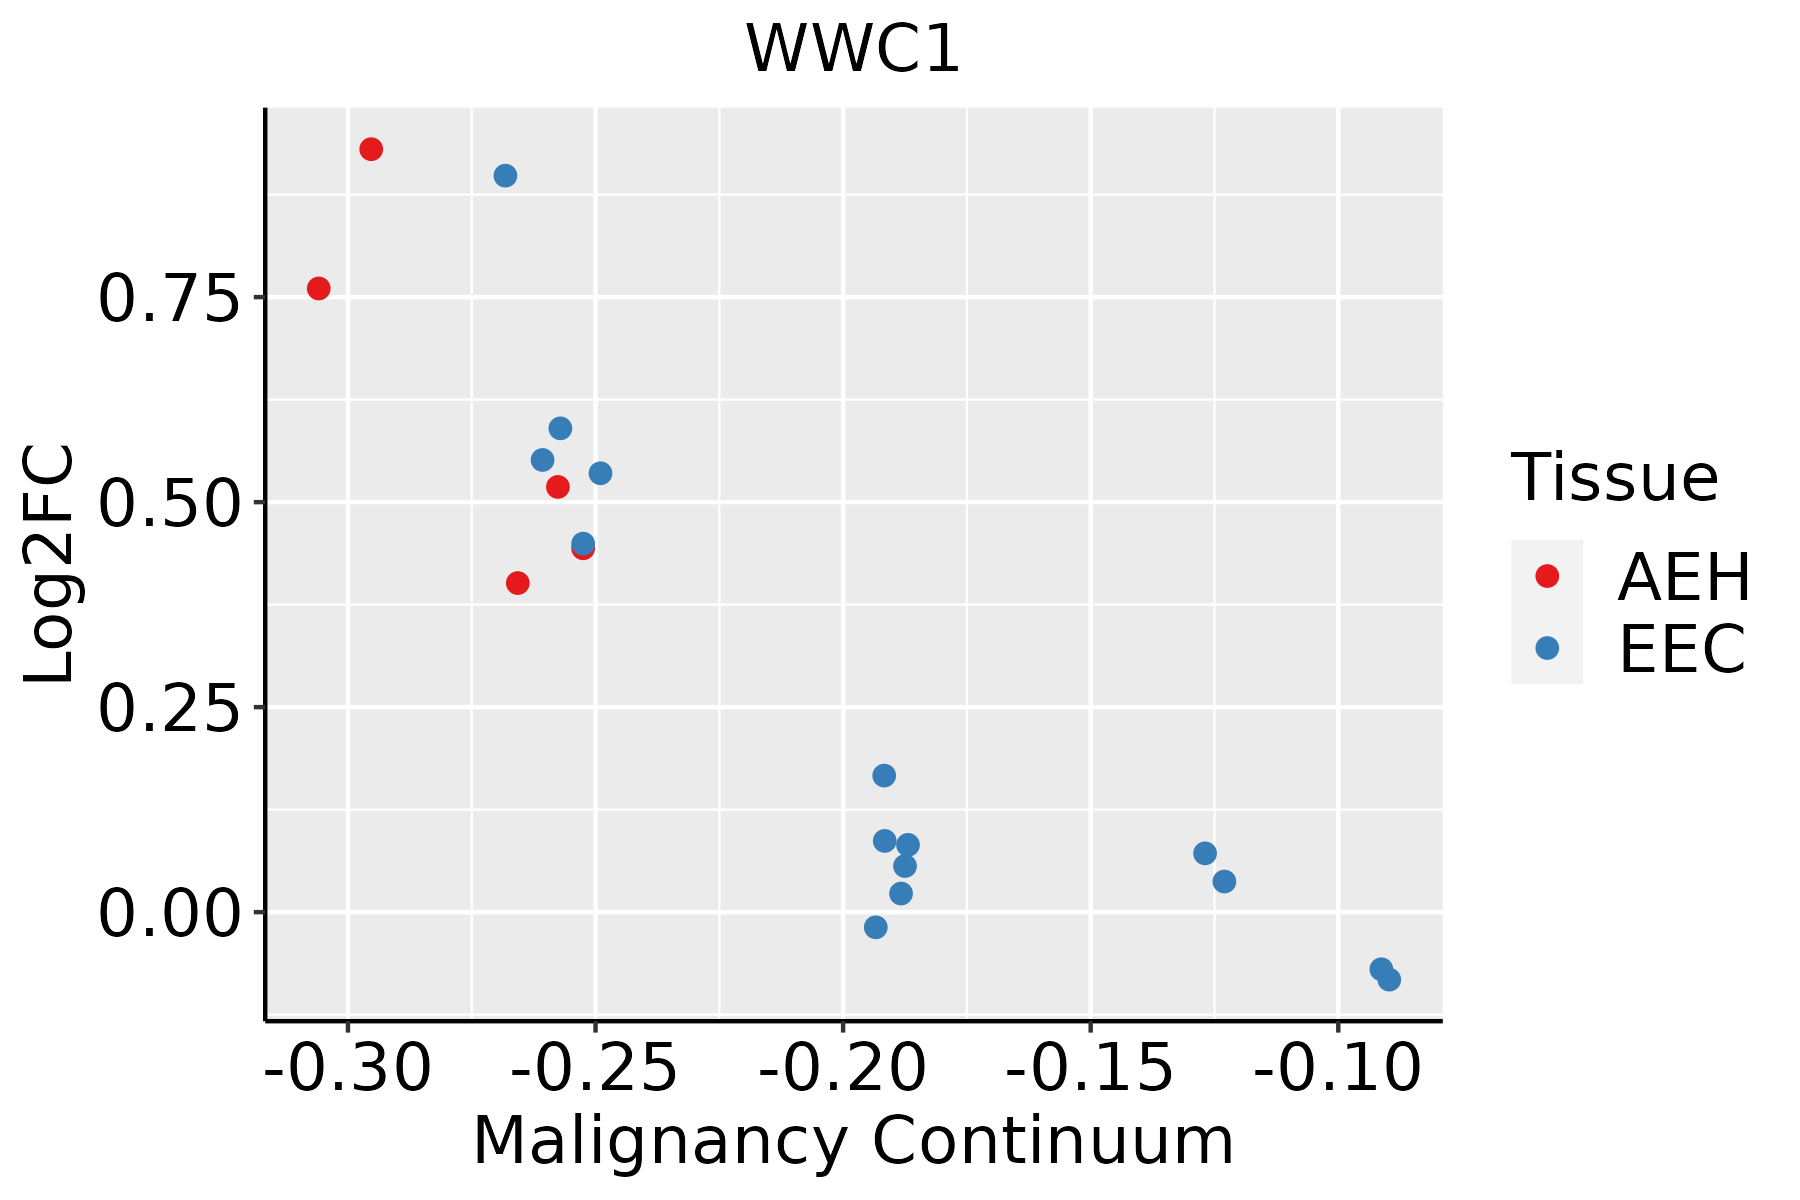 | AEH: Atypical endometrial hyperplasia |
| EEC: Endometrioid Cancer | ||
| GC |  | CAG: Chronic atrophic gastritis |
| CAG with IM: Chronic atrophic gastritis with intestinal metaplasia | ||
| CSG: Chronic superficial gastritis | ||
| GC: Gastric cancer | ||
| SIM: Severe intestinal metaplasia | ||
| WIM: Wild intestinal metaplasia | ||
| Liver | 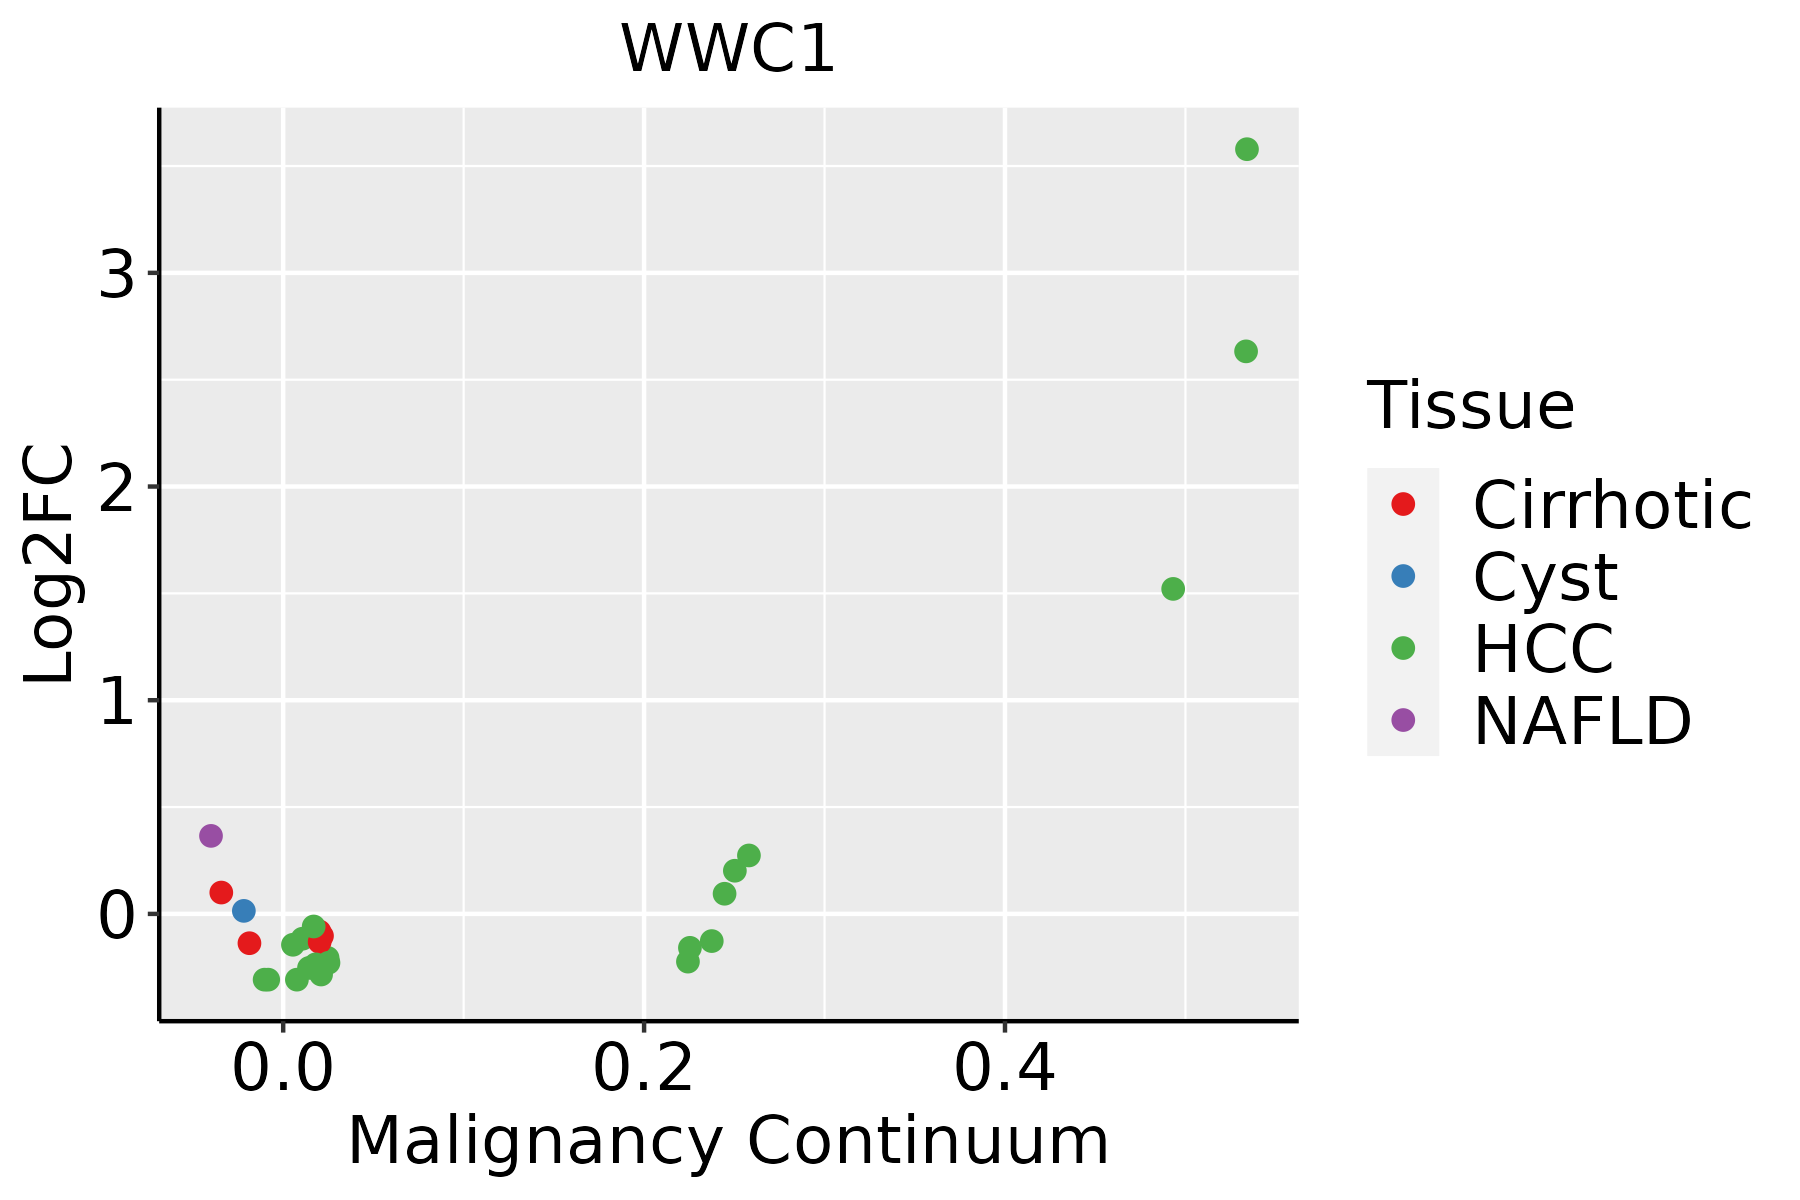 | HCC: Hepatocellular carcinoma |
| NAFLD: Non-alcoholic fatty liver disease | ||
| Lung | 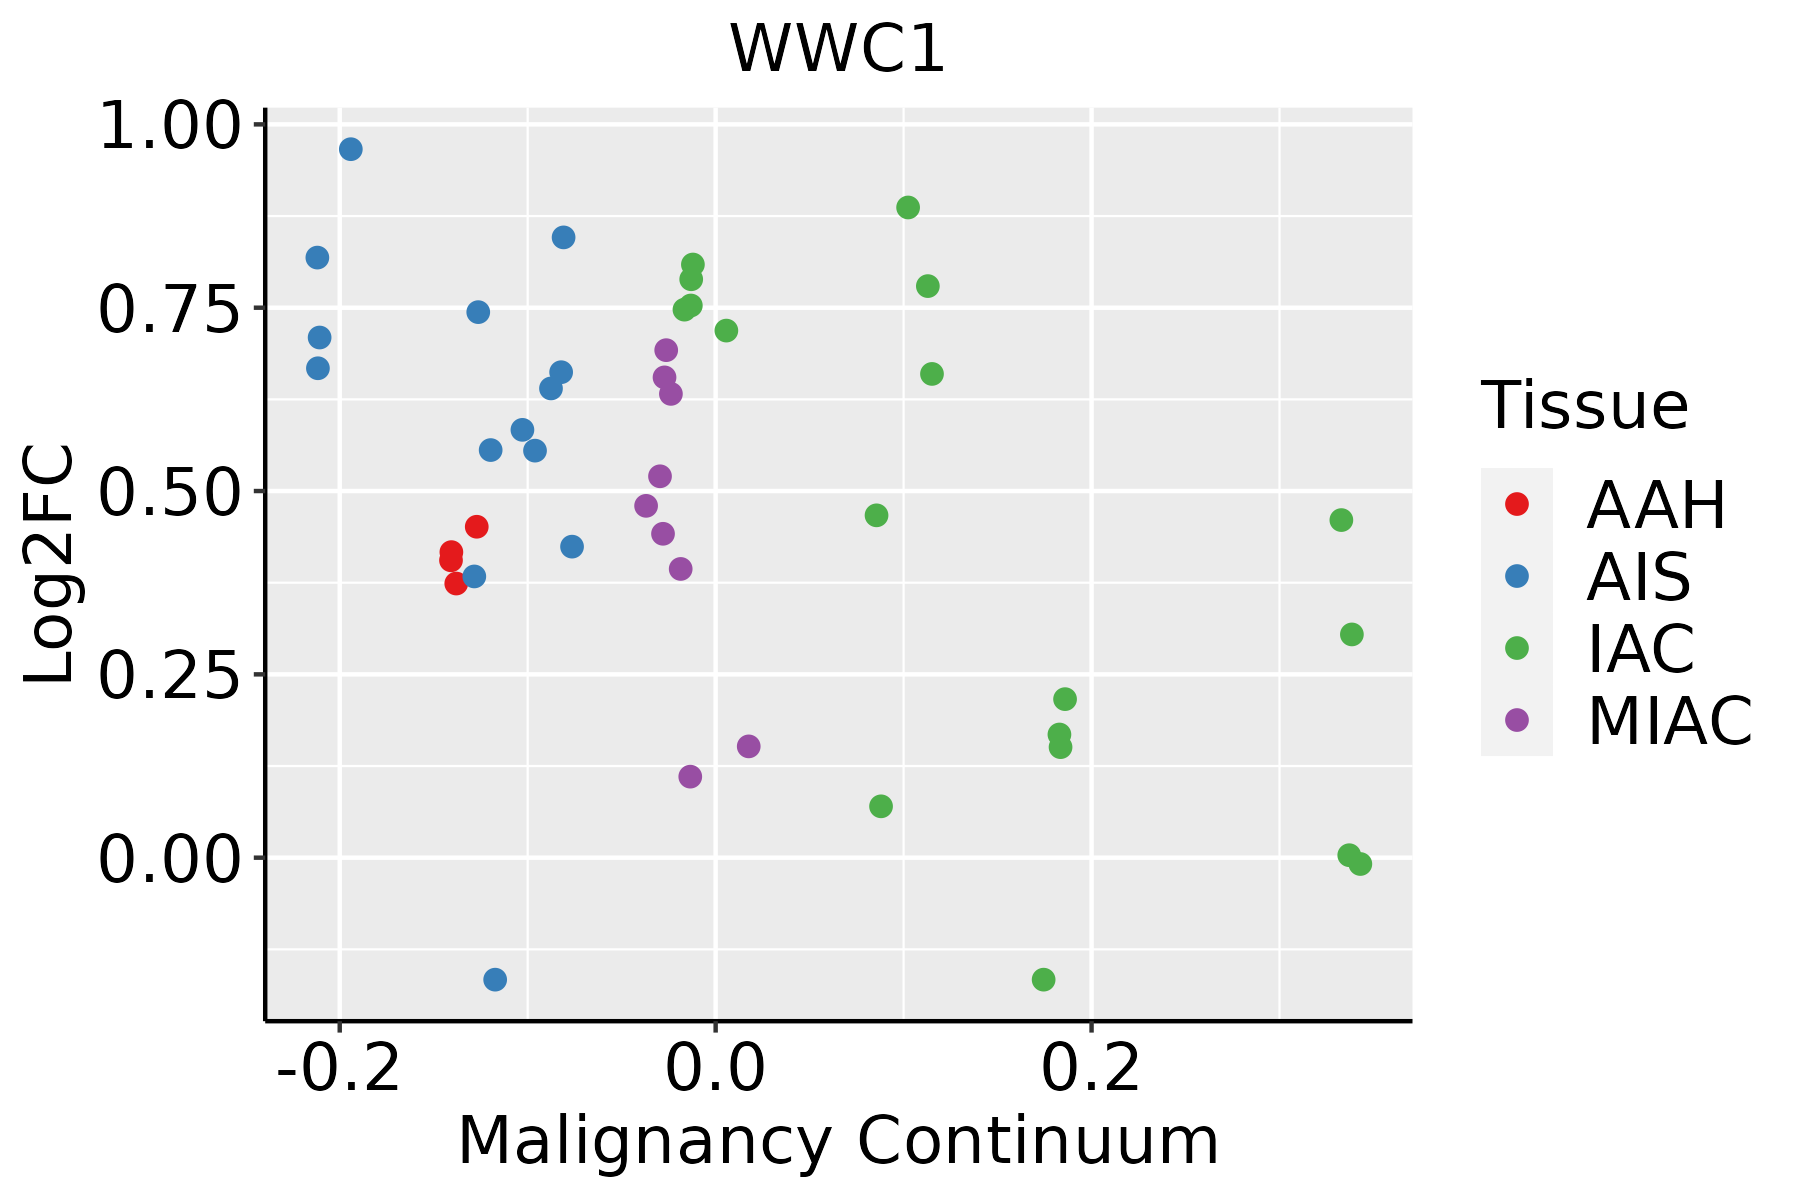 | AAH: Atypical adenomatous hyperplasia |
| AIS: Adenocarcinoma in situ | ||
| IAC: Invasive lung adenocarcinoma | ||
| MIA: Minimally invasive adenocarcinoma | ||
| Prostate |  | BPH: Benign Prostatic Hyperplasia |
| Thyroid |  | ATC: Anaplastic thyroid cancer |
| HT: Hashimoto's thyroiditis | ||
| PTC: Papillary thyroid cancer |
| ∗log2FC in expression of this searched gene in stem-like cells from each diseased tissue sample relative to stem-like cells in normal samples in each tissue plotted against the malignancy continuum. Samples are colored based on if they are from different disease stage. |
Top |
Malignant transformation related pathway analysis |
| Find out the enriched GO biological processes and KEGG pathways involved in transition from healthy to precancer to cancer |
| Tissue | Disease Stage | Enriched GO biological Processes |
| Colorectum | AD |  |
| Colorectum | SER |  |
| Colorectum | MSS |  |
| Colorectum | MSI-H |  |
| Colorectum | FAP |  |
| ∗Top 15 enriched GO BP terms are showed in the bar plot of each disease state in each tissue. Each row represents a significant GO biological process which is colored according to the -log10(p.adjust). |
| Page: 1 2 3 4 5 6 7 8 9 |
| GO ID | Tissue | Disease Stage | Description | Gene Ratio | Bg Ratio | pvalue | p.adjust | Count |
| GO:00071639 | Cervix | CC | establishment or maintenance of cell polarity | 63/2311 | 218/18723 | 4.25e-11 | 8.76e-09 | 63 |
| GO:00300108 | Cervix | CC | establishment of cell polarity | 42/2311 | 143/18723 | 4.30e-08 | 2.62e-06 | 42 |
| GO:00323868 | Cervix | CC | regulation of intracellular transport | 71/2311 | 337/18723 | 3.70e-06 | 9.74e-05 | 71 |
| GO:00434104 | Cervix | CC | positive regulation of MAPK cascade | 90/2311 | 480/18723 | 2.92e-05 | 4.83e-04 | 90 |
| GO:00486386 | Cervix | CC | regulation of developmental growth | 61/2311 | 330/18723 | 7.69e-04 | 6.85e-03 | 61 |
| GO:00353294 | Cervix | CC | hippo signaling | 12/2311 | 40/18723 | 2.44e-03 | 1.71e-02 | 12 |
| GO:00353301 | Cervix | CC | regulation of hippo signaling | 7/2311 | 21/18723 | 1.04e-02 | 4.97e-02 | 7 |
| GO:000716310 | Endometrium | AEH | establishment or maintenance of cell polarity | 54/2100 | 218/18723 | 1.30e-08 | 8.47e-07 | 54 |
| GO:00300109 | Endometrium | AEH | establishment of cell polarity | 36/2100 | 143/18723 | 2.19e-06 | 6.49e-05 | 36 |
| GO:00323869 | Endometrium | AEH | regulation of intracellular transport | 66/2100 | 337/18723 | 4.18e-06 | 1.10e-04 | 66 |
| GO:00434105 | Endometrium | AEH | positive regulation of MAPK cascade | 84/2100 | 480/18723 | 2.19e-05 | 4.25e-04 | 84 |
| GO:00459264 | Endometrium | AEH | negative regulation of growth | 47/2100 | 249/18723 | 2.36e-04 | 2.84e-03 | 47 |
| GO:00486387 | Endometrium | AEH | regulation of developmental growth | 58/2100 | 330/18723 | 3.45e-04 | 3.80e-03 | 58 |
| GO:0035265 | Endometrium | AEH | organ growth | 33/2100 | 178/18723 | 2.53e-03 | 1.87e-02 | 33 |
| GO:000716315 | Endometrium | EEC | establishment or maintenance of cell polarity | 56/2168 | 218/18723 | 5.41e-09 | 3.57e-07 | 56 |
| GO:004341011 | Endometrium | EEC | positive regulation of MAPK cascade | 89/2168 | 480/18723 | 4.21e-06 | 1.08e-04 | 89 |
| GO:003001014 | Endometrium | EEC | establishment of cell polarity | 36/2168 | 143/18723 | 4.57e-06 | 1.15e-04 | 36 |
| GO:003238613 | Endometrium | EEC | regulation of intracellular transport | 67/2168 | 337/18723 | 6.13e-06 | 1.48e-04 | 67 |
| GO:004592611 | Endometrium | EEC | negative regulation of growth | 48/2168 | 249/18723 | 2.58e-04 | 2.98e-03 | 48 |
| GO:004863812 | Endometrium | EEC | regulation of developmental growth | 58/2168 | 330/18723 | 7.65e-04 | 7.16e-03 | 58 |
| Page: 1 2 3 4 |
| Pathway ID | Tissue | Disease Stage | Description | Gene Ratio | Bg Ratio | pvalue | p.adjust | qvalue | Count |
| hsa043908 | Cervix | CC | Hippo signaling pathway | 40/1267 | 157/8465 | 3.64e-04 | 1.82e-03 | 1.07e-03 | 40 |
| hsa0439013 | Cervix | CC | Hippo signaling pathway | 40/1267 | 157/8465 | 3.64e-04 | 1.82e-03 | 1.07e-03 | 40 |
| hsa043909 | Endometrium | AEH | Hippo signaling pathway | 38/1197 | 157/8465 | 4.79e-04 | 3.38e-03 | 2.47e-03 | 38 |
| hsa0439014 | Endometrium | AEH | Hippo signaling pathway | 38/1197 | 157/8465 | 4.79e-04 | 3.38e-03 | 2.47e-03 | 38 |
| hsa0439023 | Endometrium | EEC | Hippo signaling pathway | 39/1237 | 157/8465 | 4.54e-04 | 3.47e-03 | 2.59e-03 | 39 |
| hsa0439033 | Endometrium | EEC | Hippo signaling pathway | 39/1237 | 157/8465 | 4.54e-04 | 3.47e-03 | 2.59e-03 | 39 |
| hsa043907 | Lung | IAC | Hippo signaling pathway | 35/1053 | 157/8465 | 3.60e-04 | 3.45e-03 | 2.29e-03 | 35 |
| hsa0439012 | Lung | IAC | Hippo signaling pathway | 35/1053 | 157/8465 | 3.60e-04 | 3.45e-03 | 2.29e-03 | 35 |
| hsa0439022 | Lung | AIS | Hippo signaling pathway | 34/961 | 157/8465 | 1.36e-04 | 1.63e-03 | 1.05e-03 | 34 |
| hsa0439032 | Lung | AIS | Hippo signaling pathway | 34/961 | 157/8465 | 1.36e-04 | 1.63e-03 | 1.05e-03 | 34 |
| hsa0439041 | Lung | MIAC | Hippo signaling pathway | 21/507 | 157/8465 | 4.20e-04 | 7.19e-03 | 5.20e-03 | 21 |
| hsa0439051 | Lung | MIAC | Hippo signaling pathway | 21/507 | 157/8465 | 4.20e-04 | 7.19e-03 | 5.20e-03 | 21 |
| hsa0439010 | Prostate | BPH | Hippo signaling pathway | 52/1718 | 157/8465 | 9.93e-05 | 6.00e-04 | 3.71e-04 | 52 |
| hsa0439015 | Prostate | BPH | Hippo signaling pathway | 52/1718 | 157/8465 | 9.93e-05 | 6.00e-04 | 3.71e-04 | 52 |
| hsa0439024 | Prostate | Tumor | Hippo signaling pathway | 54/1791 | 157/8465 | 7.52e-05 | 5.30e-04 | 3.28e-04 | 54 |
| hsa0439034 | Prostate | Tumor | Hippo signaling pathway | 54/1791 | 157/8465 | 7.52e-05 | 5.30e-04 | 3.28e-04 | 54 |
| hsa043906 | Stomach | CAG with IM | Hippo signaling pathway | 21/640 | 157/8465 | 7.26e-03 | 4.05e-02 | 2.84e-02 | 21 |
| hsa0439011 | Stomach | CAG with IM | Hippo signaling pathway | 21/640 | 157/8465 | 7.26e-03 | 4.05e-02 | 2.84e-02 | 21 |
| hsa0439021 | Stomach | CSG | Hippo signaling pathway | 21/633 | 157/8465 | 6.42e-03 | 3.62e-02 | 2.61e-02 | 21 |
| hsa0439031 | Stomach | CSG | Hippo signaling pathway | 21/633 | 157/8465 | 6.42e-03 | 3.62e-02 | 2.61e-02 | 21 |
| Page: 1 |
Top |
Cell-cell communication analysis |
| Identification of potential cell-cell interactions between two cell types and their ligand-receptor pairs for different disease states |
| Ligand | Receptor | LRpair | Pathway | Tissue | Disease Stage |
| Page: 1 |
Top |
Single-cell gene regulatory network inference analysis |
| Find out the significant the regulons (TFs) and the target genes of each regulon across cell types for different disease states |
| TF | Cell Type | Tissue | Disease Stage | Target Gene | RSS | Regulon Activity |
| ∗The dot plots of a searched regulon are shown for all cell subpopulations in each disease state of each tissue based on the regulon specific score inferred using pySCENIC and by calculating the average expression. |
| Page: 1 |
Top |
Somatic mutation of malignant transformation related genes |
| Annotation of somatic variants for genes involved in malignant transformation |
| Hugo Symbol | Variant Class | Variant Classification | dbSNP RS | HGVSc | HGVSp | HGVSp Short | SWISSPROT | BIOTYPE | SIFT | PolyPhen | Tumor Sample Barcode | Tissue | Histology | Sex | Age | Stage | Therapy Types | Drugs | Outcome |
| WWC1 | SNV | Missense_Mutation | c.1975N>A | p.Ala659Thr | p.A659T | Q8IX03 | protein_coding | tolerated(1) | benign(0) | TCGA-A2-A04W-01 | Breast | breast invasive carcinoma | Female | <65 | I/II | Chemotherapy | cytoxan | SD | |
| WWC1 | SNV | Missense_Mutation | c.1011N>C | p.Glu337Asp | p.E337D | Q8IX03 | protein_coding | tolerated(0.47) | benign(0.059) | TCGA-A7-A0DA-01 | Breast | breast invasive carcinoma | Female | <65 | I/II | Chemotherapy | adriamycin | SD | |
| WWC1 | SNV | Missense_Mutation | c.796N>G | p.Leu266Val | p.L266V | Q8IX03 | protein_coding | tolerated(0.19) | benign(0.011) | TCGA-A8-A095-01 | Breast | breast invasive carcinoma | Female | <65 | I/II | Chemotherapy | 5-fluorouracil | CR | |
| WWC1 | SNV | Missense_Mutation | c.2481N>C | p.Lys827Asn | p.K827N | Q8IX03 | protein_coding | tolerated(0.3) | probably_damaging(0.996) | TCGA-AC-A23H-01 | Breast | breast invasive carcinoma | Female | >=65 | I/II | Unknown | Unknown | PD | |
| WWC1 | SNV | Missense_Mutation | c.2005G>A | p.Asp669Asn | p.D669N | Q8IX03 | protein_coding | tolerated(0.06) | possibly_damaging(0.614) | TCGA-AC-A2FG-01 | Breast | breast invasive carcinoma | Female | >=65 | I/II | Hormone Therapy | arimidex | CR | |
| WWC1 | SNV | Missense_Mutation | c.806N>T | p.Ser269Leu | p.S269L | Q8IX03 | protein_coding | tolerated(0.06) | benign(0.271) | TCGA-AN-A046-01 | Breast | breast invasive carcinoma | Female | >=65 | I/II | Unknown | Unknown | SD | |
| WWC1 | SNV | Missense_Mutation | novel | c.3130G>A | p.Glu1044Lys | p.E1044K | Q8IX03 | protein_coding | deleterious(0) | probably_damaging(0.992) | TCGA-AR-A5QP-01 | Breast | breast invasive carcinoma | Female | <65 | I/II | Hormone Therapy | tamoxiphen | SD |
| WWC1 | SNV | Missense_Mutation | rs760218601 | c.1753N>A | p.Ala585Thr | p.A585T | Q8IX03 | protein_coding | tolerated(0.61) | benign(0) | TCGA-D8-A1J8-01 | Breast | breast invasive carcinoma | Female | >=65 | I/II | Hormone Therapy | nolvadex | SD |
| WWC1 | SNV | Missense_Mutation | c.1574N>T | p.Ser525Phe | p.S525F | Q8IX03 | protein_coding | deleterious(0.01) | possibly_damaging(0.679) | TCGA-E2-A152-01 | Breast | breast invasive carcinoma | Female | <65 | I/II | Targeted Molecular therapy | trastuzumab | PD | |
| WWC1 | SNV | Missense_Mutation | c.148T>A | p.Cys50Ser | p.C50S | Q8IX03 | protein_coding | deleterious(0) | probably_damaging(0.991) | TCGA-E9-A1R7-01 | Breast | breast invasive carcinoma | Female | <65 | I/II | Hormone Therapy | fareston | SD |
| Page: 1 2 3 4 5 6 7 8 9 10 11 |
Top |
Related drugs of malignant transformation related genes |
| Identification of chemicals and drugs interact with genes involved in malignant transfromation |
| (DGIdb 4.0) |
| Entrez ID | Symbol | Category | Interaction Types | Drug Claim Name | Drug Name | PMIDs |
| Page: 1 |

Copyright 2023-Present -The University of Texas Health Science Center at Houston |