
|
|||||
|
 | |
| |
| |
| |
| |
| |
|
Gene: WSB2 |
Gene summary for WSB2 |
| Gene information | Species | Human | Gene symbol | WSB2 | Gene ID | 55884 |
| Gene name | WD repeat and SOCS box containing 2 | |
| Gene Alias | SBA2 | |
| Cytomap | 12q24.23 | |
| Gene Type | protein-coding | GO ID | GO:0006464 | UniProtAcc | Q9NYS7 |
Top |
Malignant transformation analysis |
| Identification of the aberrant gene expression in precancerous and cancerous lesions by comparing the gene expression of stem-like cells in diseased tissues with normal stem cells |
| Entrez ID | Symbol | Replicates | Species | Organ | Tissue | Adj P-value | Log2FC | Malignancy |
| 55884 | WSB2 | HCC1_Meng | Human | Liver | HCC | 2.61e-77 | 2.14e-01 | 0.0246 |
| 55884 | WSB2 | HCC2_Meng | Human | Liver | HCC | 6.87e-23 | 1.37e-01 | 0.0107 |
| 55884 | WSB2 | HCC1 | Human | Liver | HCC | 2.97e-06 | 3.11e+00 | 0.5336 |
| 55884 | WSB2 | HCC2 | Human | Liver | HCC | 3.61e-29 | 4.96e+00 | 0.5341 |
| 55884 | WSB2 | S014 | Human | Liver | HCC | 1.03e-04 | 2.72e-01 | 0.2254 |
| 55884 | WSB2 | S015 | Human | Liver | HCC | 1.56e-08 | 4.89e-01 | 0.2375 |
| 55884 | WSB2 | S016 | Human | Liver | HCC | 3.04e-04 | 2.55e-01 | 0.2243 |
| 55884 | WSB2 | S027 | Human | Liver | HCC | 7.65e-09 | 6.85e-01 | 0.2446 |
| 55884 | WSB2 | S028 | Human | Liver | HCC | 8.92e-17 | 7.84e-01 | 0.2503 |
| 55884 | WSB2 | S029 | Human | Liver | HCC | 9.72e-18 | 8.02e-01 | 0.2581 |
| 55884 | WSB2 | C04 | Human | Oral cavity | OSCC | 8.28e-10 | 7.01e-01 | 0.2633 |
| 55884 | WSB2 | C21 | Human | Oral cavity | OSCC | 1.91e-23 | 7.29e-01 | 0.2678 |
| 55884 | WSB2 | C30 | Human | Oral cavity | OSCC | 2.23e-45 | 1.55e+00 | 0.3055 |
| 55884 | WSB2 | C38 | Human | Oral cavity | OSCC | 4.16e-08 | 7.32e-01 | 0.172 |
| 55884 | WSB2 | C43 | Human | Oral cavity | OSCC | 5.07e-13 | 3.62e-01 | 0.1704 |
| 55884 | WSB2 | C46 | Human | Oral cavity | OSCC | 6.60e-05 | 2.37e-01 | 0.1673 |
| 55884 | WSB2 | C51 | Human | Oral cavity | OSCC | 2.17e-18 | 8.03e-01 | 0.2674 |
| 55884 | WSB2 | C57 | Human | Oral cavity | OSCC | 1.77e-11 | 4.38e-01 | 0.1679 |
| 55884 | WSB2 | C06 | Human | Oral cavity | OSCC | 4.07e-04 | 1.01e+00 | 0.2699 |
| 55884 | WSB2 | C08 | Human | Oral cavity | OSCC | 9.72e-33 | 6.87e-01 | 0.1919 |
| Page: 1 2 |
| Tissue | Expression Dynamics | Abbreviation |
| Liver | 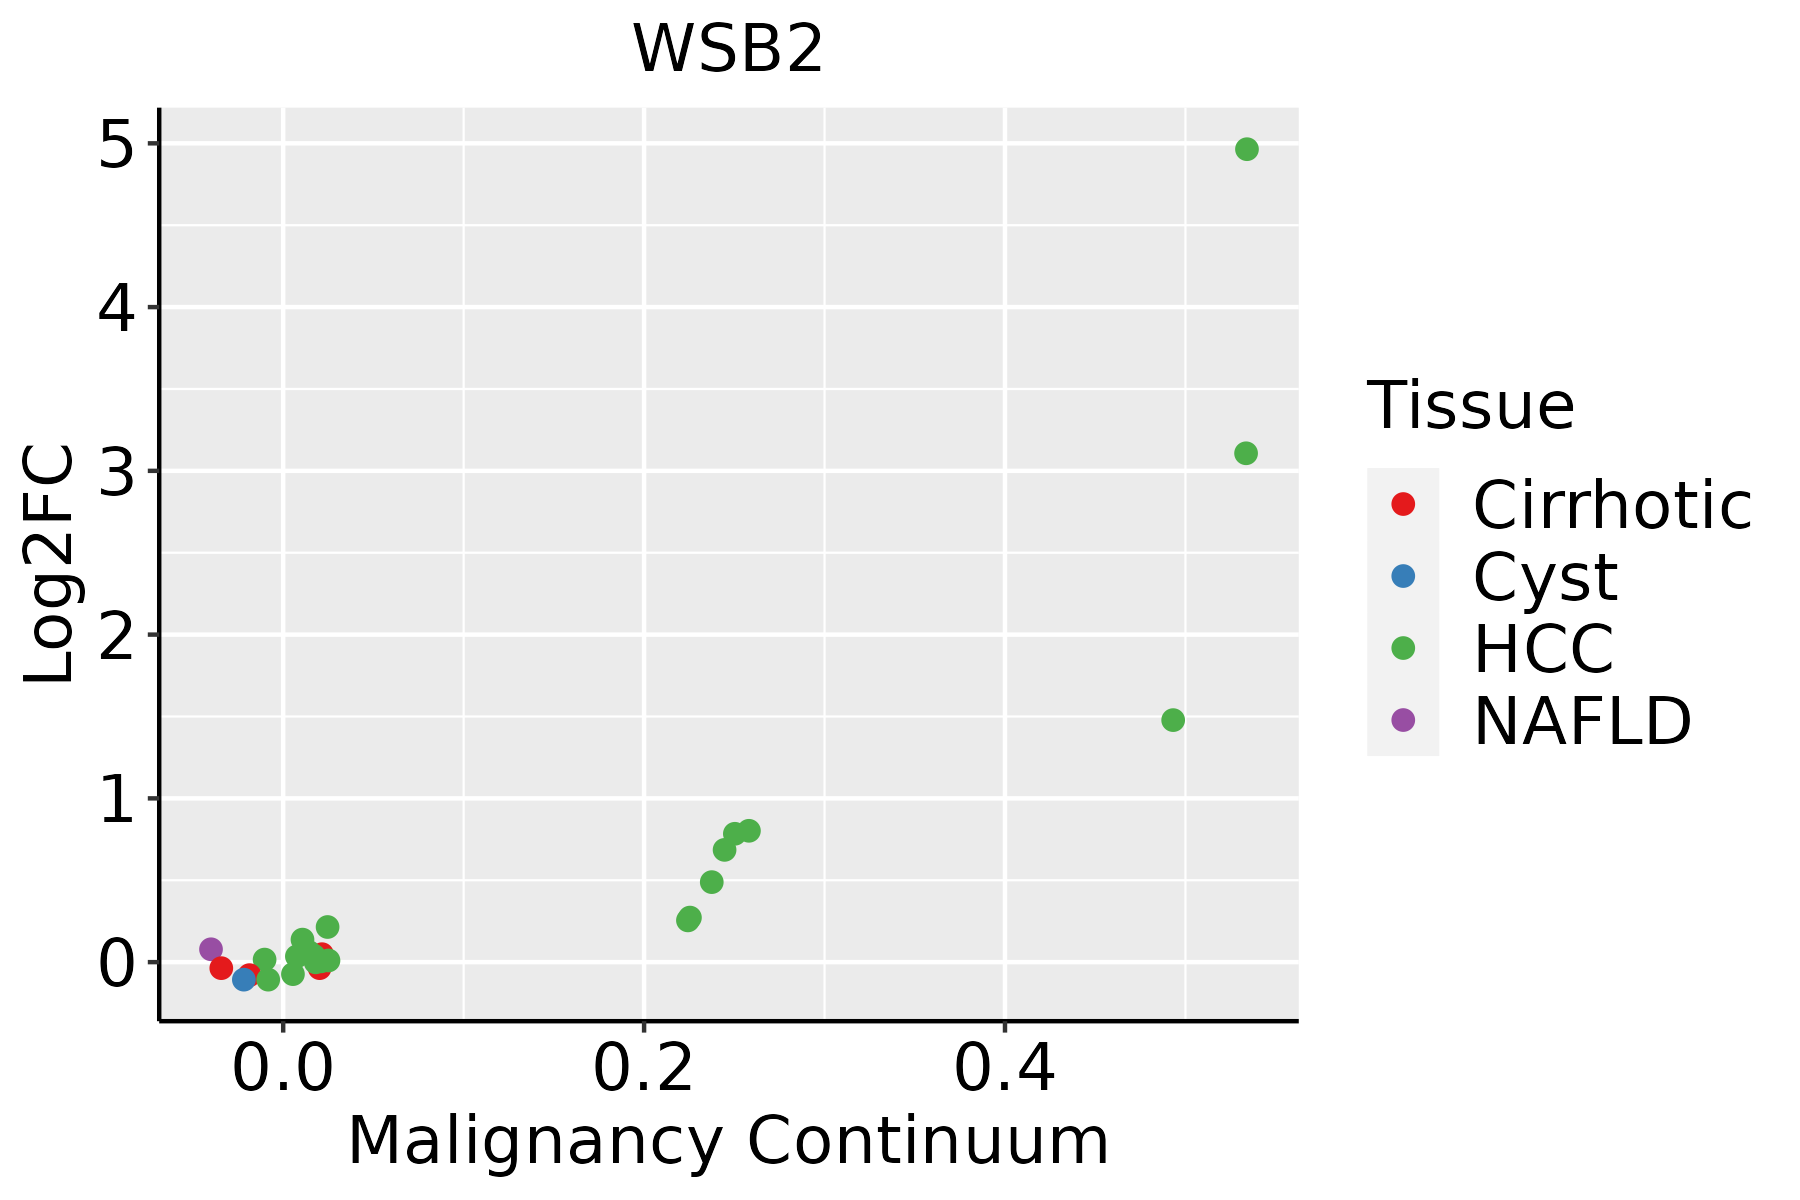 | HCC: Hepatocellular carcinoma |
| NAFLD: Non-alcoholic fatty liver disease | ||
| Oral Cavity | 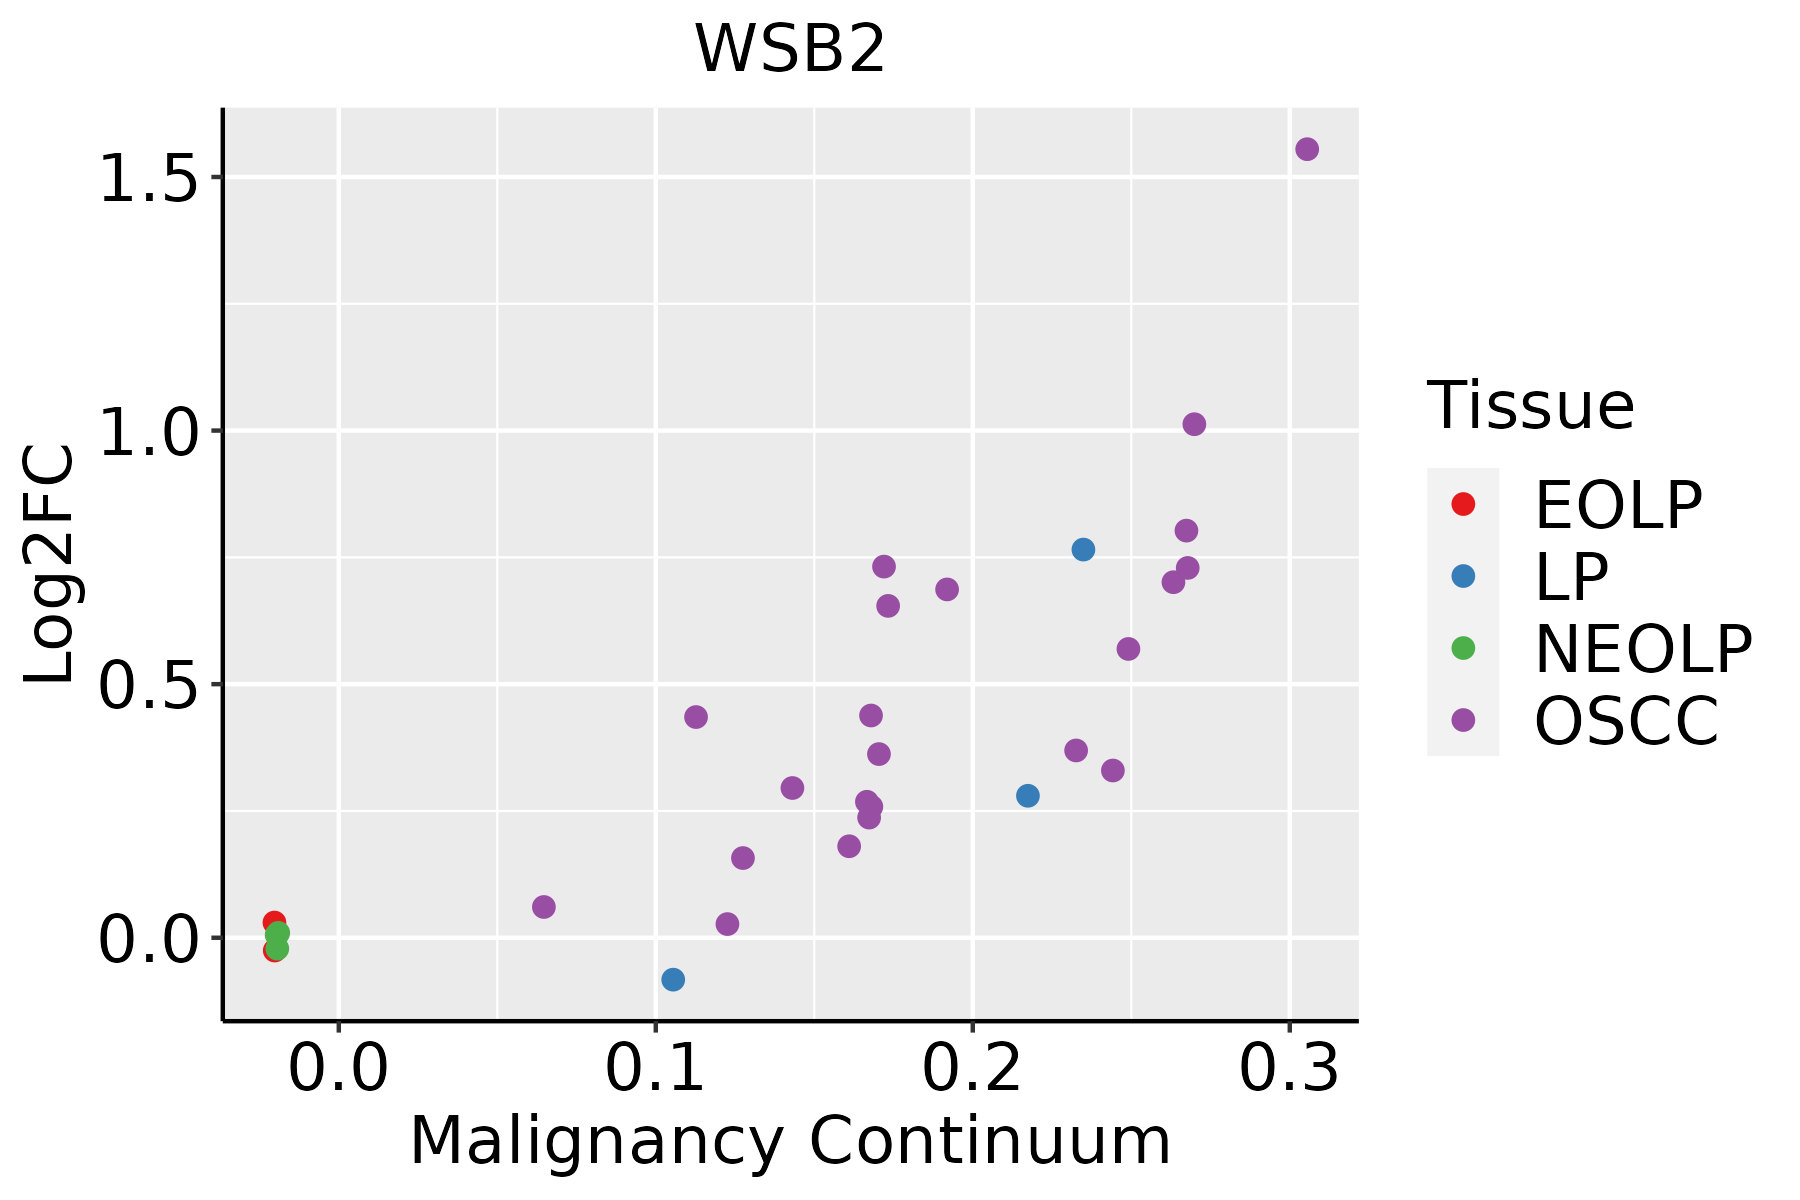 | EOLP: Erosive Oral lichen planus |
| LP: leukoplakia | ||
| NEOLP: Non-erosive oral lichen planus | ||
| OSCC: Oral squamous cell carcinoma | ||
| Skin | 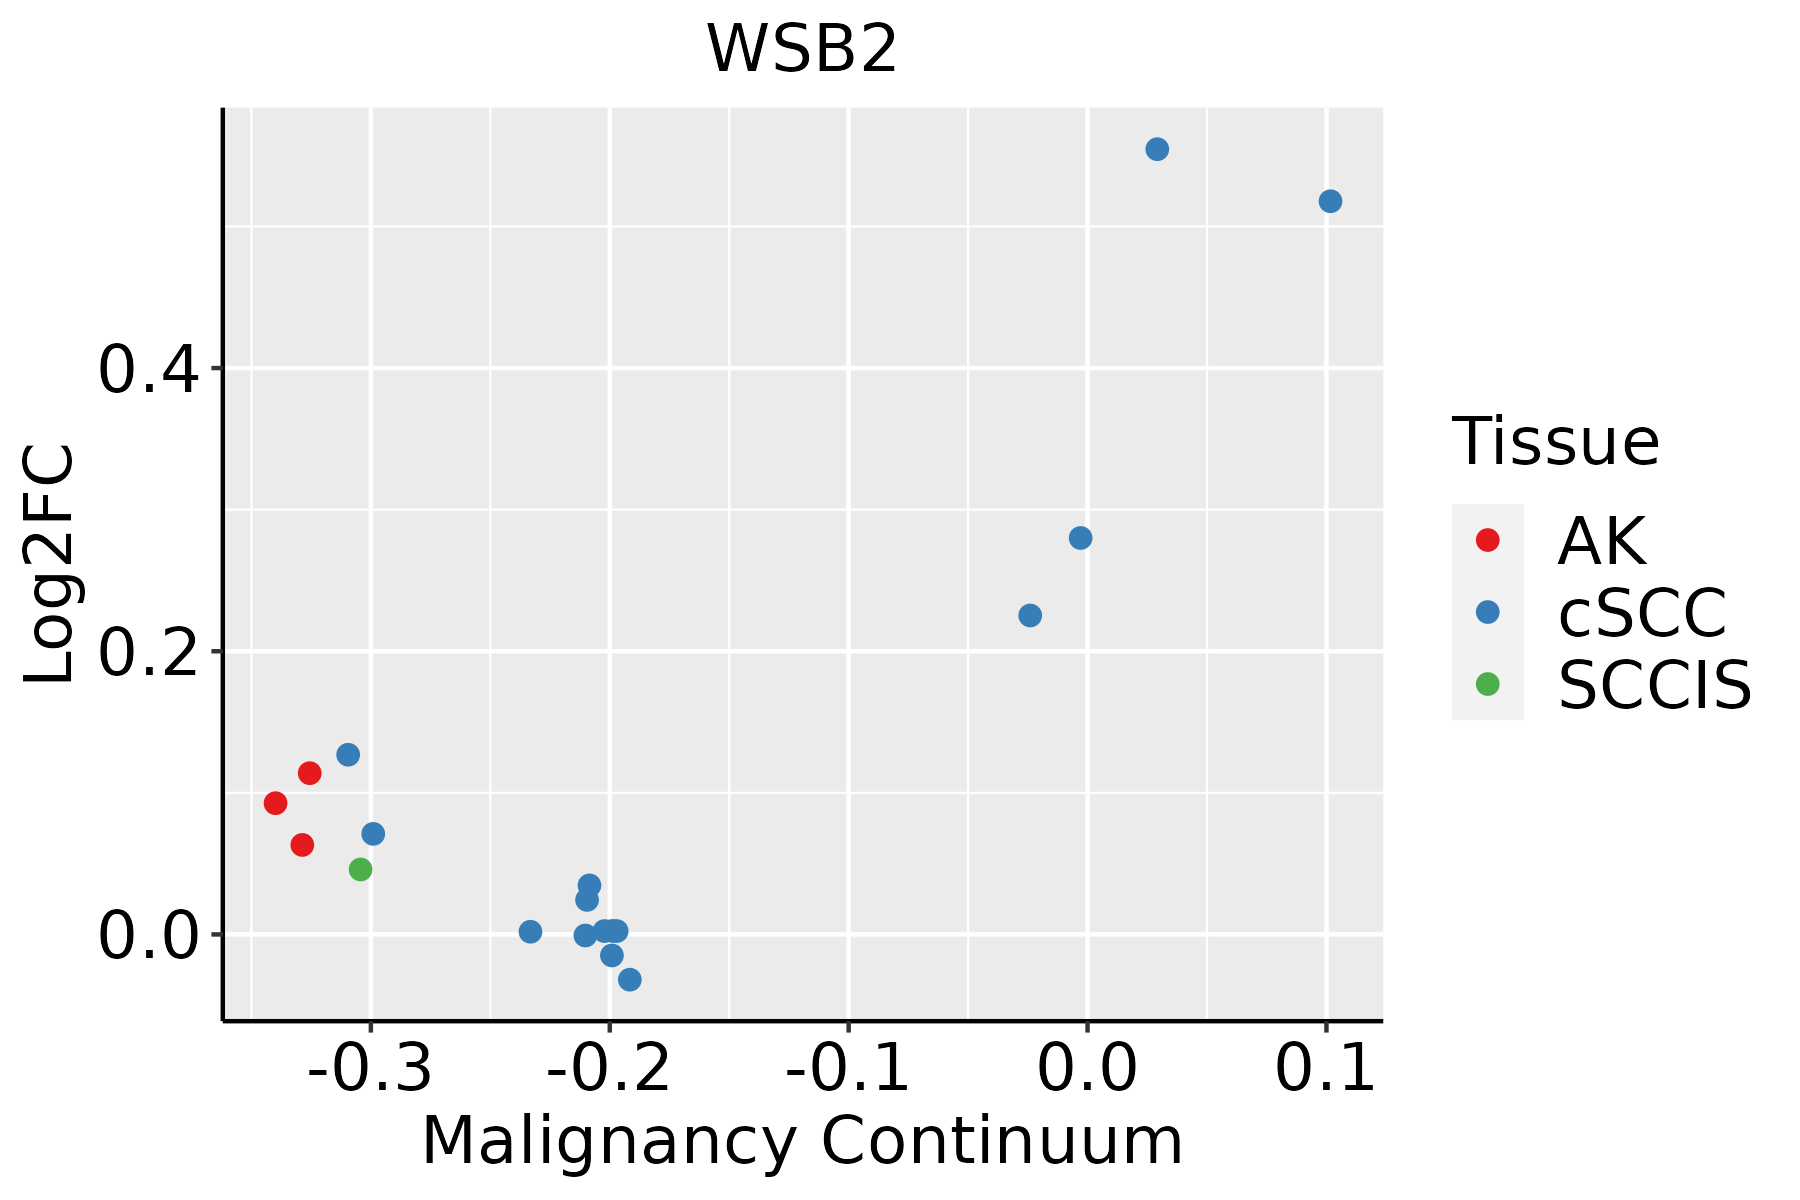 | AK: Actinic keratosis |
| cSCC: Cutaneous squamous cell carcinoma | ||
| SCCIS:squamous cell carcinoma in situ |
| ∗log2FC in expression of this searched gene in stem-like cells from each diseased tissue sample relative to stem-like cells in normal samples in each tissue plotted against the malignancy continuum. Samples are colored based on if they are from different disease stage. |
Top |
Malignant transformation related pathway analysis |
| Find out the enriched GO biological processes and KEGG pathways involved in transition from healthy to precancer to cancer |
| Tissue | Disease Stage | Enriched GO biological Processes |
| Colorectum | AD |  |
| Colorectum | SER |  |
| Colorectum | MSS |  |
| Colorectum | MSI-H |  |
| Colorectum | FAP |  |
| ∗Top 15 enriched GO BP terms are showed in the bar plot of each disease state in each tissue. Each row represents a significant GO biological process which is colored according to the -log10(p.adjust). |
| Page: 1 2 3 4 5 6 7 8 9 |
| GO ID | Tissue | Disease Stage | Description | Gene Ratio | Bg Ratio | pvalue | p.adjust | Count |
| Page: 1 |
| Pathway ID | Tissue | Disease Stage | Description | Gene Ratio | Bg Ratio | pvalue | p.adjust | qvalue | Count |
| Page: 1 |
Top |
Cell-cell communication analysis |
| Identification of potential cell-cell interactions between two cell types and their ligand-receptor pairs for different disease states |
| Ligand | Receptor | LRpair | Pathway | Tissue | Disease Stage |
| Page: 1 |
Top |
Single-cell gene regulatory network inference analysis |
| Find out the significant the regulons (TFs) and the target genes of each regulon across cell types for different disease states |
| TF | Cell Type | Tissue | Disease Stage | Target Gene | RSS | Regulon Activity |
| ∗The dot plots of a searched regulon are shown for all cell subpopulations in each disease state of each tissue based on the regulon specific score inferred using pySCENIC and by calculating the average expression. |
| Page: 1 |
Top |
Somatic mutation of malignant transformation related genes |
| Annotation of somatic variants for genes involved in malignant transformation |
| Hugo Symbol | Variant Class | Variant Classification | dbSNP RS | HGVSc | HGVSp | HGVSp Short | SWISSPROT | BIOTYPE | SIFT | PolyPhen | Tumor Sample Barcode | Tissue | Histology | Sex | Age | Stage | Therapy Types | Drugs | Outcome |
| WSB2 | SNV | Missense_Mutation | c.1250N>A | p.Thr417Lys | p.T417K | Q9NYS7 | protein_coding | deleterious(0.03) | possibly_damaging(0.495) | TCGA-AR-A0U3-01 | Breast | breast invasive carcinoma | Female | <65 | I/II | Chemotherapy | doxorubicin | SD | |
| WSB2 | insertion | Frame_Shift_Ins | novel | c.758_759insATGCATCTTGAGCCCTT | p.Gly254CysfsTer33 | p.G254Cfs*33 | Q9NYS7 | protein_coding | TCGA-A8-A09B-01 | Breast | breast invasive carcinoma | Female | <65 | III/IV | Chemotherapy | 5-fluorouracil | SD | ||
| WSB2 | SNV | Missense_Mutation | rs781441613 | c.904N>A | p.Ala302Thr | p.A302T | Q9NYS7 | protein_coding | tolerated(0.61) | benign(0.001) | TCGA-UC-A7PD-01 | Cervix | cervical & endocervical cancer | Female | <65 | I/II | Unknown | Unknown | PD |
| WSB2 | SNV | Missense_Mutation | rs550650687 | c.289N>T | p.Arg97Trp | p.R97W | Q9NYS7 | protein_coding | deleterious(0) | probably_damaging(0.924) | TCGA-A6-5665-01 | Colorectum | colon adenocarcinoma | Female | >=65 | I/II | Unknown | Unknown | PD |
| WSB2 | SNV | Missense_Mutation | c.410A>G | p.Asp137Gly | p.D137G | Q9NYS7 | protein_coding | tolerated(1) | benign(0.001) | TCGA-AA-3710-01 | Colorectum | colon adenocarcinoma | Female | >=65 | I/II | Unknown | Unknown | SD | |
| WSB2 | SNV | Missense_Mutation | novel | c.392N>G | p.His131Arg | p.H131R | Q9NYS7 | protein_coding | tolerated(0.34) | benign(0) | TCGA-AA-3846-01 | Colorectum | colon adenocarcinoma | Female | >=65 | I/II | Unknown | Unknown | SD |
| WSB2 | SNV | Missense_Mutation | novel | c.619N>G | p.Ile207Val | p.I207V | Q9NYS7 | protein_coding | tolerated(1) | benign(0.007) | TCGA-CA-6717-01 | Colorectum | colon adenocarcinoma | Male | <65 | I/II | Chemotherapy | oxaliplatin | CR |
| WSB2 | SNV | Missense_Mutation | c.104C>A | p.Pro35His | p.P35H | Q9NYS7 | protein_coding | deleterious(0.01) | benign(0.243) | TCGA-CK-4951-01 | Colorectum | colon adenocarcinoma | Female | >=65 | I/II | Unknown | Unknown | PD | |
| WSB2 | SNV | Missense_Mutation | c.806N>T | p.Ala269Val | p.A269V | Q9NYS7 | protein_coding | deleterious(0.03) | probably_damaging(0.996) | TCGA-F4-6570-01 | Colorectum | colon adenocarcinoma | Female | >=65 | I/II | Unknown | Unknown | SD | |
| WSB2 | SNV | Missense_Mutation | c.511G>A | p.Asp171Asn | p.D171N | Q9NYS7 | protein_coding | deleterious(0.02) | possibly_damaging(0.807) | TCGA-A5-A0G2-01 | Endometrium | uterine corpus endometrioid carcinoma | Female | <65 | III/IV | Unknown | Unknown | SD |
| Page: 1 2 3 4 |
Top |
Related drugs of malignant transformation related genes |
| Identification of chemicals and drugs interact with genes involved in malignant transfromation |
| (DGIdb 4.0) |
| Entrez ID | Symbol | Category | Interaction Types | Drug Claim Name | Drug Name | PMIDs |
| Page: 1 |

Copyright 2023-Present -The University of Texas Health Science Center at Houston |