
|
|||||
|
 | |
| |
| |
| |
| |
| |
|
Gene: WRNIP1 |
Gene summary for WRNIP1 |
| Gene information | Species | Human | Gene symbol | WRNIP1 | Gene ID | 56897 |
| Gene name | WRN helicase interacting protein 1 | |
| Gene Alias | CFAP93 | |
| Cytomap | 6p25.2 | |
| Gene Type | protein-coding | GO ID | GO:0000731 | UniProtAcc | Q96S55 |
Top |
Malignant transformation analysis |
| Identification of the aberrant gene expression in precancerous and cancerous lesions by comparing the gene expression of stem-like cells in diseased tissues with normal stem cells |
| Entrez ID | Symbol | Replicates | Species | Organ | Tissue | Adj P-value | Log2FC | Malignancy |
| 56897 | WRNIP1 | LZE2T | Human | Esophagus | ESCC | 3.40e-02 | 2.16e-01 | 0.082 |
| 56897 | WRNIP1 | LZE7T | Human | Esophagus | ESCC | 9.51e-05 | 8.50e-02 | 0.0667 |
| 56897 | WRNIP1 | LZE24T | Human | Esophagus | ESCC | 7.02e-06 | 9.95e-02 | 0.0596 |
| 56897 | WRNIP1 | P2T-E | Human | Esophagus | ESCC | 1.40e-21 | 3.39e-01 | 0.1177 |
| 56897 | WRNIP1 | P4T-E | Human | Esophagus | ESCC | 4.26e-10 | 2.17e-01 | 0.1323 |
| 56897 | WRNIP1 | P5T-E | Human | Esophagus | ESCC | 9.81e-13 | 1.03e-01 | 0.1327 |
| 56897 | WRNIP1 | P8T-E | Human | Esophagus | ESCC | 5.48e-15 | 6.91e-02 | 0.0889 |
| 56897 | WRNIP1 | P9T-E | Human | Esophagus | ESCC | 2.82e-08 | 1.80e-01 | 0.1131 |
| 56897 | WRNIP1 | P10T-E | Human | Esophagus | ESCC | 2.45e-10 | 8.44e-02 | 0.116 |
| 56897 | WRNIP1 | P11T-E | Human | Esophagus | ESCC | 1.81e-06 | 2.56e-01 | 0.1426 |
| 56897 | WRNIP1 | P12T-E | Human | Esophagus | ESCC | 2.56e-09 | 1.83e-02 | 0.1122 |
| 56897 | WRNIP1 | P15T-E | Human | Esophagus | ESCC | 6.52e-09 | 7.88e-02 | 0.1149 |
| 56897 | WRNIP1 | P16T-E | Human | Esophagus | ESCC | 2.95e-08 | 4.32e-02 | 0.1153 |
| 56897 | WRNIP1 | P17T-E | Human | Esophagus | ESCC | 2.34e-05 | 1.98e-01 | 0.1278 |
| 56897 | WRNIP1 | P20T-E | Human | Esophagus | ESCC | 7.75e-12 | 5.59e-02 | 0.1124 |
| 56897 | WRNIP1 | P21T-E | Human | Esophagus | ESCC | 1.05e-14 | 1.21e-01 | 0.1617 |
| 56897 | WRNIP1 | P22T-E | Human | Esophagus | ESCC | 3.05e-15 | 1.90e-02 | 0.1236 |
| 56897 | WRNIP1 | P23T-E | Human | Esophagus | ESCC | 9.81e-14 | 2.85e-01 | 0.108 |
| 56897 | WRNIP1 | P26T-E | Human | Esophagus | ESCC | 3.11e-17 | 1.30e-01 | 0.1276 |
| 56897 | WRNIP1 | P27T-E | Human | Esophagus | ESCC | 2.20e-13 | 1.23e-01 | 0.1055 |
| Page: 1 2 3 4 |
| Tissue | Expression Dynamics | Abbreviation |
| Esophagus |  | ESCC: Esophageal squamous cell carcinoma |
| HGIN: High-grade intraepithelial neoplasias | ||
| LGIN: Low-grade intraepithelial neoplasias | ||
| Liver | 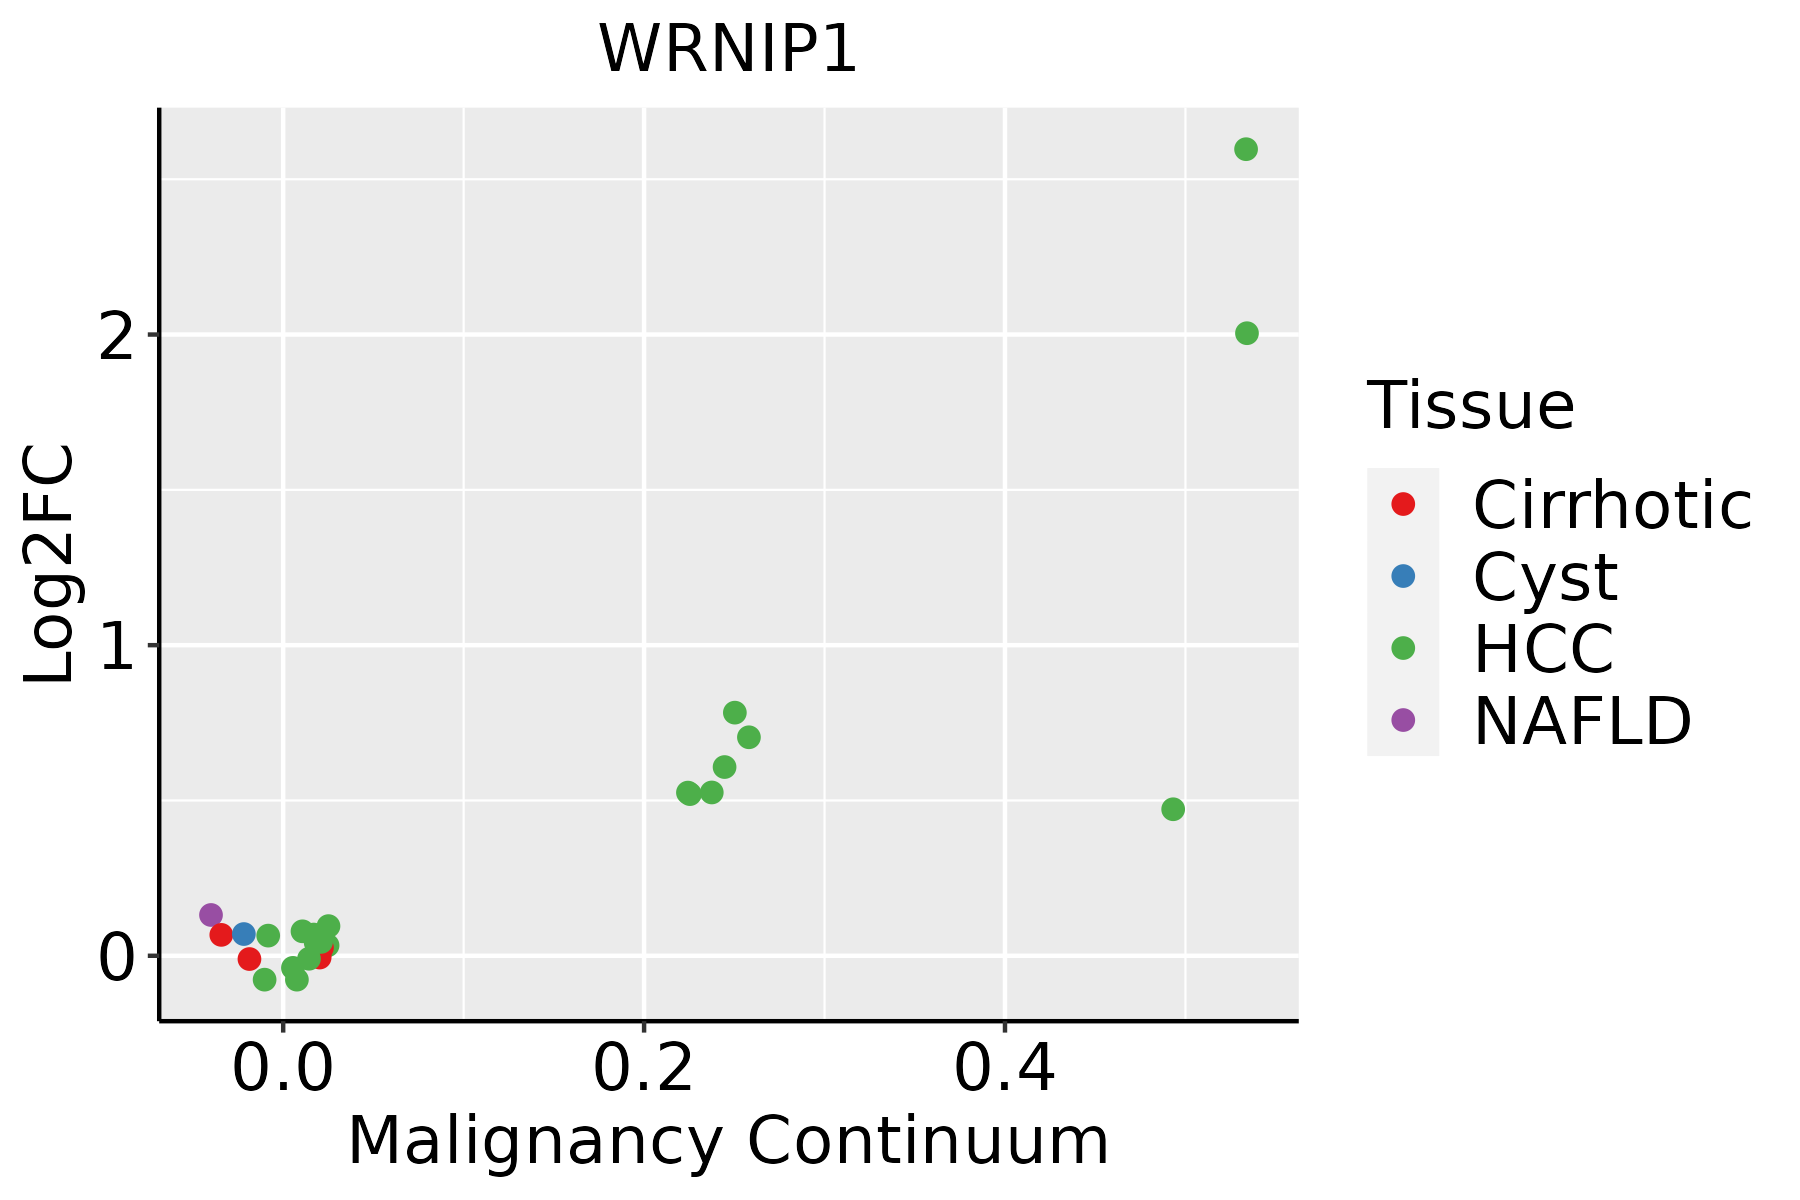 | HCC: Hepatocellular carcinoma |
| NAFLD: Non-alcoholic fatty liver disease | ||
| Oral Cavity |  | EOLP: Erosive Oral lichen planus |
| LP: leukoplakia | ||
| NEOLP: Non-erosive oral lichen planus | ||
| OSCC: Oral squamous cell carcinoma |
| ∗log2FC in expression of this searched gene in stem-like cells from each diseased tissue sample relative to stem-like cells in normal samples in each tissue plotted against the malignancy continuum. Samples are colored based on if they are from different disease stage. |
Top |
Malignant transformation related pathway analysis |
| Find out the enriched GO biological processes and KEGG pathways involved in transition from healthy to precancer to cancer |
| Tissue | Disease Stage | Enriched GO biological Processes |
| Colorectum | AD |  |
| Colorectum | SER |  |
| Colorectum | MSS |  |
| Colorectum | MSI-H |  |
| Colorectum | FAP |  |
| ∗Top 15 enriched GO BP terms are showed in the bar plot of each disease state in each tissue. Each row represents a significant GO biological process which is colored according to the -log10(p.adjust). |
| Page: 1 2 3 4 5 6 7 8 9 |
| GO ID | Tissue | Disease Stage | Description | Gene Ratio | Bg Ratio | pvalue | p.adjust | Count |
| GO:00062604 | Esophagus | ESCC | DNA replication | 181/8552 | 260/18723 | 3.55e-15 | 2.05e-13 | 181 |
| GO:005105215 | Esophagus | ESCC | regulation of DNA metabolic process | 232/8552 | 359/18723 | 2.40e-13 | 1.13e-11 | 232 |
| GO:007189716 | Esophagus | ESCC | DNA biosynthetic process | 127/8552 | 180/18723 | 1.04e-11 | 3.85e-10 | 127 |
| GO:2001020110 | Esophagus | ESCC | regulation of response to DNA damage stimulus | 145/8552 | 219/18723 | 5.97e-10 | 1.50e-08 | 145 |
| GO:00062612 | Esophagus | ESCC | DNA-dependent DNA replication | 100/8552 | 151/18723 | 2.61e-07 | 3.94e-06 | 100 |
| GO:00062754 | Esophagus | ESCC | regulation of DNA replication | 73/8552 | 107/18723 | 1.97e-06 | 2.28e-05 | 73 |
| GO:003239214 | Esophagus | ESCC | DNA geometric change | 62/8552 | 90/18723 | 7.02e-06 | 7.04e-05 | 62 |
| GO:003250813 | Esophagus | ESCC | DNA duplex unwinding | 58/8552 | 84/18723 | 1.23e-05 | 1.14e-04 | 58 |
| GO:00062826 | Esophagus | ESCC | regulation of DNA repair | 82/8552 | 130/18723 | 4.65e-05 | 3.66e-04 | 82 |
| GO:00062701 | Esophagus | ESCC | DNA replication initiation | 27/8552 | 34/18723 | 6.01e-05 | 4.62e-04 | 27 |
| GO:0090329 | Esophagus | ESCC | regulation of DNA-dependent DNA replication | 30/8552 | 46/18723 | 5.91e-03 | 2.18e-02 | 30 |
| GO:005105221 | Liver | HCC | regulation of DNA metabolic process | 198/7958 | 359/18723 | 7.62e-07 | 1.17e-05 | 198 |
| GO:200102021 | Liver | HCC | regulation of response to DNA damage stimulus | 128/7958 | 219/18723 | 1.31e-06 | 1.90e-05 | 128 |
| GO:00062601 | Liver | HCC | DNA replication | 146/7958 | 260/18723 | 5.68e-06 | 7.02e-05 | 146 |
| GO:00718975 | Liver | HCC | DNA biosynthetic process | 99/7958 | 180/18723 | 4.66e-04 | 3.08e-03 | 99 |
| GO:003239211 | Liver | HCC | DNA geometric change | 54/7958 | 90/18723 | 6.04e-04 | 3.79e-03 | 54 |
| GO:00062824 | Liver | HCC | regulation of DNA repair | 74/7958 | 130/18723 | 6.27e-04 | 3.89e-03 | 74 |
| GO:00325081 | Liver | HCC | DNA duplex unwinding | 49/7958 | 84/18723 | 2.46e-03 | 1.19e-02 | 49 |
| GO:00062751 | Liver | HCC | regulation of DNA replication | 60/7958 | 107/18723 | 3.15e-03 | 1.46e-02 | 60 |
| GO:0006261 | Liver | HCC | DNA-dependent DNA replication | 80/7958 | 151/18723 | 5.91e-03 | 2.44e-02 | 80 |
| Page: 1 2 |
| Pathway ID | Tissue | Disease Stage | Description | Gene Ratio | Bg Ratio | pvalue | p.adjust | qvalue | Count |
| Page: 1 |
Top |
Cell-cell communication analysis |
| Identification of potential cell-cell interactions between two cell types and their ligand-receptor pairs for different disease states |
| Ligand | Receptor | LRpair | Pathway | Tissue | Disease Stage |
| Page: 1 |
Top |
Single-cell gene regulatory network inference analysis |
| Find out the significant the regulons (TFs) and the target genes of each regulon across cell types for different disease states |
| TF | Cell Type | Tissue | Disease Stage | Target Gene | RSS | Regulon Activity |
| ∗The dot plots of a searched regulon are shown for all cell subpopulations in each disease state of each tissue based on the regulon specific score inferred using pySCENIC and by calculating the average expression. |
| Page: 1 |
Top |
Somatic mutation of malignant transformation related genes |
| Annotation of somatic variants for genes involved in malignant transformation |
| Hugo Symbol | Variant Class | Variant Classification | dbSNP RS | HGVSc | HGVSp | HGVSp Short | SWISSPROT | BIOTYPE | SIFT | PolyPhen | Tumor Sample Barcode | Tissue | Histology | Sex | Age | Stage | Therapy Types | Drugs | Outcome |
| WRNIP1 | SNV | Missense_Mutation | novel | c.1060N>T | p.Gly354Trp | p.G354W | Q96S55 | protein_coding | deleterious(0) | probably_damaging(1) | TCGA-A7-A0DB-01 | Breast | breast invasive carcinoma | Female | <65 | I/II | Hormone Therapy | arimidex | SD |
| WRNIP1 | SNV | Missense_Mutation | novel | c.1585G>A | p.Gly529Arg | p.G529R | Q96S55 | protein_coding | deleterious(0) | probably_damaging(0.999) | TCGA-AO-A03R-01 | Breast | breast invasive carcinoma | Female | <65 | I/II | Chemotherapy | doxorubicin | SD |
| WRNIP1 | SNV | Missense_Mutation | c.1004A>C | p.Lys335Thr | p.K335T | Q96S55 | protein_coding | deleterious(0) | probably_damaging(0.999) | TCGA-D8-A1JK-01 | Breast | breast invasive carcinoma | Female | >=65 | I/II | Unknown | Unknown | SD | |
| WRNIP1 | SNV | Missense_Mutation | c.1871G>A | p.Arg624Lys | p.R624K | Q96S55 | protein_coding | tolerated(0.83) | benign(0.023) | TCGA-E2-A10A-01 | Breast | breast invasive carcinoma | Female | <65 | I/II | Hormone Therapy | zoladex | SD | |
| WRNIP1 | SNV | Missense_Mutation | novel | c.1054N>G | p.Leu352Val | p.L352V | Q96S55 | protein_coding | deleterious(0) | probably_damaging(0.922) | TCGA-EA-A3HU-01 | Cervix | cervical & endocervical cancer | Female | <65 | I/II | Unknown | Unknown | SD |
| WRNIP1 | SNV | Missense_Mutation | rs369024379 | c.1861N>A | p.Ala621Thr | p.A621T | Q96S55 | protein_coding | deleterious(0) | possibly_damaging(0.87) | TCGA-A6-A565-01 | Colorectum | colon adenocarcinoma | Female | <65 | III/IV | Unspecific | 5FU | PD |
| WRNIP1 | SNV | Missense_Mutation | c.878N>C | p.Val293Ala | p.V293A | Q96S55 | protein_coding | deleterious(0) | probably_damaging(0.95) | TCGA-AA-3510-01 | Colorectum | colon adenocarcinoma | Male | >=65 | I/II | Unknown | Unknown | SD | |
| WRNIP1 | SNV | Missense_Mutation | rs757603585 | c.1318N>A | p.Ala440Thr | p.A440T | Q96S55 | protein_coding | deleterious(0) | possibly_damaging(0.76) | TCGA-AA-3811-01 | Colorectum | colon adenocarcinoma | Female | >=65 | III/IV | Unknown | Unknown | PD |
| WRNIP1 | SNV | Missense_Mutation | rs761279595 | c.1786G>A | p.Ala596Thr | p.A596T | Q96S55 | protein_coding | deleterious(0) | probably_damaging(0.991) | TCGA-G4-6627-01 | Colorectum | colon adenocarcinoma | Male | >=65 | I/II | Unknown | Unknown | PD |
| WRNIP1 | SNV | Missense_Mutation | c.1130N>C | p.Leu377Pro | p.L377P | Q96S55 | protein_coding | deleterious(0) | probably_damaging(0.998) | TCGA-A5-A0GA-01 | Endometrium | uterine corpus endometrioid carcinoma | Female | >=65 | III/IV | Chemotherapy | taxol | PD |
| Page: 1 2 3 4 |
Top |
Related drugs of malignant transformation related genes |
| Identification of chemicals and drugs interact with genes involved in malignant transfromation |
| (DGIdb 4.0) |
| Entrez ID | Symbol | Category | Interaction Types | Drug Claim Name | Drug Name | PMIDs |
| Page: 1 |

Copyright 2023-Present -The University of Texas Health Science Center at Houston |