
|
|||||
|
 | |
| |
| |
| |
| |
| |
|
Gene: WNT9A |
Gene summary for WNT9A |
| Gene information | Species | Human | Gene symbol | WNT9A | Gene ID | 7483 |
| Gene name | Wnt family member 9A | |
| Gene Alias | WNT14 | |
| Cytomap | 1q42.13 | |
| Gene Type | protein-coding | GO ID | GO:0001501 | UniProtAcc | D9ZGG3 |
Top |
Malignant transformation analysis |
| Identification of the aberrant gene expression in precancerous and cancerous lesions by comparing the gene expression of stem-like cells in diseased tissues with normal stem cells |
| Entrez ID | Symbol | Replicates | Species | Organ | Tissue | Adj P-value | Log2FC | Malignancy |
| 7483 | WNT9A | CCI_1 | Human | Cervix | CC | 5.65e-06 | 3.55e-01 | 0.528 |
| 7483 | WNT9A | CCI_2 | Human | Cervix | CC | 1.21e-03 | 5.40e-01 | 0.5249 |
| 7483 | WNT9A | CCI_3 | Human | Cervix | CC | 1.26e-18 | 8.60e-01 | 0.516 |
| Page: 1 |
| Tissue | Expression Dynamics | Abbreviation |
| Cervix | 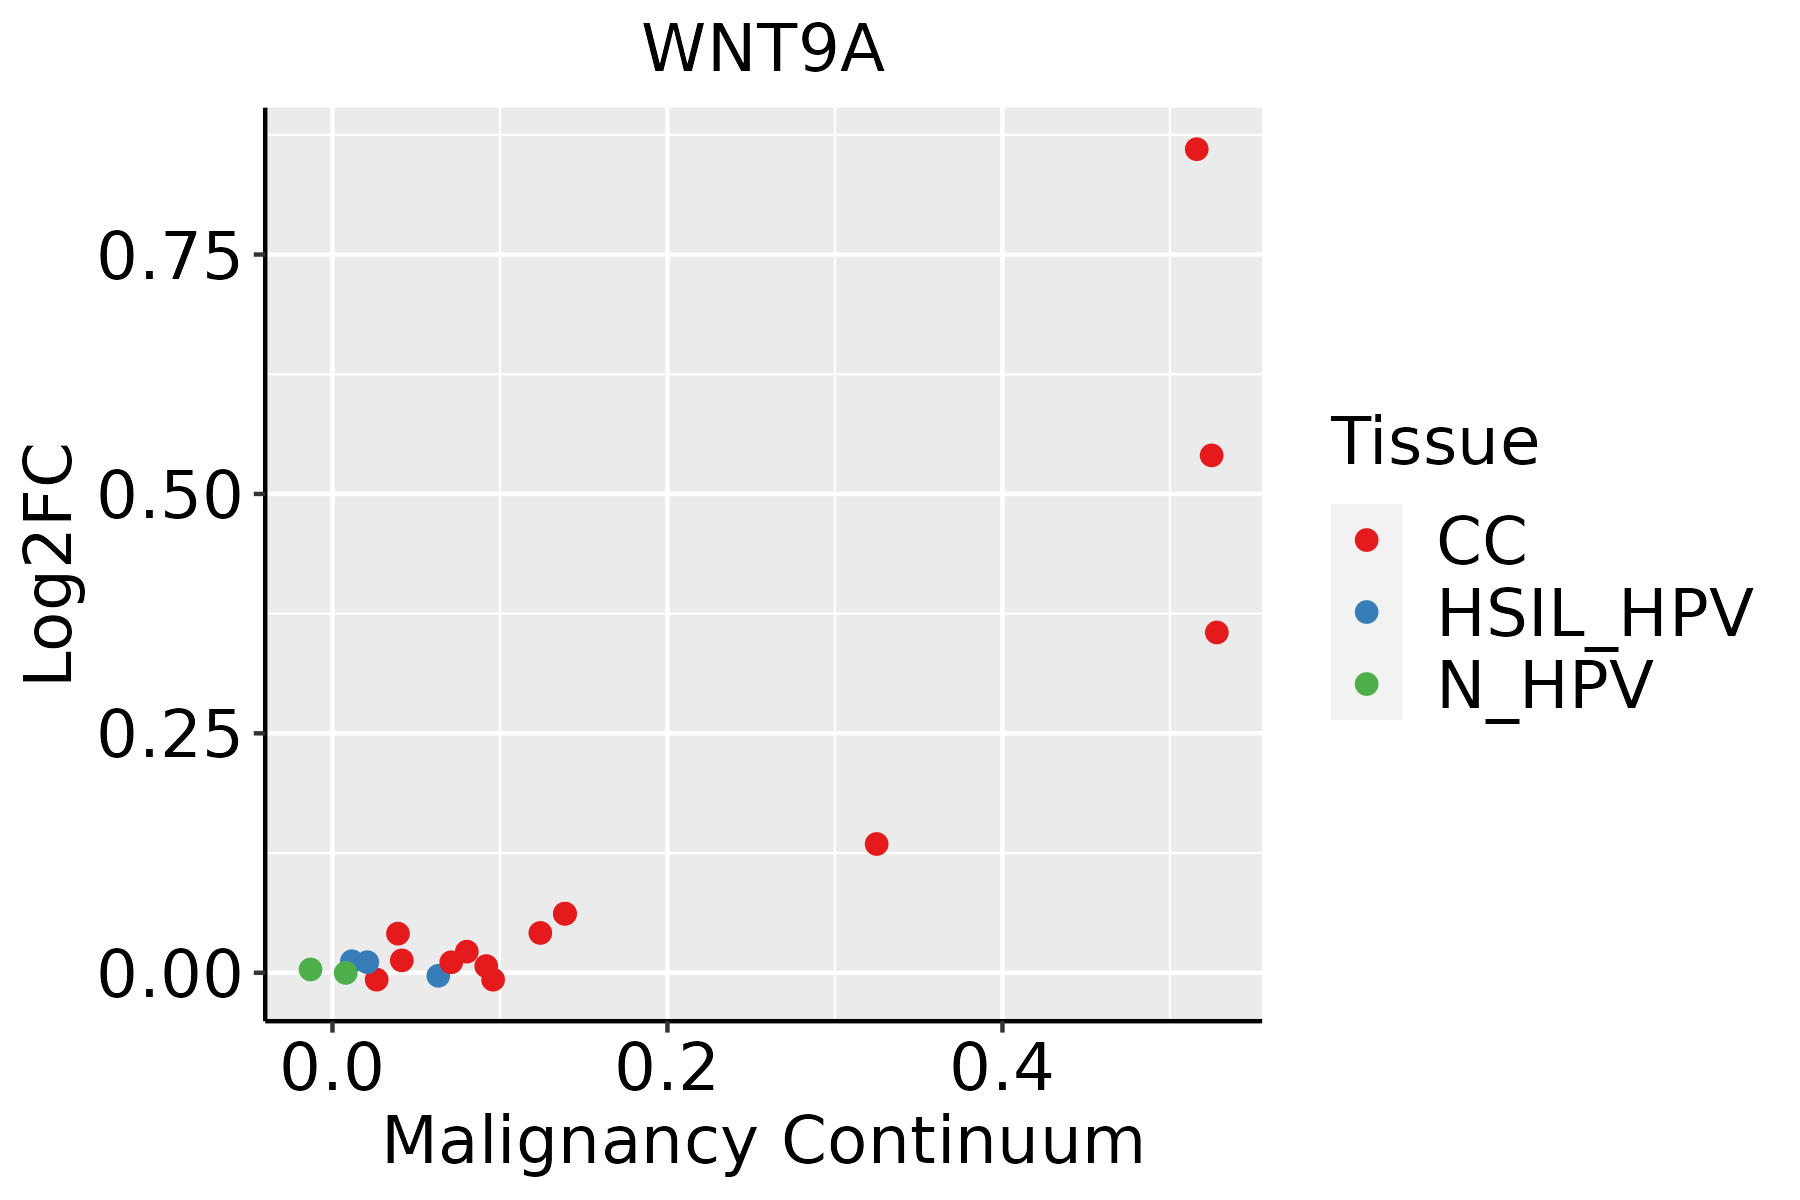 | CC: Cervix cancer |
| HSIL_HPV: HPV-infected high-grade squamous intraepithelial lesions | ||
| N_HPV: HPV-infected normal cervix |
| ∗log2FC in expression of this searched gene in stem-like cells from each diseased tissue sample relative to stem-like cells in normal samples in each tissue plotted against the malignancy continuum. Samples are colored based on if they are from different disease stage. |
Top |
Malignant transformation related pathway analysis |
| Find out the enriched GO biological processes and KEGG pathways involved in transition from healthy to precancer to cancer |
| Tissue | Disease Stage | Enriched GO biological Processes |
| Colorectum | AD |  |
| Colorectum | SER |  |
| Colorectum | MSS |  |
| Colorectum | MSI-H |  |
| Colorectum | FAP |  |
| ∗Top 15 enriched GO BP terms are showed in the bar plot of each disease state in each tissue. Each row represents a significant GO biological process which is colored according to the -log10(p.adjust). |
| Page: 1 2 3 4 5 6 7 8 9 |
| GO ID | Tissue | Disease Stage | Description | Gene Ratio | Bg Ratio | pvalue | p.adjust | Count |
| GO:00160557 | Cervix | CC | Wnt signaling pathway | 98/2311 | 444/18723 | 4.82e-09 | 4.65e-07 | 98 |
| GO:01987387 | Cervix | CC | cell-cell signaling by wnt | 98/2311 | 446/18723 | 6.16e-09 | 5.58e-07 | 98 |
| GO:00600707 | Cervix | CC | canonical Wnt signaling pathway | 66/2311 | 303/18723 | 2.47e-06 | 7.35e-05 | 66 |
| GO:0150063 | Cervix | CC | visual system development | 63/2311 | 375/18723 | 6.58e-03 | 3.65e-02 | 63 |
| GO:0001654 | Cervix | CC | eye development | 62/2311 | 371/18723 | 7.83e-03 | 4.13e-02 | 62 |
| GO:0048880 | Cervix | CC | sensory system development | 63/2311 | 381/18723 | 9.29e-03 | 4.66e-02 | 63 |
| Page: 1 |
| Pathway ID | Tissue | Disease Stage | Description | Gene Ratio | Bg Ratio | pvalue | p.adjust | qvalue | Count |
| hsa0501018 | Cervix | CC | Alzheimer disease | 113/1267 | 384/8465 | 9.67e-14 | 3.92e-12 | 2.32e-12 | 113 |
| hsa0502218 | Cervix | CC | Pathways of neurodegeneration - multiple diseases | 128/1267 | 476/8465 | 2.87e-12 | 9.29e-11 | 5.50e-11 | 128 |
| hsa0520516 | Cervix | CC | Proteoglycans in cancer | 60/1267 | 205/8465 | 9.13e-08 | 1.18e-06 | 7.00e-07 | 60 |
| hsa051657 | Cervix | CC | Human papillomavirus infection | 74/1267 | 331/8465 | 1.70e-04 | 1.02e-03 | 6.03e-04 | 74 |
| hsa043109 | Cervix | CC | Wnt signaling pathway | 43/1267 | 171/8465 | 3.03e-04 | 1.64e-03 | 9.68e-04 | 43 |
| hsa043908 | Cervix | CC | Hippo signaling pathway | 40/1267 | 157/8465 | 3.64e-04 | 1.82e-03 | 1.07e-03 | 40 |
| hsa0522510 | Cervix | CC | Hepatocellular carcinoma | 40/1267 | 168/8465 | 1.52e-03 | 6.39e-03 | 3.78e-03 | 40 |
| hsa05224 | Cervix | CC | Breast cancer | 32/1267 | 147/8465 | 1.66e-02 | 4.88e-02 | 2.88e-02 | 32 |
| hsa0501019 | Cervix | CC | Alzheimer disease | 113/1267 | 384/8465 | 9.67e-14 | 3.92e-12 | 2.32e-12 | 113 |
| hsa0502219 | Cervix | CC | Pathways of neurodegeneration - multiple diseases | 128/1267 | 476/8465 | 2.87e-12 | 9.29e-11 | 5.50e-11 | 128 |
| hsa0520517 | Cervix | CC | Proteoglycans in cancer | 60/1267 | 205/8465 | 9.13e-08 | 1.18e-06 | 7.00e-07 | 60 |
| hsa0516512 | Cervix | CC | Human papillomavirus infection | 74/1267 | 331/8465 | 1.70e-04 | 1.02e-03 | 6.03e-04 | 74 |
| hsa0431012 | Cervix | CC | Wnt signaling pathway | 43/1267 | 171/8465 | 3.03e-04 | 1.64e-03 | 9.68e-04 | 43 |
| hsa0439013 | Cervix | CC | Hippo signaling pathway | 40/1267 | 157/8465 | 3.64e-04 | 1.82e-03 | 1.07e-03 | 40 |
| hsa0522513 | Cervix | CC | Hepatocellular carcinoma | 40/1267 | 168/8465 | 1.52e-03 | 6.39e-03 | 3.78e-03 | 40 |
| hsa052241 | Cervix | CC | Breast cancer | 32/1267 | 147/8465 | 1.66e-02 | 4.88e-02 | 2.88e-02 | 32 |
| Page: 1 |
Top |
Cell-cell communication analysis |
| Identification of potential cell-cell interactions between two cell types and their ligand-receptor pairs for different disease states |
| Ligand | Receptor | LRpair | Pathway | Tissue | Disease Stage |
| WNT9A | FZD6_LRP5 | WNT9A_FZD6_LRP5 | WNT | Cervix | CC |
| WNT9A | FZD6_LRP6 | WNT9A_FZD6_LRP6 | WNT | Cervix | CC |
| WNT9A | FZD10_LRP6 | WNT9A_FZD10_LRP6 | WNT | Esophagus | ESCC |
| WNT9A | FZD3_LRP6 | WNT9A_FZD3_LRP6 | WNT | Esophagus | ESCC |
| WNT9A | FZD4_LRP6 | WNT9A_FZD4_LRP6 | WNT | Esophagus | ESCC |
| WNT9A | FZD5_LRP6 | WNT9A_FZD5_LRP6 | WNT | Esophagus | ESCC |
| WNT9A | FZD6_LRP6 | WNT9A_FZD6_LRP6 | WNT | Esophagus | ESCC |
| WNT9A | FZD8_LRP6 | WNT9A_FZD8_LRP6 | WNT | Esophagus | ESCC |
| Page: 1 |
Top |
Single-cell gene regulatory network inference analysis |
| Find out the significant the regulons (TFs) and the target genes of each regulon across cell types for different disease states |
| TF | Cell Type | Tissue | Disease Stage | Target Gene | RSS | Regulon Activity |
| ∗The dot plots of a searched regulon are shown for all cell subpopulations in each disease state of each tissue based on the regulon specific score inferred using pySCENIC and by calculating the average expression. |
| Page: 1 |
Top |
Somatic mutation of malignant transformation related genes |
| Annotation of somatic variants for genes involved in malignant transformation |
| Hugo Symbol | Variant Class | Variant Classification | dbSNP RS | HGVSc | HGVSp | HGVSp Short | SWISSPROT | BIOTYPE | SIFT | PolyPhen | Tumor Sample Barcode | Tissue | Histology | Sex | Age | Stage | Therapy Types | Drugs | Outcome |
| WNT9A | deletion | Frame_Shift_Del | novel | c.710delA | p.His237LeufsTer7 | p.H237Lfs*7 | O14904 | protein_coding | TCGA-EW-A2FV-01 | Breast | breast invasive carcinoma | Female | <65 | III/IV | Chemotherapy | docetaxel | SD | ||
| WNT9A | SNV | Missense_Mutation | rs773109746 | c.575N>A | p.Arg192Gln | p.R192Q | O14904 | protein_coding | deleterious(0.03) | benign(0.212) | TCGA-EA-A410-01 | Cervix | cervical & endocervical cancer | Female | <65 | I/II | Unknown | Unknown | SD |
| WNT9A | SNV | Missense_Mutation | rs747319229 | c.535G>A | p.Val179Ile | p.V179I | O14904 | protein_coding | tolerated(0.07) | benign(0.094) | TCGA-AA-3977-01 | Colorectum | colon adenocarcinoma | Male | >=65 | I/II | Unknown | Unknown | SD |
| WNT9A | SNV | Missense_Mutation | rs763194335 | c.208N>T | p.Arg70Cys | p.R70C | O14904 | protein_coding | deleterious(0) | probably_damaging(0.987) | TCGA-AA-3984-01 | Colorectum | colon adenocarcinoma | Female | <65 | I/II | Unknown | Unknown | SD |
| WNT9A | SNV | Missense_Mutation | novel | c.700G>A | p.Ala234Thr | p.A234T | O14904 | protein_coding | deleterious(0.02) | possibly_damaging(0.515) | TCGA-AA-A00N-01 | Colorectum | colon adenocarcinoma | Male | >=65 | I/II | Unknown | Unknown | PD |
| WNT9A | SNV | Missense_Mutation | rs768643974 | c.454G>A | p.Asp152Asn | p.D152N | O14904 | protein_coding | deleterious(0) | possibly_damaging(0.786) | TCGA-AA-A00N-01 | Colorectum | colon adenocarcinoma | Male | >=65 | I/II | Unknown | Unknown | PD |
| WNT9A | SNV | Missense_Mutation | rs761246906 | c.958G>A | p.Glu320Lys | p.E320K | O14904 | protein_coding | deleterious(0.01) | benign(0.244) | TCGA-AD-5900-01 | Colorectum | colon adenocarcinoma | Male | >=65 | I/II | Unknown | Unknown | SD |
| WNT9A | SNV | Missense_Mutation | rs768307025 | c.977N>A | p.Arg326His | p.R326H | O14904 | protein_coding | deleterious(0) | probably_damaging(1) | TCGA-AD-A5EJ-01 | Colorectum | colon adenocarcinoma | Female | >=65 | I/II | Unknown | Unknown | SD |
| WNT9A | SNV | Missense_Mutation | rs779996471 | c.841N>A | p.Asp281Asn | p.D281N | O14904 | protein_coding | tolerated(0.24) | possibly_damaging(0.506) | TCGA-CM-5349-01 | Colorectum | colon adenocarcinoma | Female | >=65 | I/II | Unknown | Unknown | SD |
| WNT9A | SNV | Missense_Mutation | c.505G>A | p.Gly169Arg | p.G169R | O14904 | protein_coding | deleterious(0) | probably_damaging(0.995) | TCGA-CM-6164-01 | Colorectum | colon adenocarcinoma | Female | <65 | I/II | Unknown | Unknown | SD |
| Page: 1 2 3 4 5 6 |
Top |
Related drugs of malignant transformation related genes |
| Identification of chemicals and drugs interact with genes involved in malignant transfromation |
| (DGIdb 4.0) |
| Entrez ID | Symbol | Category | Interaction Types | Drug Claim Name | Drug Name | PMIDs |
| Page: 1 |

Copyright 2023-Present -The University of Texas Health Science Center at Houston |