
|
|||||
|
 | |
| |
| |
| |
| |
| |
|
Gene: WNT7B |
Gene summary for WNT7B |
| Gene information | Species | Human | Gene symbol | WNT7B | Gene ID | 7477 |
| Gene name | Wnt family member 7B | |
| Gene Alias | WNT7B | |
| Cytomap | 22q13.31 | |
| Gene Type | protein-coding | GO ID | GO:0000003 | UniProtAcc | P56706 |
Top |
Malignant transformation analysis |
| Identification of the aberrant gene expression in precancerous and cancerous lesions by comparing the gene expression of stem-like cells in diseased tissues with normal stem cells |
| Entrez ID | Symbol | Replicates | Species | Organ | Tissue | Adj P-value | Log2FC | Malignancy |
| 7477 | WNT7B | LZE4T | Human | Esophagus | ESCC | 2.92e-09 | -4.24e-03 | 0.0811 |
| 7477 | WNT7B | LZE7T | Human | Esophagus | ESCC | 2.37e-02 | -3.99e-02 | 0.0667 |
| 7477 | WNT7B | LZE8T | Human | Esophagus | ESCC | 2.00e-03 | -2.73e-02 | 0.067 |
| 7477 | WNT7B | LZE20T | Human | Esophagus | ESCC | 6.77e-04 | -8.68e-03 | 0.0662 |
| 7477 | WNT7B | LZE22T | Human | Esophagus | ESCC | 2.98e-03 | 5.61e-03 | 0.068 |
| 7477 | WNT7B | LZE24T | Human | Esophagus | ESCC | 2.97e-07 | 3.12e-01 | 0.0596 |
| 7477 | WNT7B | LZE21T | Human | Esophagus | ESCC | 2.58e-03 | 4.23e-01 | 0.0655 |
| 7477 | WNT7B | P4T-E | Human | Esophagus | ESCC | 8.43e-14 | 1.41e-01 | 0.1323 |
| 7477 | WNT7B | P5T-E | Human | Esophagus | ESCC | 9.03e-05 | -1.10e-01 | 0.1327 |
| 7477 | WNT7B | P8T-E | Human | Esophagus | ESCC | 6.52e-12 | 2.33e-01 | 0.0889 |
| 7477 | WNT7B | P9T-E | Human | Esophagus | ESCC | 1.06e-15 | 4.95e-01 | 0.1131 |
| 7477 | WNT7B | P10T-E | Human | Esophagus | ESCC | 4.97e-61 | 1.20e+00 | 0.116 |
| 7477 | WNT7B | P11T-E | Human | Esophagus | ESCC | 3.54e-07 | 1.01e+00 | 0.1426 |
| 7477 | WNT7B | P12T-E | Human | Esophagus | ESCC | 2.81e-32 | 8.21e-01 | 0.1122 |
| 7477 | WNT7B | P15T-E | Human | Esophagus | ESCC | 5.00e-27 | 9.83e-01 | 0.1149 |
| 7477 | WNT7B | P17T-E | Human | Esophagus | ESCC | 7.81e-07 | 1.27e-01 | 0.1278 |
| 7477 | WNT7B | P20T-E | Human | Esophagus | ESCC | 4.37e-16 | 5.56e-01 | 0.1124 |
| 7477 | WNT7B | P21T-E | Human | Esophagus | ESCC | 1.93e-19 | 3.87e-01 | 0.1617 |
| 7477 | WNT7B | P22T-E | Human | Esophagus | ESCC | 8.88e-29 | 5.62e-01 | 0.1236 |
| 7477 | WNT7B | P23T-E | Human | Esophagus | ESCC | 6.89e-16 | 6.40e-01 | 0.108 |
| Page: 1 2 3 4 5 |
| Tissue | Expression Dynamics | Abbreviation |
| Esophagus | 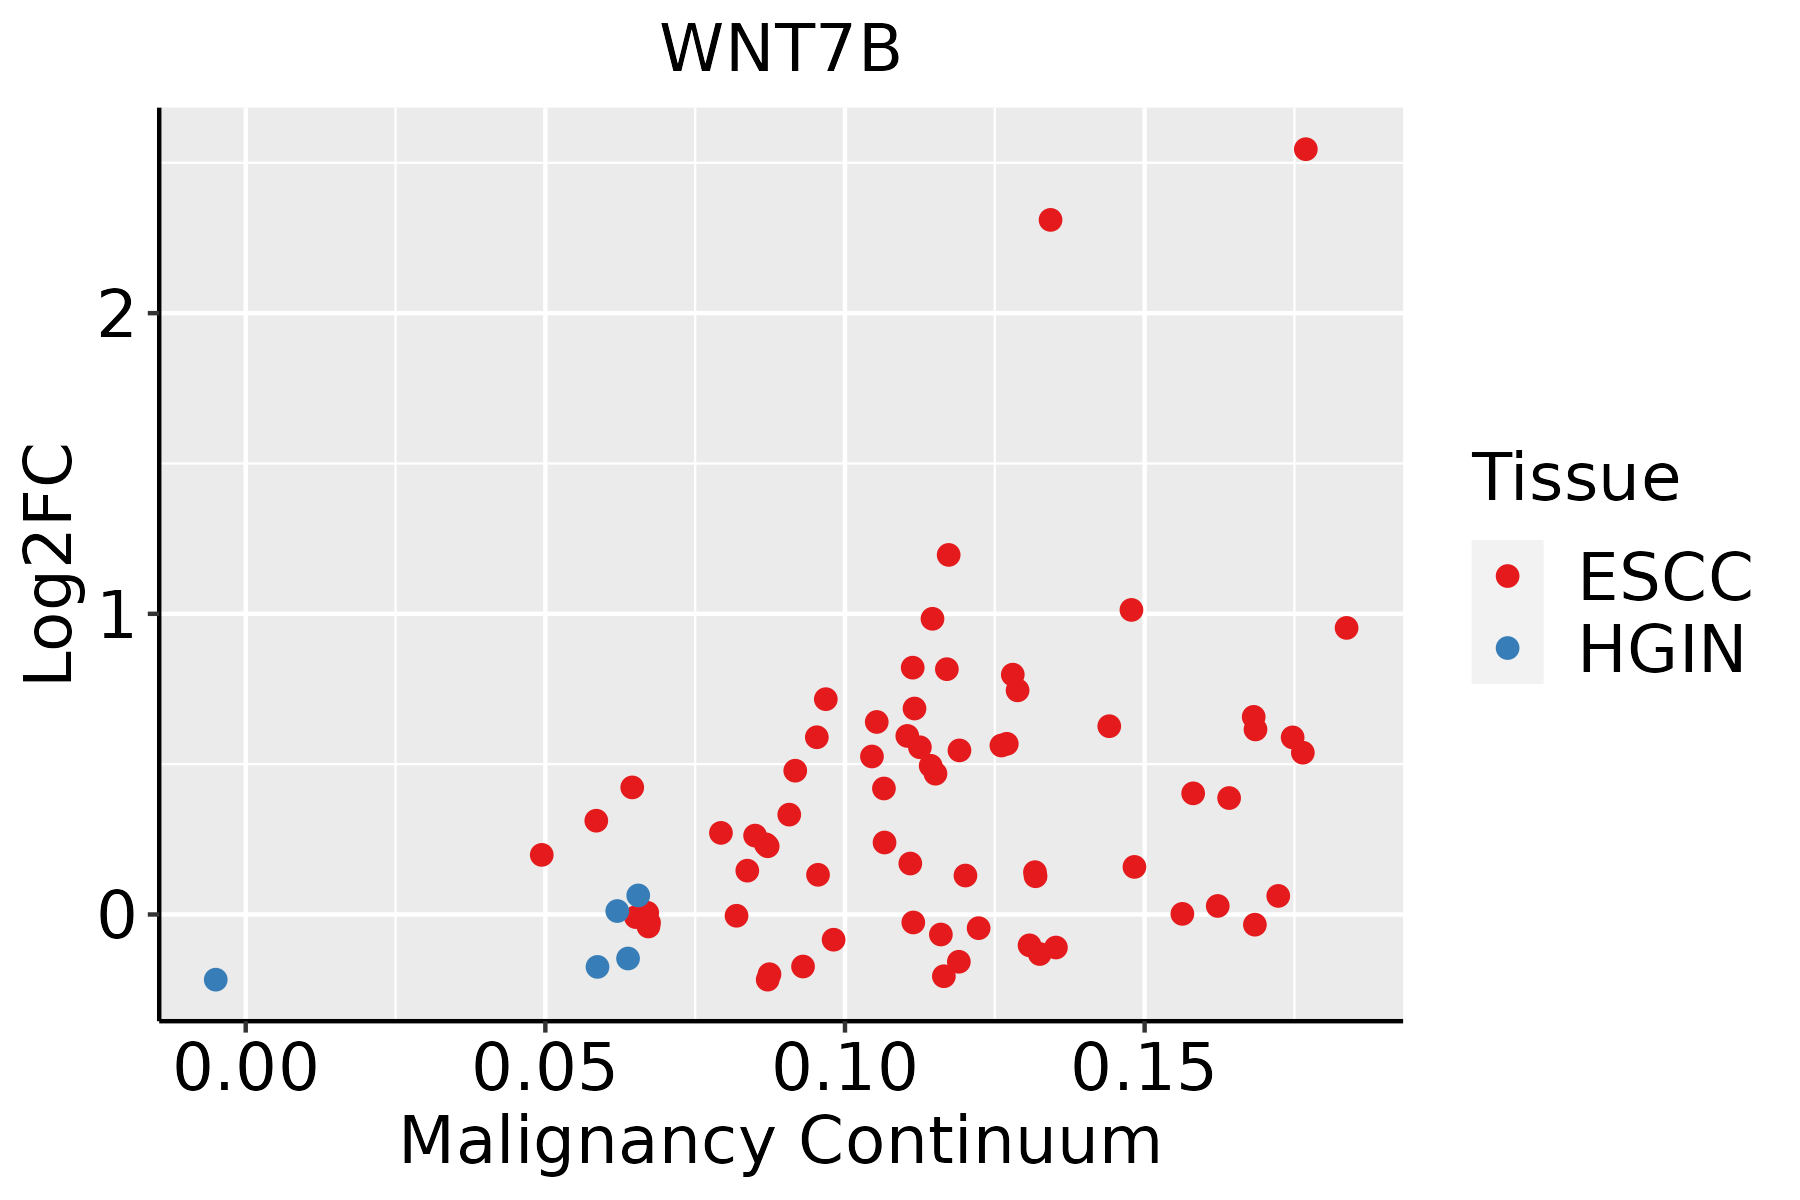 | ESCC: Esophageal squamous cell carcinoma |
| HGIN: High-grade intraepithelial neoplasias | ||
| LGIN: Low-grade intraepithelial neoplasias | ||
| Liver | 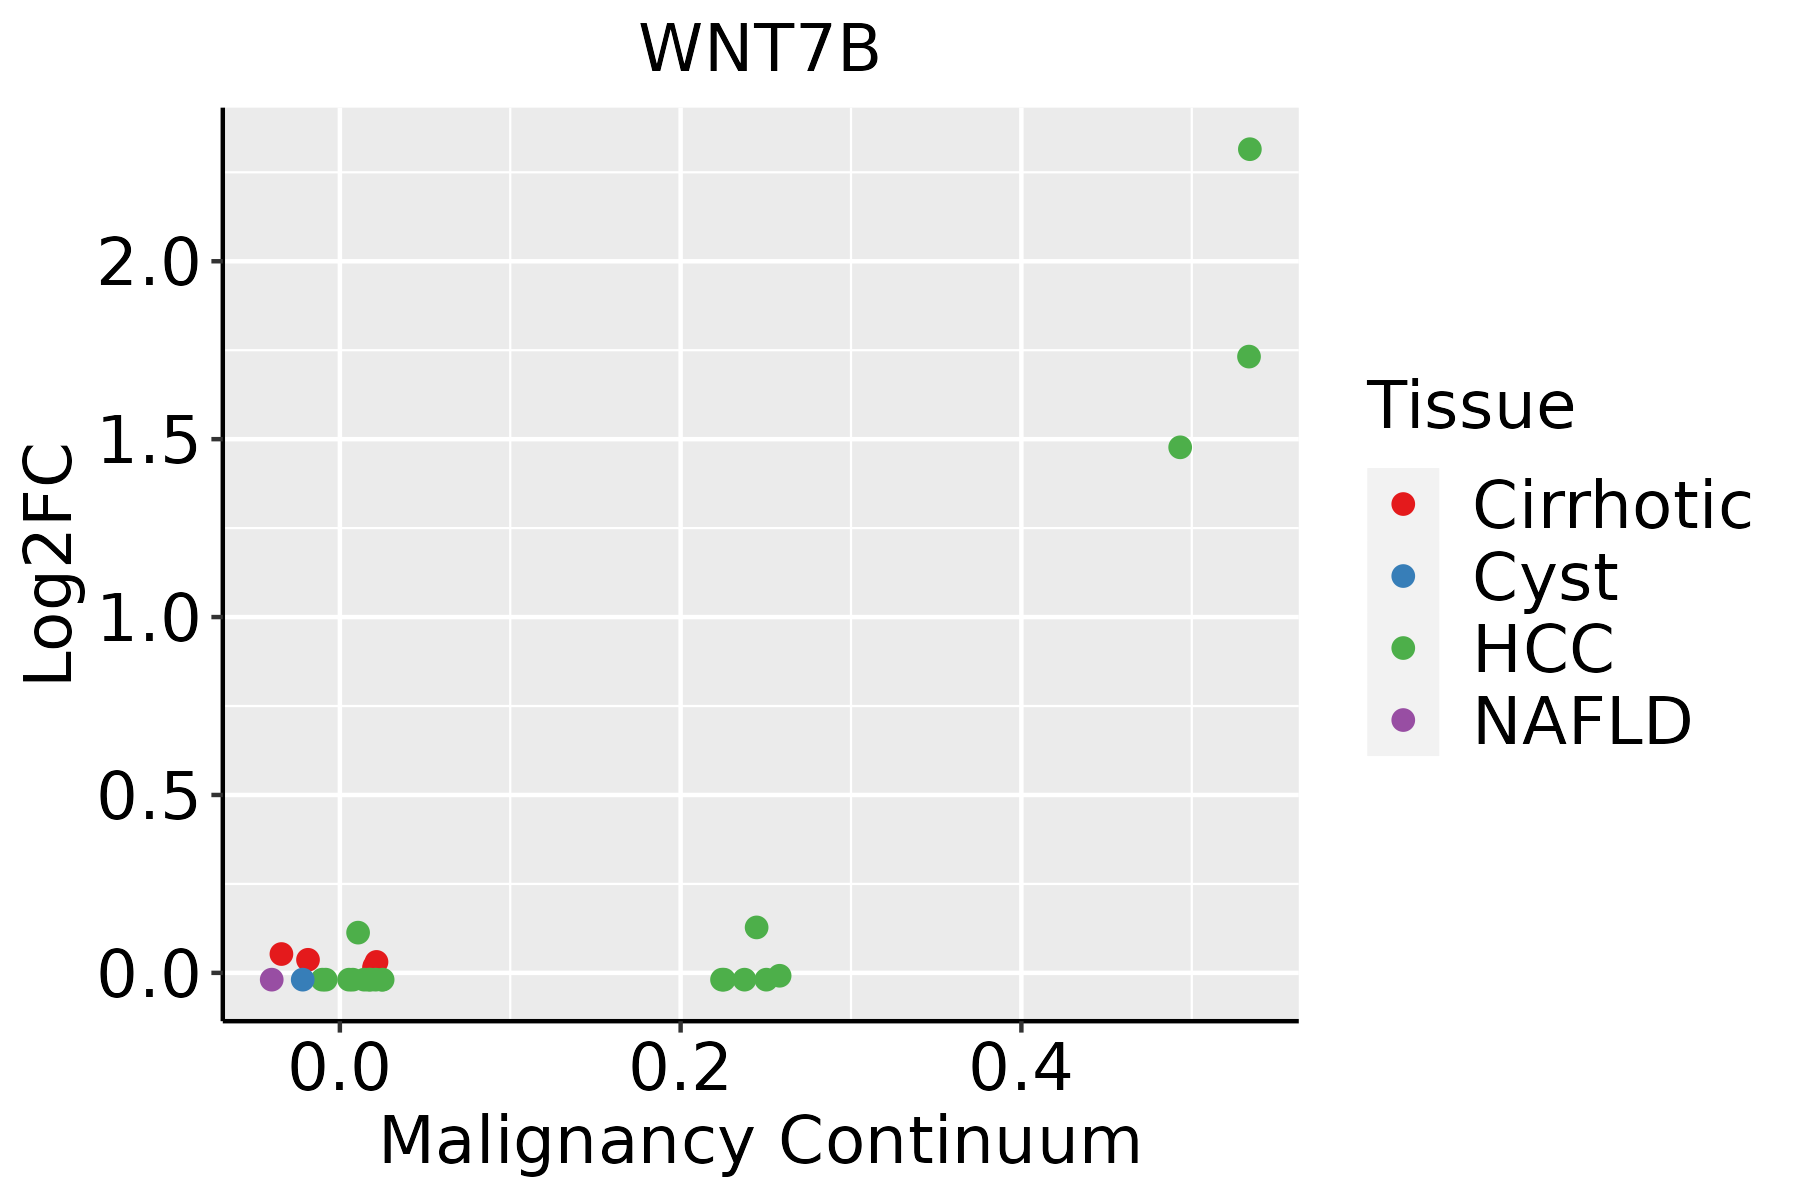 | HCC: Hepatocellular carcinoma |
| NAFLD: Non-alcoholic fatty liver disease | ||
| Oral Cavity |  | EOLP: Erosive Oral lichen planus |
| LP: leukoplakia | ||
| NEOLP: Non-erosive oral lichen planus | ||
| OSCC: Oral squamous cell carcinoma | ||
| Skin |  | AK: Actinic keratosis |
| cSCC: Cutaneous squamous cell carcinoma | ||
| SCCIS:squamous cell carcinoma in situ |
| ∗log2FC in expression of this searched gene in stem-like cells from each diseased tissue sample relative to stem-like cells in normal samples in each tissue plotted against the malignancy continuum. Samples are colored based on if they are from different disease stage. |
Top |
Malignant transformation related pathway analysis |
| Find out the enriched GO biological processes and KEGG pathways involved in transition from healthy to precancer to cancer |
| Tissue | Disease Stage | Enriched GO biological Processes |
| Colorectum | AD |  |
| Colorectum | SER |  |
| Colorectum | MSS |  |
| Colorectum | MSI-H |  |
| Colorectum | FAP |  |
| ∗Top 15 enriched GO BP terms are showed in the bar plot of each disease state in each tissue. Each row represents a significant GO biological process which is colored according to the -log10(p.adjust). |
| Page: 1 2 3 4 5 6 7 8 9 |
| GO ID | Tissue | Disease Stage | Description | Gene Ratio | Bg Ratio | pvalue | p.adjust | Count |
| GO:000170119 | Esophagus | ESCC | in utero embryonic development | 243/8552 | 367/18723 | 1.00e-15 | 6.86e-14 | 243 |
| GO:0048732111 | Esophagus | ESCC | gland development | 269/8552 | 436/18723 | 7.81e-12 | 2.95e-10 | 269 |
| GO:001605517 | Esophagus | ESCC | Wnt signaling pathway | 268/8552 | 444/18723 | 2.32e-10 | 6.58e-09 | 268 |
| GO:019873817 | Esophagus | ESCC | cell-cell signaling by wnt | 269/8552 | 446/18723 | 2.41e-10 | 6.79e-09 | 269 |
| GO:000716320 | Esophagus | ESCC | establishment or maintenance of cell polarity | 143/8552 | 218/18723 | 2.05e-09 | 4.65e-08 | 143 |
| GO:0001890110 | Esophagus | ESCC | placenta development | 98/8552 | 144/18723 | 4.46e-08 | 8.11e-07 | 98 |
| GO:0048545111 | Esophagus | ESCC | response to steroid hormone | 204/8552 | 339/18723 | 4.47e-08 | 8.11e-07 | 204 |
| GO:003253520 | Esophagus | ESCC | regulation of cellular component size | 227/8552 | 383/18723 | 4.77e-08 | 8.60e-07 | 227 |
| GO:003109818 | Esophagus | ESCC | stress-activated protein kinase signaling cascade | 154/8552 | 247/18723 | 8.53e-08 | 1.44e-06 | 154 |
| GO:00163316 | Esophagus | ESCC | morphogenesis of embryonic epithelium | 98/8552 | 147/18723 | 2.12e-07 | 3.27e-06 | 98 |
| GO:0061458110 | Esophagus | ESCC | reproductive system development | 247/8552 | 427/18723 | 2.24e-07 | 3.42e-06 | 247 |
| GO:004860818 | Esophagus | ESCC | reproductive structure development | 245/8552 | 424/18723 | 2.82e-07 | 4.14e-06 | 245 |
| GO:005140318 | Esophagus | ESCC | stress-activated MAPK cascade | 147/8552 | 239/18723 | 5.43e-07 | 7.18e-06 | 147 |
| GO:006007016 | Esophagus | ESCC | canonical Wnt signaling pathway | 180/8552 | 303/18723 | 9.15e-07 | 1.17e-05 | 180 |
| GO:000206420 | Esophagus | ESCC | epithelial cell development | 136/8552 | 220/18723 | 9.50e-07 | 1.21e-05 | 136 |
| GO:000164918 | Esophagus | ESCC | osteoblast differentiation | 140/8552 | 229/18723 | 1.63e-06 | 1.95e-05 | 140 |
| GO:000150317 | Esophagus | ESCC | ossification | 232/8552 | 408/18723 | 3.00e-06 | 3.40e-05 | 232 |
| GO:004814414 | Esophagus | ESCC | fibroblast proliferation | 57/8552 | 81/18723 | 5.83e-06 | 6.03e-05 | 57 |
| GO:00303239 | Esophagus | ESCC | respiratory tube development | 112/8552 | 181/18723 | 7.82e-06 | 7.69e-05 | 112 |
| GO:000189219 | Esophagus | ESCC | embryonic placenta development | 57/8552 | 82/18723 | 1.06e-05 | 1.01e-04 | 57 |
| Page: 1 2 3 4 5 6 7 8 9 |
| Pathway ID | Tissue | Disease Stage | Description | Gene Ratio | Bg Ratio | pvalue | p.adjust | qvalue | Count |
| hsa05022210 | Esophagus | ESCC | Pathways of neurodegeneration - multiple diseases | 318/4205 | 476/8465 | 6.10e-15 | 2.04e-13 | 1.05e-13 | 318 |
| hsa05010210 | Esophagus | ESCC | Alzheimer disease | 263/4205 | 384/8465 | 1.80e-14 | 5.47e-13 | 2.80e-13 | 263 |
| hsa0516510 | Esophagus | ESCC | Human papillomavirus infection | 215/4205 | 331/8465 | 7.86e-09 | 7.12e-08 | 3.65e-08 | 215 |
| hsa0520529 | Esophagus | ESCC | Proteoglycans in cancer | 138/4205 | 205/8465 | 1.79e-07 | 1.40e-06 | 7.15e-07 | 138 |
| hsa0522518 | Esophagus | ESCC | Hepatocellular carcinoma | 109/4205 | 168/8465 | 4.27e-05 | 1.88e-04 | 9.64e-05 | 109 |
| hsa041505 | Esophagus | ESCC | mTOR signaling pathway | 98/4205 | 156/8465 | 5.81e-04 | 1.95e-03 | 9.97e-04 | 98 |
| hsa0439018 | Esophagus | ESCC | Hippo signaling pathway | 92/4205 | 157/8465 | 1.46e-02 | 3.31e-02 | 1.69e-02 | 92 |
| hsa0502238 | Esophagus | ESCC | Pathways of neurodegeneration - multiple diseases | 318/4205 | 476/8465 | 6.10e-15 | 2.04e-13 | 1.05e-13 | 318 |
| hsa0501038 | Esophagus | ESCC | Alzheimer disease | 263/4205 | 384/8465 | 1.80e-14 | 5.47e-13 | 2.80e-13 | 263 |
| hsa0516515 | Esophagus | ESCC | Human papillomavirus infection | 215/4205 | 331/8465 | 7.86e-09 | 7.12e-08 | 3.65e-08 | 215 |
| hsa0520537 | Esophagus | ESCC | Proteoglycans in cancer | 138/4205 | 205/8465 | 1.79e-07 | 1.40e-06 | 7.15e-07 | 138 |
| hsa0522519 | Esophagus | ESCC | Hepatocellular carcinoma | 109/4205 | 168/8465 | 4.27e-05 | 1.88e-04 | 9.64e-05 | 109 |
| hsa0415013 | Esophagus | ESCC | mTOR signaling pathway | 98/4205 | 156/8465 | 5.81e-04 | 1.95e-03 | 9.97e-04 | 98 |
| hsa0439019 | Esophagus | ESCC | Hippo signaling pathway | 92/4205 | 157/8465 | 1.46e-02 | 3.31e-02 | 1.69e-02 | 92 |
| hsa0501022 | Liver | HCC | Alzheimer disease | 254/4020 | 384/8465 | 3.75e-14 | 8.97e-13 | 4.99e-13 | 254 |
| hsa0502222 | Liver | HCC | Pathways of neurodegeneration - multiple diseases | 298/4020 | 476/8465 | 6.59e-12 | 1.30e-10 | 7.22e-11 | 298 |
| hsa052258 | Liver | HCC | Hepatocellular carcinoma | 106/4020 | 168/8465 | 2.87e-05 | 1.85e-04 | 1.03e-04 | 106 |
| hsa051652 | Liver | HCC | Human papillomavirus infection | 188/4020 | 331/8465 | 3.34e-04 | 1.49e-03 | 8.29e-04 | 188 |
| hsa041502 | Liver | HCC | mTOR signaling pathway | 95/4020 | 156/8465 | 4.70e-04 | 1.99e-03 | 1.11e-03 | 95 |
| hsa0520521 | Liver | HCC | Proteoglycans in cancer | 121/4020 | 205/8465 | 5.22e-04 | 2.18e-03 | 1.21e-03 | 121 |
| Page: 1 2 3 |
Top |
Cell-cell communication analysis |
| Identification of potential cell-cell interactions between two cell types and their ligand-receptor pairs for different disease states |
| Ligand | Receptor | LRpair | Pathway | Tissue | Disease Stage |
| WNT7B | FZD4_LRP5 | WNT7B_FZD4_LRP5 | WNT | Cervix | ADJ |
| WNT7B | FZD6_LRP5 | WNT7B_FZD6_LRP5 | WNT | Cervix | ADJ |
| WNT7B | FZD10_LRP6 | WNT7B_FZD10_LRP6 | WNT | Esophagus | ESCC |
| WNT7B | FZD3_LRP6 | WNT7B_FZD3_LRP6 | WNT | Esophagus | ESCC |
| WNT7B | FZD4_LRP6 | WNT7B_FZD4_LRP6 | WNT | Esophagus | ESCC |
| WNT7B | FZD5_LRP6 | WNT7B_FZD5_LRP6 | WNT | Esophagus | ESCC |
| WNT7B | FZD6_LRP6 | WNT7B_FZD6_LRP6 | WNT | Esophagus | ESCC |
| WNT7B | FZD8_LRP6 | WNT7B_FZD8_LRP6 | WNT | Esophagus | ESCC |
| WNT7B | FZD4_LRP5 | WNT7B_FZD4_LRP5 | WNT | HNSCC | OSCC |
| WNT7B | FZD6_LRP5 | WNT7B_FZD6_LRP5 | WNT | HNSCC | OSCC |
| WNT7B | FZD6_LRP6 | WNT7B_FZD6_LRP6 | WNT | HNSCC | OSCC |
| WNT7B | FZD6_LRP5 | WNT7B_FZD6_LRP5 | WNT | HNSCC | Precancer |
| WNT7B | FZD6_LRP6 | WNT7B_FZD6_LRP6 | WNT | HNSCC | Precancer |
| Page: 1 |
Top |
Single-cell gene regulatory network inference analysis |
| Find out the significant the regulons (TFs) and the target genes of each regulon across cell types for different disease states |
| TF | Cell Type | Tissue | Disease Stage | Target Gene | RSS | Regulon Activity |
| ∗The dot plots of a searched regulon are shown for all cell subpopulations in each disease state of each tissue based on the regulon specific score inferred using pySCENIC and by calculating the average expression. |
| Page: 1 |
Top |
Somatic mutation of malignant transformation related genes |
| Annotation of somatic variants for genes involved in malignant transformation |
| Hugo Symbol | Variant Class | Variant Classification | dbSNP RS | HGVSc | HGVSp | HGVSp Short | SWISSPROT | BIOTYPE | SIFT | PolyPhen | Tumor Sample Barcode | Tissue | Histology | Sex | Age | Stage | Therapy Types | Drugs | Outcome |
| WNT7B | SNV | Missense_Mutation | rs765595378 | c.140N>A | p.Arg47Gln | p.R47Q | P56706 | protein_coding | tolerated(0.2) | possibly_damaging(0.69) | TCGA-BH-A18G-01 | Breast | breast invasive carcinoma | Female | >=65 | I/II | Unknown | Unknown | SD |
| WNT7B | deletion | Frame_Shift_Del | c.265_283delNNNNNNNNNNNNNNNNNNN | p.Glu89LysfsTer5 | p.E89Kfs*5 | P56706 | protein_coding | TCGA-BH-A0BZ-01 | Breast | breast invasive carcinoma | Female | <65 | III/IV | Chemotherapy | doxorubicin | CR | |||
| WNT7B | deletion | Frame_Shift_Del | novel | c.177delC | p.Ile60LeufsTer2 | p.I60Lfs*2 | P56706 | protein_coding | TCGA-D8-A27V-01 | Breast | breast invasive carcinoma | Female | <65 | I/II | Hormone Therapy | tamoxiphen | SD | ||
| WNT7B | SNV | Missense_Mutation | rs756644553 | c.595N>C | p.Glu199Gln | p.E199Q | P56706 | protein_coding | tolerated(0.07) | possibly_damaging(0.612) | TCGA-C5-A905-01 | Cervix | cervical & endocervical cancer | Female | <65 | I/II | Unknown | Unknown | SD |
| WNT7B | SNV | Missense_Mutation | c.574N>G | p.Leu192Val | p.L192V | P56706 | protein_coding | tolerated(0.77) | benign(0.057) | TCGA-IR-A3LA-01 | Cervix | cervical & endocervical cancer | Female | <65 | I/II | Chemotherapy | cisplatin | CR | |
| WNT7B | SNV | Missense_Mutation | c.433N>A | p.Glu145Lys | p.E145K | P56706 | protein_coding | tolerated(0.37) | benign(0.086) | TCGA-IR-A3LK-01 | Cervix | cervical & endocervical cancer | Female | >=65 | I/II | Chemotherapy | cisplatin | PD | |
| WNT7B | SNV | Missense_Mutation | novel | c.790N>G | p.Met264Val | p.M264V | P56706 | protein_coding | tolerated(0.29) | benign(0.001) | TCGA-VS-A9U6-01 | Cervix | cervical & endocervical cancer | Female | <65 | I/II | Chemotherapy | cisplatin | PD |
| WNT7B | SNV | Missense_Mutation | c.758N>A | p.Arg253His | p.R253H | P56706 | protein_coding | tolerated(0.06) | possibly_damaging(0.631) | TCGA-AA-3831-01 | Colorectum | colon adenocarcinoma | Male | >=65 | I/II | Unknown | Unknown | SD | |
| WNT7B | SNV | Missense_Mutation | rs746883964 | c.274N>A | p.Val92Ile | p.V92I | P56706 | protein_coding | tolerated(0.19) | benign(0.228) | TCGA-AA-3947-01 | Colorectum | colon adenocarcinoma | Female | <65 | I/II | Unknown | Unknown | SD |
| WNT7B | SNV | Missense_Mutation | rs773462729 | c.734N>A | p.Arg245His | p.R245H | P56706 | protein_coding | tolerated(0.07) | probably_damaging(0.997) | TCGA-F4-6856-01 | Colorectum | colon adenocarcinoma | Male | <65 | I/II | Ancillary | leucovorin | CR |
| Page: 1 2 3 4 |
Top |
Related drugs of malignant transformation related genes |
| Identification of chemicals and drugs interact with genes involved in malignant transfromation |
| (DGIdb 4.0) |
| Entrez ID | Symbol | Category | Interaction Types | Drug Claim Name | Drug Name | PMIDs |
| Page: 1 |

Copyright 2023-Present -The University of Texas Health Science Center at Houston |