
|
|||||
|
 | |
| |
| |
| |
| |
| |
|
Gene: WNT6 |
Gene summary for WNT6 |
| Gene information | Species | Human | Gene symbol | WNT6 | Gene ID | 7475 |
| Gene name | Wnt family member 6 | |
| Gene Alias | WNT6 | |
| Cytomap | 2q35 | |
| Gene Type | protein-coding | GO ID | GO:0001654 | UniProtAcc | Q8N2E5 |
Top |
Malignant transformation analysis |
| Identification of the aberrant gene expression in precancerous and cancerous lesions by comparing the gene expression of stem-like cells in diseased tissues with normal stem cells |
| Entrez ID | Symbol | Replicates | Species | Organ | Tissue | Adj P-value | Log2FC | Malignancy |
| 7475 | WNT6 | S014 | Human | Liver | HCC | 2.66e-13 | 5.70e-01 | 0.2254 |
| 7475 | WNT6 | S015 | Human | Liver | HCC | 1.42e-09 | 5.86e-01 | 0.2375 |
| 7475 | WNT6 | S016 | Human | Liver | HCC | 2.44e-19 | 6.99e-01 | 0.2243 |
| Page: 1 |
| Tissue | Expression Dynamics | Abbreviation |
| Liver | 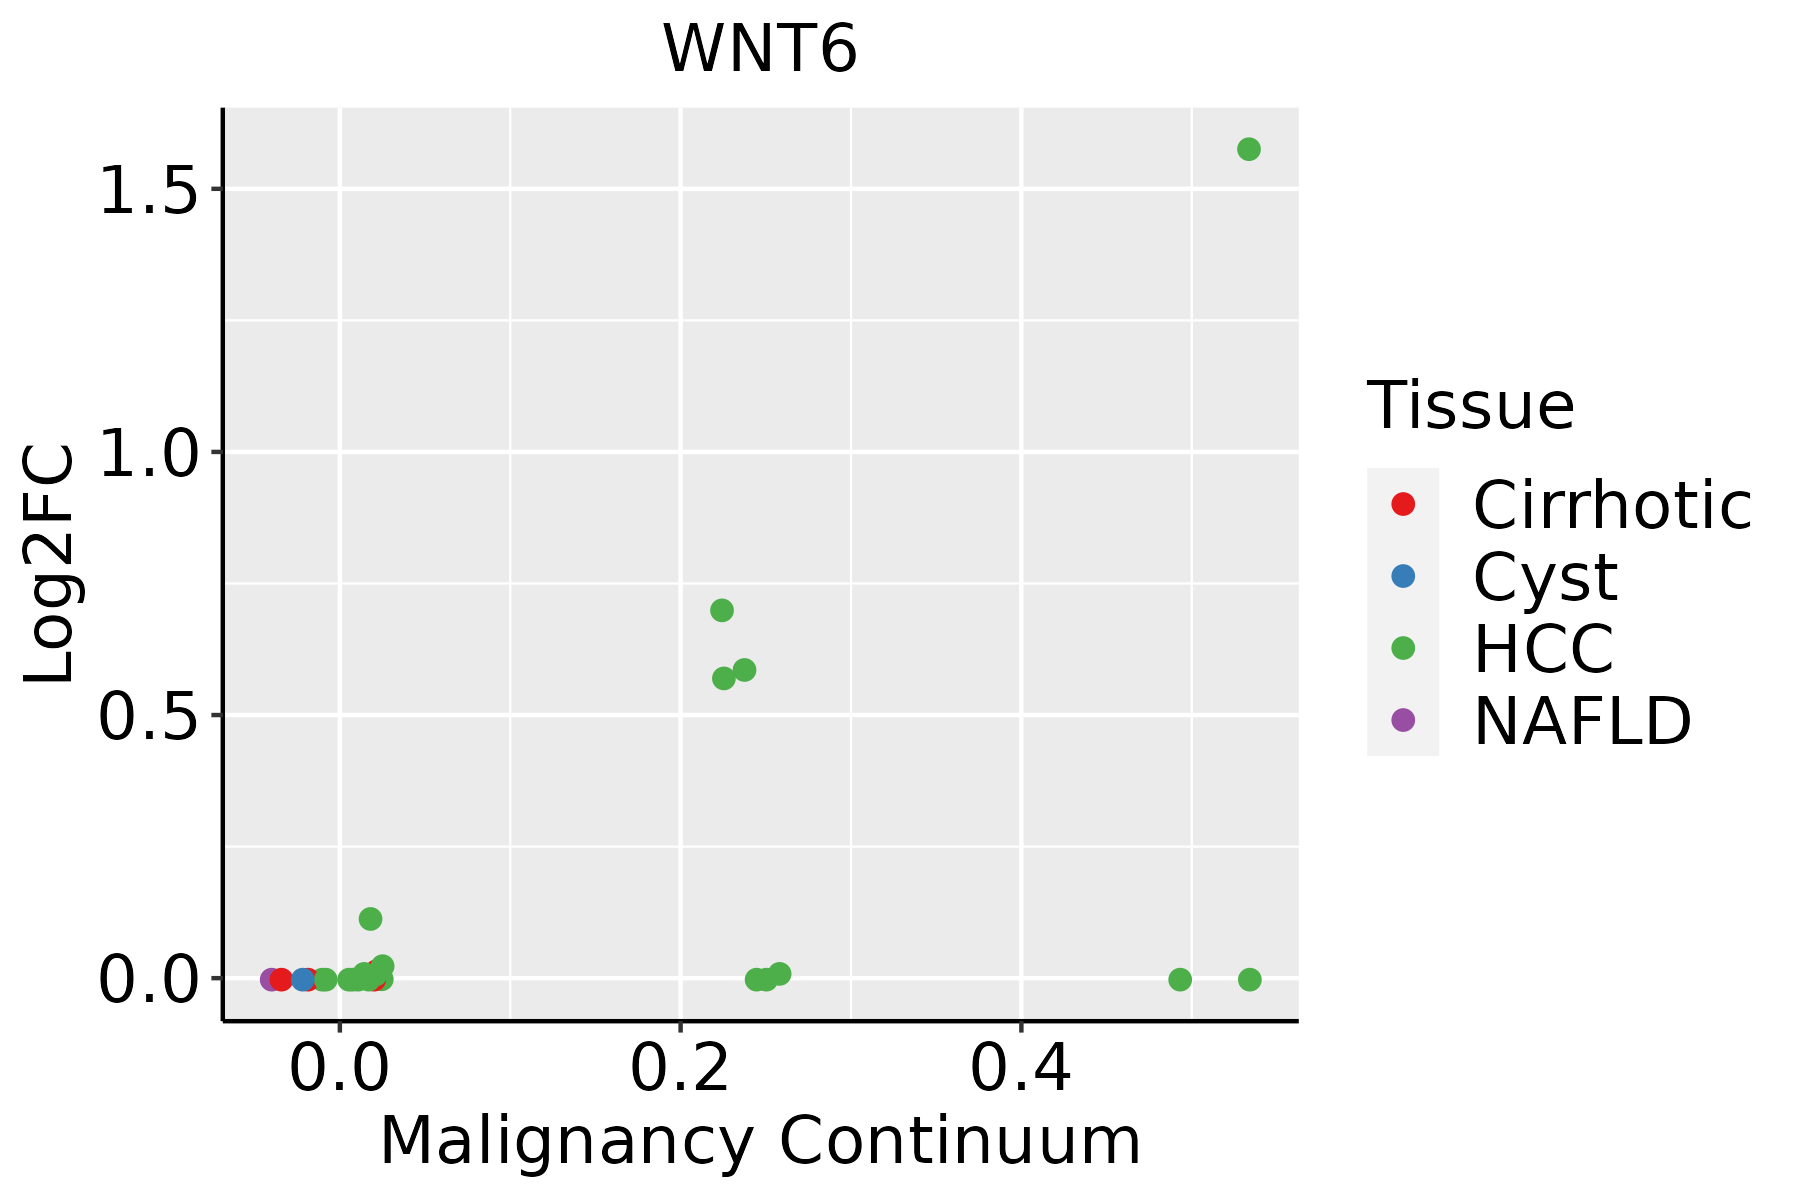 | HCC: Hepatocellular carcinoma |
| NAFLD: Non-alcoholic fatty liver disease |
| ∗log2FC in expression of this searched gene in stem-like cells from each diseased tissue sample relative to stem-like cells in normal samples in each tissue plotted against the malignancy continuum. Samples are colored based on if they are from different disease stage. |
Top |
Malignant transformation related pathway analysis |
| Find out the enriched GO biological processes and KEGG pathways involved in transition from healthy to precancer to cancer |
| Tissue | Disease Stage | Enriched GO biological Processes |
| Colorectum | AD |  |
| Colorectum | SER |  |
| Colorectum | MSS |  |
| Colorectum | MSI-H |  |
| Colorectum | FAP |  |
| ∗Top 15 enriched GO BP terms are showed in the bar plot of each disease state in each tissue. Each row represents a significant GO biological process which is colored according to the -log10(p.adjust). |
| Page: 1 2 3 4 5 6 7 8 9 |
| GO ID | Tissue | Disease Stage | Description | Gene Ratio | Bg Ratio | pvalue | p.adjust | Count |
| GO:019873821 | Liver | HCC | cell-cell signaling by wnt | 247/7958 | 446/18723 | 2.11e-08 | 4.96e-07 | 247 |
| GO:001605521 | Liver | HCC | Wnt signaling pathway | 245/7958 | 444/18723 | 3.68e-08 | 8.09e-07 | 245 |
| GO:006007021 | Liver | HCC | canonical Wnt signaling pathway | 162/7958 | 303/18723 | 7.00e-05 | 6.32e-04 | 162 |
| GO:00016553 | Liver | HCC | urogenital system development | 170/7958 | 338/18723 | 2.15e-03 | 1.08e-02 | 170 |
| GO:00018222 | Liver | HCC | kidney development | 148/7958 | 293/18723 | 3.25e-03 | 1.49e-02 | 148 |
| GO:00720012 | Liver | HCC | renal system development | 152/7958 | 302/18723 | 3.45e-03 | 1.56e-02 | 152 |
| GO:00018384 | Liver | HCC | embryonic epithelial tube formation | 66/7958 | 121/18723 | 4.94e-03 | 2.07e-02 | 66 |
| GO:00721754 | Liver | HCC | epithelial tube formation | 70/7958 | 132/18723 | 9.29e-03 | 3.57e-02 | 70 |
| GO:00351484 | Liver | HCC | tube formation | 77/7958 | 148/18723 | 1.20e-02 | 4.39e-02 | 77 |
| Page: 1 |
| Pathway ID | Tissue | Disease Stage | Description | Gene Ratio | Bg Ratio | pvalue | p.adjust | qvalue | Count |
| hsa0501022 | Liver | HCC | Alzheimer disease | 254/4020 | 384/8465 | 3.75e-14 | 8.97e-13 | 4.99e-13 | 254 |
| hsa0502222 | Liver | HCC | Pathways of neurodegeneration - multiple diseases | 298/4020 | 476/8465 | 6.59e-12 | 1.30e-10 | 7.22e-11 | 298 |
| hsa052258 | Liver | HCC | Hepatocellular carcinoma | 106/4020 | 168/8465 | 2.87e-05 | 1.85e-04 | 1.03e-04 | 106 |
| hsa051652 | Liver | HCC | Human papillomavirus infection | 188/4020 | 331/8465 | 3.34e-04 | 1.49e-03 | 8.29e-04 | 188 |
| hsa041502 | Liver | HCC | mTOR signaling pathway | 95/4020 | 156/8465 | 4.70e-04 | 1.99e-03 | 1.11e-03 | 95 |
| hsa0520521 | Liver | HCC | Proteoglycans in cancer | 121/4020 | 205/8465 | 5.22e-04 | 2.18e-03 | 1.21e-03 | 121 |
| hsa0501032 | Liver | HCC | Alzheimer disease | 254/4020 | 384/8465 | 3.75e-14 | 8.97e-13 | 4.99e-13 | 254 |
| hsa0502232 | Liver | HCC | Pathways of neurodegeneration - multiple diseases | 298/4020 | 476/8465 | 6.59e-12 | 1.30e-10 | 7.22e-11 | 298 |
| hsa0522511 | Liver | HCC | Hepatocellular carcinoma | 106/4020 | 168/8465 | 2.87e-05 | 1.85e-04 | 1.03e-04 | 106 |
| hsa051653 | Liver | HCC | Human papillomavirus infection | 188/4020 | 331/8465 | 3.34e-04 | 1.49e-03 | 8.29e-04 | 188 |
| hsa0415011 | Liver | HCC | mTOR signaling pathway | 95/4020 | 156/8465 | 4.70e-04 | 1.99e-03 | 1.11e-03 | 95 |
| hsa0520531 | Liver | HCC | Proteoglycans in cancer | 121/4020 | 205/8465 | 5.22e-04 | 2.18e-03 | 1.21e-03 | 121 |
| Page: 1 |
Top |
Cell-cell communication analysis |
| Identification of potential cell-cell interactions between two cell types and their ligand-receptor pairs for different disease states |
| Ligand | Receptor | LRpair | Pathway | Tissue | Disease Stage |
| WNT6 | FZD6_LRP6 | WNT6_FZD6_LRP6 | WNT | Skin | cSCC |
| Page: 1 |
Top |
Single-cell gene regulatory network inference analysis |
| Find out the significant the regulons (TFs) and the target genes of each regulon across cell types for different disease states |
| TF | Cell Type | Tissue | Disease Stage | Target Gene | RSS | Regulon Activity |
| ∗The dot plots of a searched regulon are shown for all cell subpopulations in each disease state of each tissue based on the regulon specific score inferred using pySCENIC and by calculating the average expression. |
| Page: 1 |
Top |
Somatic mutation of malignant transformation related genes |
| Annotation of somatic variants for genes involved in malignant transformation |
| Hugo Symbol | Variant Class | Variant Classification | dbSNP RS | HGVSc | HGVSp | HGVSp Short | SWISSPROT | BIOTYPE | SIFT | PolyPhen | Tumor Sample Barcode | Tissue | Histology | Sex | Age | Stage | Therapy Types | Drugs | Outcome |
| WNT6 | SNV | Missense_Mutation | c.520G>A | p.Asp174Asn | p.D174N | Q9Y6F9 | protein_coding | deleterious(0) | possibly_damaging(0.881) | TCGA-BH-A0DG-01 | Breast | breast invasive carcinoma | Female | <65 | I/II | Chemotherapy | taxotere | CR | |
| WNT6 | SNV | Missense_Mutation | c.242N>A | p.Arg81His | p.R81H | Q9Y6F9 | protein_coding | deleterious(0.04) | probably_damaging(0.997) | TCGA-BH-A0HW-01 | Breast | breast invasive carcinoma | Female | <65 | I/II | Chemotherapy | doxorubicin | SD | |
| WNT6 | insertion | Nonsense_Mutation | novel | c.157_158insCTGCCTTCACCTTGAGTAAAATTTCTATAAGAATTT | p.Glu53delinsAlaAlaPheThrLeuSerLysIleSerIleArgIleTer | p.E53delinsAAFTLSKISIRI* | Q9Y6F9 | protein_coding | TCGA-A7-A0CG-01 | Breast | breast invasive carcinoma | Female | >=65 | I/II | Unknown | Unknown | SD | ||
| WNT6 | SNV | Missense_Mutation | c.701N>A | p.Arg234His | p.R234H | Q9Y6F9 | protein_coding | deleterious(0.02) | possibly_damaging(0.88) | TCGA-A6-6780-01 | Colorectum | colon adenocarcinoma | Male | >=65 | I/II | Unknown | Unknown | SD | |
| WNT6 | SNV | Missense_Mutation | rs375682009 | c.488G>A | p.Gly163Asp | p.G163D | Q9Y6F9 | protein_coding | tolerated(0.36) | benign(0) | TCGA-CK-5916-01 | Colorectum | colon adenocarcinoma | Female | >=65 | I/II | Unknown | Unknown | PD |
| WNT6 | SNV | Missense_Mutation | c.518G>A | p.Gly173Asp | p.G173D | Q9Y6F9 | protein_coding | tolerated(0.08) | possibly_damaging(0.9) | TCGA-F4-6856-01 | Colorectum | colon adenocarcinoma | Male | <65 | I/II | Ancillary | leucovorin | CR | |
| WNT6 | SNV | Missense_Mutation | rs766635655 | c.136C>T | p.Arg46Trp | p.R46W | Q9Y6F9 | protein_coding | deleterious(0) | probably_damaging(0.986) | TCGA-AG-A026-01 | Colorectum | rectum adenocarcinoma | Male | >=65 | I/II | Unknown | Unknown | PD |
| WNT6 | SNV | Missense_Mutation | novel | c.185N>C | p.Val62Ala | p.V62A | Q9Y6F9 | protein_coding | deleterious(0) | probably_damaging(0.989) | TCGA-A5-A0G2-01 | Endometrium | uterine corpus endometrioid carcinoma | Female | <65 | III/IV | Unknown | Unknown | SD |
| WNT6 | SNV | Missense_Mutation | novel | c.152N>T | p.Gln51Leu | p.Q51L | Q9Y6F9 | protein_coding | tolerated(1) | probably_damaging(0.982) | TCGA-B5-A1MW-01 | Endometrium | uterine corpus endometrioid carcinoma | Female | <65 | I/II | Unknown | Unknown | PD |
| WNT6 | SNV | Missense_Mutation | c.586G>A | p.Gly196Arg | p.G196R | Q9Y6F9 | protein_coding | deleterious(0.02) | benign(0.25) | TCGA-D1-A15X-01 | Endometrium | uterine corpus endometrioid carcinoma | Female | <65 | I/II | Unknown | Unknown | SD |
| Page: 1 2 3 |
Top |
Related drugs of malignant transformation related genes |
| Identification of chemicals and drugs interact with genes involved in malignant transfromation |
| (DGIdb 4.0) |
| Entrez ID | Symbol | Category | Interaction Types | Drug Claim Name | Drug Name | PMIDs |
| Page: 1 |

Copyright 2023-Present -The University of Texas Health Science Center at Houston |