
|
|||||
|
 | |
| |
| |
| |
| |
| |
|
Gene: WNT4 |
Gene summary for WNT4 |
| Gene information | Species | Human | Gene symbol | WNT4 | Gene ID | 54361 |
| Gene name | Wnt family member 4 | |
| Gene Alias | SERKAL | |
| Cytomap | 1p36.12 | |
| Gene Type | protein-coding | GO ID | GO:0000003 | UniProtAcc | P56705 |
Top |
Malignant transformation analysis |
| Identification of the aberrant gene expression in precancerous and cancerous lesions by comparing the gene expression of stem-like cells in diseased tissues with normal stem cells |
| Entrez ID | Symbol | Replicates | Species | Organ | Tissue | Adj P-value | Log2FC | Malignancy |
| 54361 | WNT4 | C30 | Human | Oral cavity | OSCC | 1.34e-08 | 7.41e-01 | 0.3055 |
| 54361 | WNT4 | C43 | Human | Oral cavity | OSCC | 4.94e-08 | 2.25e-01 | 0.1704 |
| 54361 | WNT4 | C51 | Human | Oral cavity | OSCC | 1.33e-11 | 8.69e-01 | 0.2674 |
| 54361 | WNT4 | SYSMH2 | Human | Oral cavity | OSCC | 4.95e-10 | 4.70e-01 | 0.2326 |
| 54361 | WNT4 | SYSMH3 | Human | Oral cavity | OSCC | 2.39e-37 | 1.34e+00 | 0.2442 |
| 54361 | WNT4 | SYSMH4 | Human | Oral cavity | OSCC | 2.58e-05 | 6.66e-02 | 0.1226 |
| 54361 | WNT4 | SYSMH5 | Human | Oral cavity | OSCC | 1.52e-07 | 5.73e-01 | 0.0647 |
| 54361 | WNT4 | P1_S1_AK | Human | Skin | AK | 1.01e-08 | 2.43e-01 | -0.3399 |
| 54361 | WNT4 | P2_S3_AK | Human | Skin | AK | 8.09e-18 | 4.11e-01 | -0.3287 |
| 54361 | WNT4 | P2_S4_SCCIS | Human | Skin | SCCIS | 6.41e-11 | 4.24e-01 | -0.3043 |
| 54361 | WNT4 | P3_S6_AK | Human | Skin | AK | 1.84e-05 | 3.03e-01 | -0.3256 |
| 54361 | WNT4 | P4_S8_cSCC | Human | Skin | cSCC | 1.30e-23 | 6.44e-01 | -0.3095 |
| 54361 | WNT4 | P5_S10_cSCC | Human | Skin | cSCC | 1.00e-21 | 3.76e-01 | -0.299 |
| 54361 | WNT4 | P1_cSCC | Human | Skin | cSCC | 1.23e-09 | 6.43e-01 | 0.0292 |
| 54361 | WNT4 | P2_cSCC | Human | Skin | cSCC | 4.55e-06 | 3.35e-01 | -0.024 |
| 54361 | WNT4 | P4_cSCC | Human | Skin | cSCC | 1.29e-30 | 6.09e-01 | -0.00290000000000005 |
| 54361 | WNT4 | P10_cSCC | Human | Skin | cSCC | 3.86e-09 | 4.67e-01 | 0.1017 |
| 54361 | WNT4 | cSCC_p10 | Human | Skin | cSCC | 2.35e-13 | 3.76e-01 | -0.2095 |
| 54361 | WNT4 | cSCC_p11 | Human | Skin | cSCC | 5.59e-18 | 3.62e-01 | -0.2102 |
| 54361 | WNT4 | cSCC_p4 | Human | Skin | cSCC | 3.92e-06 | 1.66e-01 | -0.2022 |
| Page: 1 2 |
| Tissue | Expression Dynamics | Abbreviation |
| Oral Cavity | 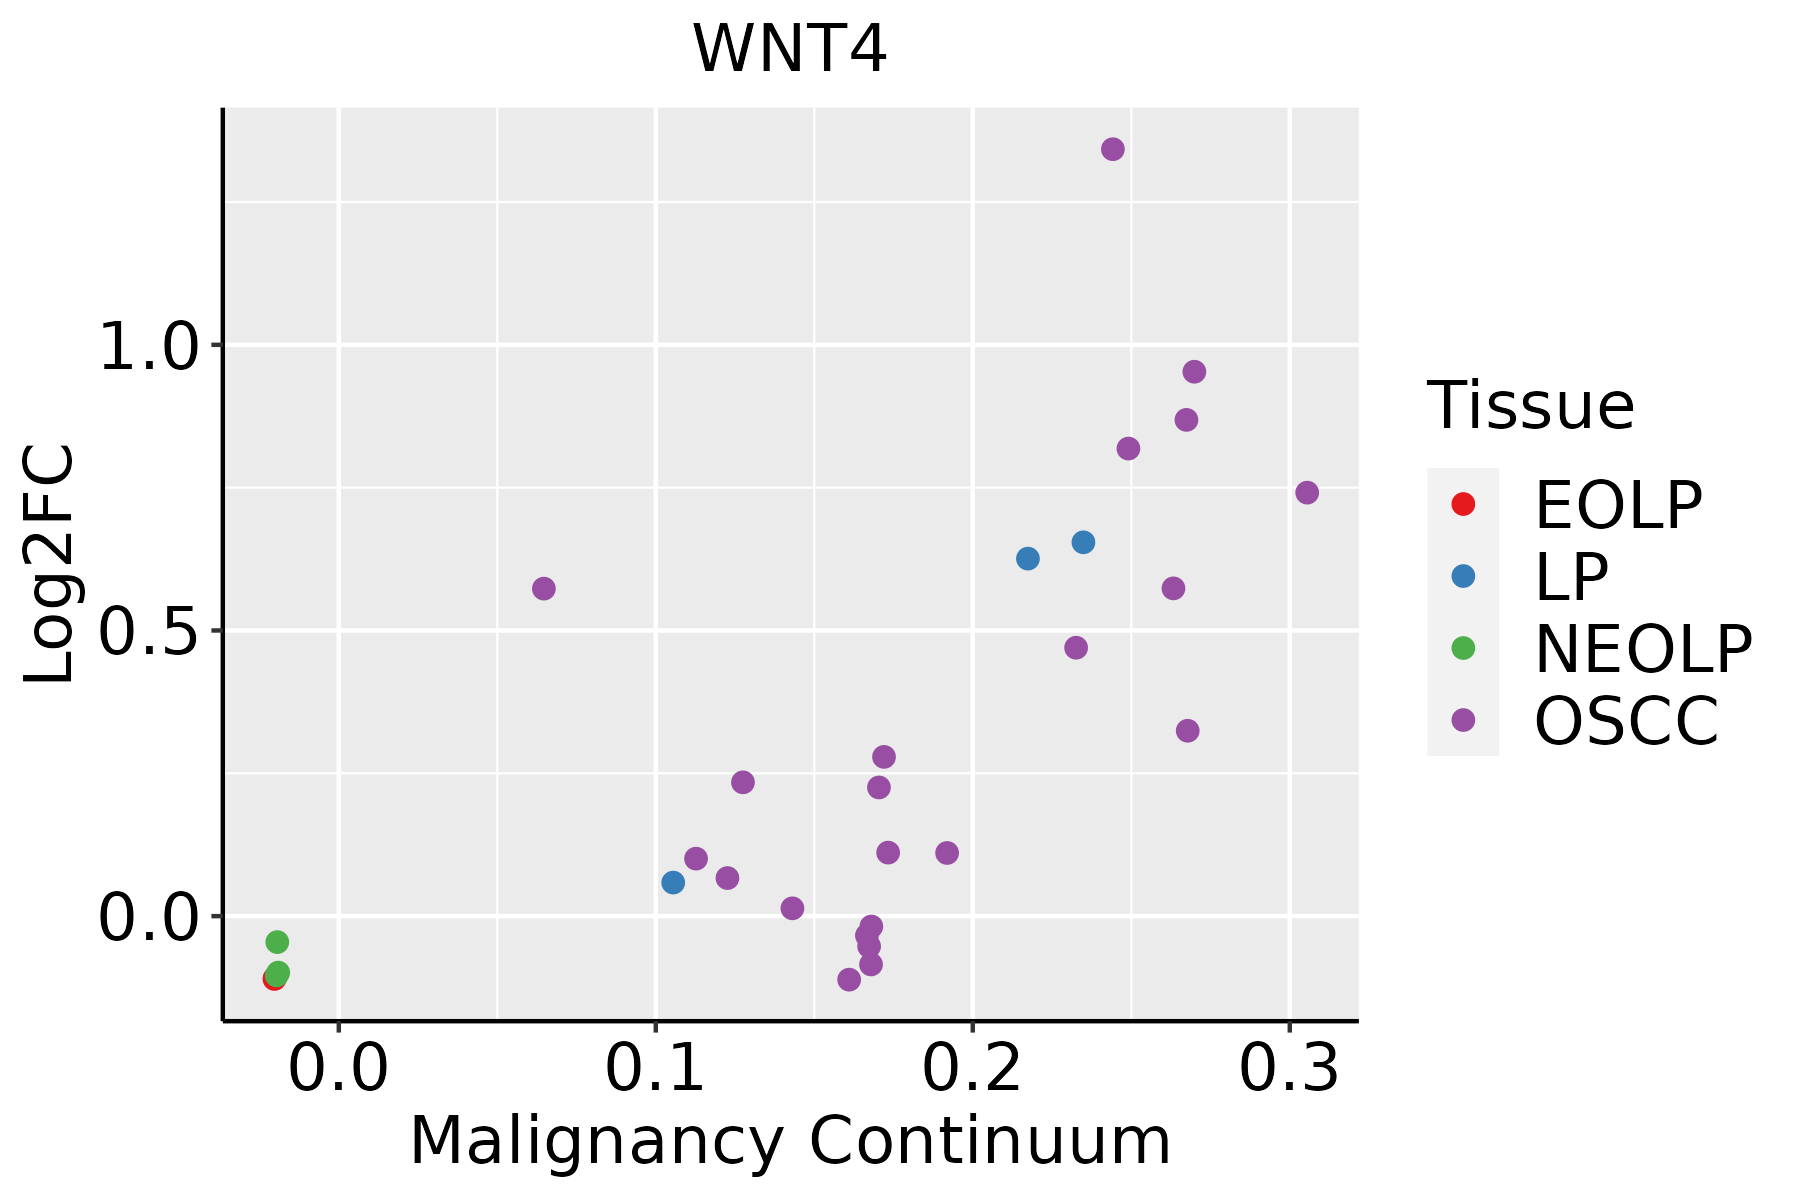 | EOLP: Erosive Oral lichen planus |
| LP: leukoplakia | ||
| NEOLP: Non-erosive oral lichen planus | ||
| OSCC: Oral squamous cell carcinoma | ||
| Skin | 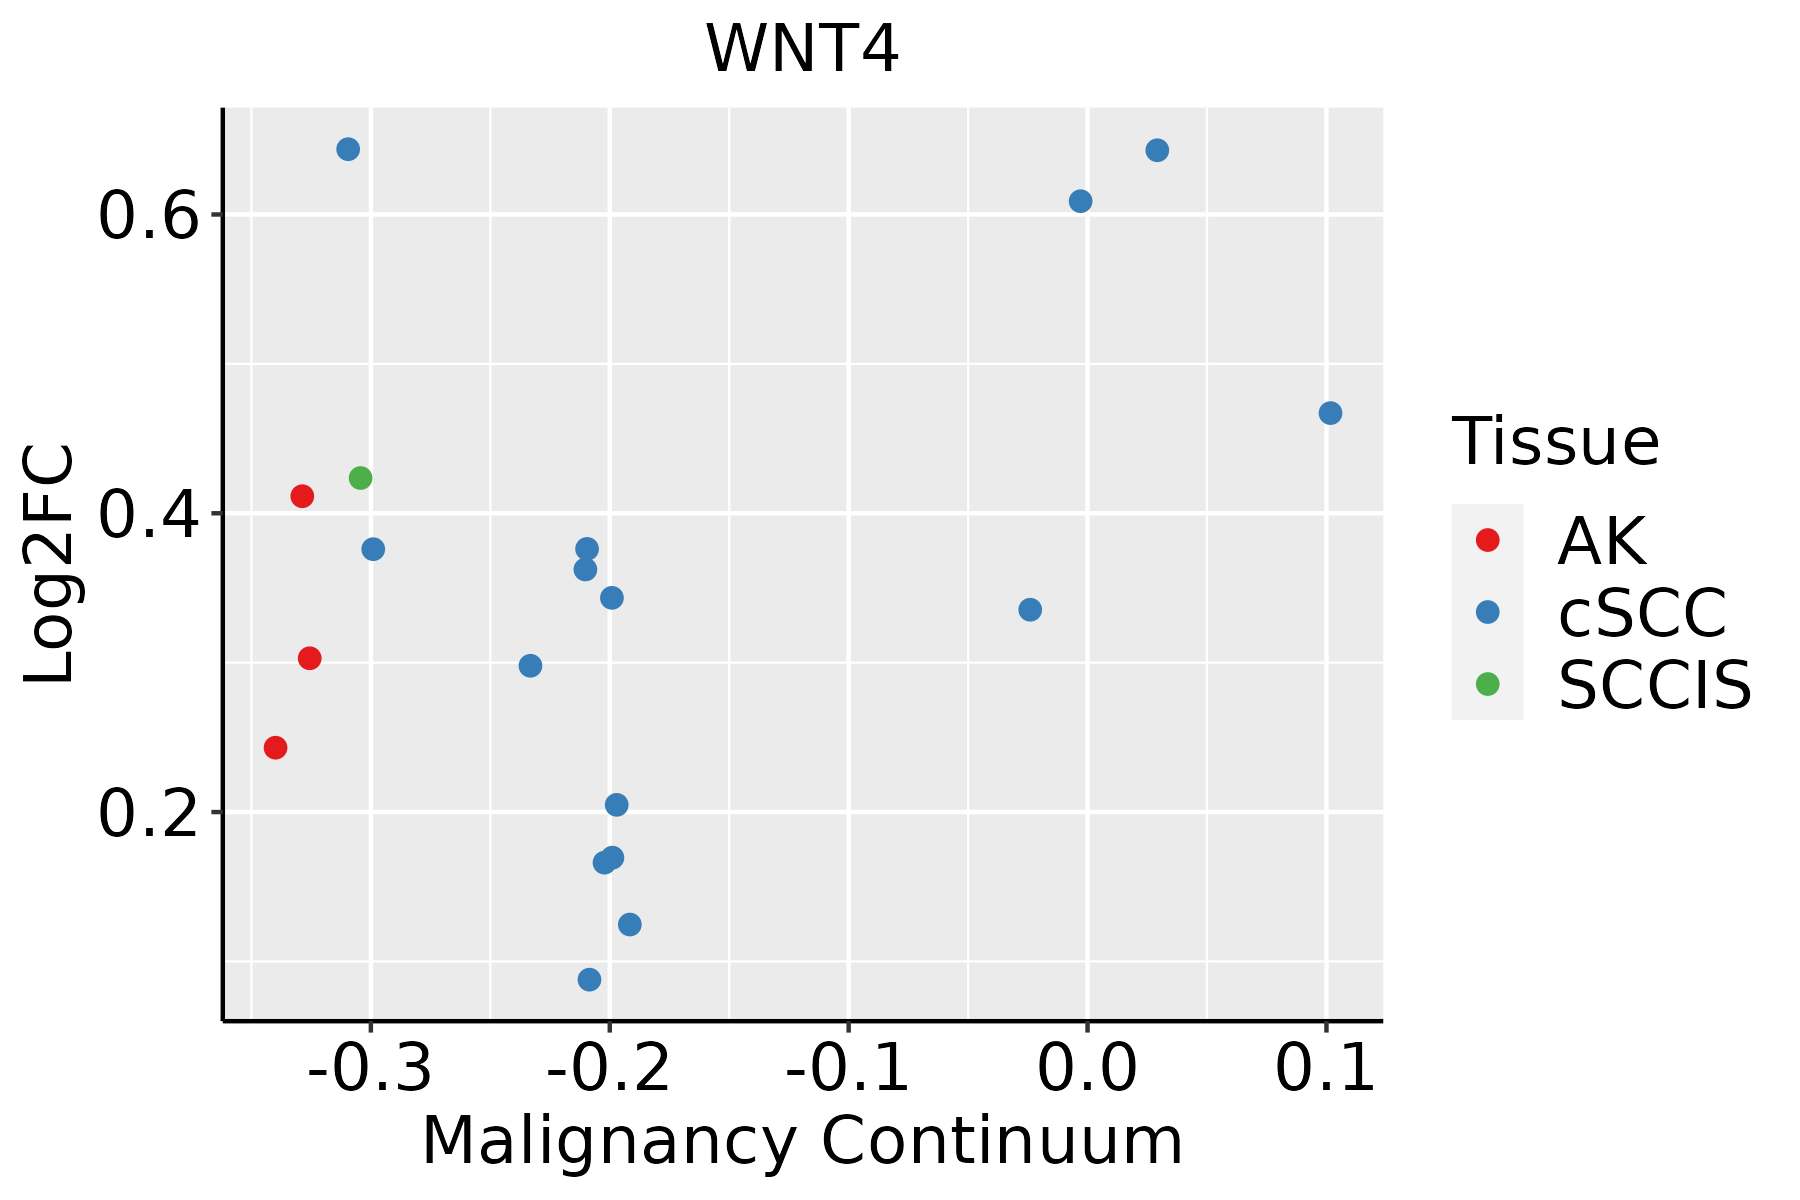 | AK: Actinic keratosis |
| cSCC: Cutaneous squamous cell carcinoma | ||
| SCCIS:squamous cell carcinoma in situ |
| ∗log2FC in expression of this searched gene in stem-like cells from each diseased tissue sample relative to stem-like cells in normal samples in each tissue plotted against the malignancy continuum. Samples are colored based on if they are from different disease stage. |
Top |
Malignant transformation related pathway analysis |
| Find out the enriched GO biological processes and KEGG pathways involved in transition from healthy to precancer to cancer |
| Tissue | Disease Stage | Enriched GO biological Processes |
| Colorectum | AD |  |
| Colorectum | SER |  |
| Colorectum | MSS |  |
| Colorectum | MSI-H |  |
| Colorectum | FAP |  |
| ∗Top 15 enriched GO BP terms are showed in the bar plot of each disease state in each tissue. Each row represents a significant GO biological process which is colored according to the -log10(p.adjust). |
| Page: 1 2 3 4 5 6 7 8 9 |
| GO ID | Tissue | Disease Stage | Description | Gene Ratio | Bg Ratio | pvalue | p.adjust | Count |
| GO:200123320 | Oral cavity | OSCC | regulation of apoptotic signaling pathway | 242/7305 | 356/18723 | 6.66e-29 | 3.24e-26 | 242 |
| GO:200123420 | Oral cavity | OSCC | negative regulation of apoptotic signaling pathway | 148/7305 | 224/18723 | 1.71e-16 | 1.36e-14 | 148 |
| GO:004206020 | Oral cavity | OSCC | wound healing | 237/7305 | 422/18723 | 4.51e-13 | 2.18e-11 | 237 |
| GO:007149620 | Oral cavity | OSCC | cellular response to external stimulus | 186/7305 | 320/18723 | 2.56e-12 | 1.05e-10 | 186 |
| GO:190290520 | Oral cavity | OSCC | positive regulation of supramolecular fiber organization | 131/7305 | 209/18723 | 3.18e-12 | 1.27e-10 | 131 |
| GO:00482852 | Oral cavity | OSCC | organelle fission | 265/7305 | 488/18723 | 3.22e-12 | 1.27e-10 | 265 |
| GO:190290320 | Oral cavity | OSCC | regulation of supramolecular fiber organization | 211/7305 | 383/18723 | 9.45e-11 | 2.88e-09 | 211 |
| GO:00002801 | Oral cavity | OSCC | nuclear division | 237/7305 | 439/18723 | 9.62e-11 | 2.90e-09 | 237 |
| GO:005149518 | Oral cavity | OSCC | positive regulation of cytoskeleton organization | 135/7305 | 226/18723 | 1.98e-10 | 5.66e-09 | 135 |
| GO:000704416 | Oral cavity | OSCC | cell-substrate junction assembly | 67/7305 | 95/18723 | 4.51e-10 | 1.19e-08 | 67 |
| GO:015011517 | Oral cavity | OSCC | cell-substrate junction organization | 70/7305 | 101/18723 | 6.36e-10 | 1.63e-08 | 70 |
| GO:00457879 | Oral cavity | OSCC | positive regulation of cell cycle | 173/7305 | 313/18723 | 3.28e-09 | 7.44e-08 | 173 |
| GO:003166819 | Oral cavity | OSCC | cellular response to extracellular stimulus | 141/7305 | 246/18723 | 3.99e-09 | 8.95e-08 | 141 |
| GO:003166720 | Oral cavity | OSCC | response to nutrient levels | 245/7305 | 474/18723 | 1.02e-08 | 2.10e-07 | 245 |
| GO:000701520 | Oral cavity | OSCC | actin filament organization | 230/7305 | 442/18723 | 1.37e-08 | 2.77e-07 | 230 |
| GO:003297020 | Oral cavity | OSCC | regulation of actin filament-based process | 209/7305 | 397/18723 | 1.89e-08 | 3.72e-07 | 209 |
| GO:003158917 | Oral cavity | OSCC | cell-substrate adhesion | 193/7305 | 363/18723 | 2.48e-08 | 4.82e-07 | 193 |
| GO:004873220 | Oral cavity | OSCC | gland development | 226/7305 | 436/18723 | 2.78e-08 | 5.39e-07 | 226 |
| GO:001081019 | Oral cavity | OSCC | regulation of cell-substrate adhesion | 126/7305 | 221/18723 | 4.02e-08 | 7.55e-07 | 126 |
| GO:004804110 | Oral cavity | OSCC | focal adhesion assembly | 59/7305 | 87/18723 | 4.86e-08 | 8.95e-07 | 59 |
| Page: 1 2 3 4 5 6 7 8 9 10 11 12 13 14 15 16 17 18 19 |
| Pathway ID | Tissue | Disease Stage | Description | Gene Ratio | Bg Ratio | pvalue | p.adjust | qvalue | Count |
| hsa0501028 | Oral cavity | OSCC | Alzheimer disease | 244/3704 | 384/8465 | 1.18e-15 | 3.60e-14 | 1.83e-14 | 244 |
| hsa0502228 | Oral cavity | OSCC | Pathways of neurodegeneration - multiple diseases | 292/3704 | 476/8465 | 1.60e-15 | 4.47e-14 | 2.28e-14 | 292 |
| hsa051659 | Oral cavity | OSCC | Human papillomavirus infection | 200/3704 | 331/8465 | 3.83e-10 | 4.93e-09 | 2.51e-09 | 200 |
| hsa0520526 | Oral cavity | OSCC | Proteoglycans in cancer | 128/3704 | 205/8465 | 4.00e-08 | 3.12e-07 | 1.59e-07 | 128 |
| hsa0522516 | Oral cavity | OSCC | Hepatocellular carcinoma | 97/3704 | 168/8465 | 1.63e-04 | 5.52e-04 | 2.81e-04 | 97 |
| hsa0491926 | Oral cavity | OSCC | Thyroid hormone signaling pathway | 73/3704 | 121/8465 | 1.63e-04 | 5.52e-04 | 2.81e-04 | 73 |
| hsa041504 | Oral cavity | OSCC | mTOR signaling pathway | 90/3704 | 156/8465 | 2.87e-04 | 9.15e-04 | 4.66e-04 | 90 |
| hsa0439016 | Oral cavity | OSCC | Hippo signaling pathway | 86/3704 | 157/8465 | 3.30e-03 | 8.24e-03 | 4.20e-03 | 86 |
| hsa0436014 | Oral cavity | OSCC | Axon guidance | 97/3704 | 182/8465 | 5.59e-03 | 1.33e-02 | 6.76e-03 | 97 |
| hsa05010112 | Oral cavity | OSCC | Alzheimer disease | 244/3704 | 384/8465 | 1.18e-15 | 3.60e-14 | 1.83e-14 | 244 |
| hsa05022112 | Oral cavity | OSCC | Pathways of neurodegeneration - multiple diseases | 292/3704 | 476/8465 | 1.60e-15 | 4.47e-14 | 2.28e-14 | 292 |
| hsa0516514 | Oral cavity | OSCC | Human papillomavirus infection | 200/3704 | 331/8465 | 3.83e-10 | 4.93e-09 | 2.51e-09 | 200 |
| hsa05205111 | Oral cavity | OSCC | Proteoglycans in cancer | 128/3704 | 205/8465 | 4.00e-08 | 3.12e-07 | 1.59e-07 | 128 |
| hsa0522517 | Oral cavity | OSCC | Hepatocellular carcinoma | 97/3704 | 168/8465 | 1.63e-04 | 5.52e-04 | 2.81e-04 | 97 |
| hsa04919112 | Oral cavity | OSCC | Thyroid hormone signaling pathway | 73/3704 | 121/8465 | 1.63e-04 | 5.52e-04 | 2.81e-04 | 73 |
| hsa0415012 | Oral cavity | OSCC | mTOR signaling pathway | 90/3704 | 156/8465 | 2.87e-04 | 9.15e-04 | 4.66e-04 | 90 |
| hsa0439017 | Oral cavity | OSCC | Hippo signaling pathway | 86/3704 | 157/8465 | 3.30e-03 | 8.24e-03 | 4.20e-03 | 86 |
| hsa0436015 | Oral cavity | OSCC | Axon guidance | 97/3704 | 182/8465 | 5.59e-03 | 1.33e-02 | 6.76e-03 | 97 |
| Page: 1 |
Top |
Cell-cell communication analysis |
| Identification of potential cell-cell interactions between two cell types and their ligand-receptor pairs for different disease states |
| Ligand | Receptor | LRpair | Pathway | Tissue | Disease Stage |
| WNT4 | FZD5_LRP5 | WNT4_FZD5_LRP5 | WNT | CRC | AD |
| WNT4 | FZD6_LRP5 | WNT4_FZD6_LRP5 | WNT | Endometrium | ADJ |
| WNT4 | FZD4_LRP6 | WNT4_FZD4_LRP6 | WNT | Endometrium | ADJ |
| WNT4 | FZD6_LRP6 | WNT4_FZD6_LRP6 | WNT | Endometrium | ADJ |
| WNT4 | FZD4_LRP6 | WNT4_FZD4_LRP6 | WNT | Endometrium | AEH |
| WNT4 | FZD4_LRP5 | WNT4_FZD4_LRP5 | WNT | HNSCC | OSCC |
| WNT4 | FZD6_LRP5 | WNT4_FZD6_LRP5 | WNT | HNSCC | OSCC |
| WNT4 | FZD6_LRP6 | WNT4_FZD6_LRP6 | WNT | HNSCC | OSCC |
| WNT4 | FZD6_LRP5 | WNT4_FZD6_LRP5 | WNT | HNSCC | Precancer |
| WNT4 | FZD6_LRP6 | WNT4_FZD6_LRP6 | WNT | HNSCC | Precancer |
| Page: 1 |
Top |
Single-cell gene regulatory network inference analysis |
| Find out the significant the regulons (TFs) and the target genes of each regulon across cell types for different disease states |
| TF | Cell Type | Tissue | Disease Stage | Target Gene | RSS | Regulon Activity |
| ∗The dot plots of a searched regulon are shown for all cell subpopulations in each disease state of each tissue based on the regulon specific score inferred using pySCENIC and by calculating the average expression. |
| Page: 1 |
Top |
Somatic mutation of malignant transformation related genes |
| Annotation of somatic variants for genes involved in malignant transformation |
| Hugo Symbol | Variant Class | Variant Classification | dbSNP RS | HGVSc | HGVSp | HGVSp Short | SWISSPROT | BIOTYPE | SIFT | PolyPhen | Tumor Sample Barcode | Tissue | Histology | Sex | Age | Stage | Therapy Types | Drugs | Outcome |
| WNT4 | SNV | Missense_Mutation | c.872C>T | p.Thr291Met | p.T291M | P56705 | protein_coding | deleterious(0.01) | probably_damaging(0.994) | TCGA-A1-A0SQ-01 | Breast | breast invasive carcinoma | Female | <65 | I/II | Chemotherapy | ac | SD | |
| WNT4 | SNV | Missense_Mutation | c.193G>A | p.Asp65Asn | p.D65N | P56705 | protein_coding | tolerated(0.14) | benign(0.065) | TCGA-D8-A1J8-01 | Breast | breast invasive carcinoma | Female | >=65 | I/II | Hormone Therapy | nolvadex | SD | |
| WNT4 | SNV | Missense_Mutation | novel | c.646N>A | p.Glu216Lys | p.E216K | P56705 | protein_coding | deleterious(0.04) | probably_damaging(0.994) | TCGA-S3-AA11-01 | Breast | breast invasive carcinoma | Female | >=65 | I/II | Hormone Therapy | letrozole | CR |
| WNT4 | insertion | Nonsense_Mutation | novel | c.183_184insTCTCTACTAAAAATACAAAAAAATTAGCCGGGCGTGGTGGC | p.Glu62SerfsTer9 | p.E62Sfs*9 | P56705 | protein_coding | TCGA-B6-A0IB-01 | Breast | breast invasive carcinoma | Female | <65 | III/IV | Unknown | Unknown | PD | ||
| WNT4 | SNV | Missense_Mutation | novel | c.374N>G | p.Thr125Arg | p.T125R | P56705 | protein_coding | deleterious(0) | probably_damaging(0.996) | TCGA-VS-A94X-01 | Cervix | cervical & endocervical cancer | Female | <65 | I/II | Chemotherapy | cisplatin | PD |
| WNT4 | SNV | Missense_Mutation | rs121908652 | c.247N>T | p.Arg83Trp | p.R83W | P56705 | protein_coding | deleterious(0) | probably_damaging(0.964) | TCGA-CK-6746-01 | Colorectum | colon adenocarcinoma | Female | >=65 | I/II | Unknown | Unknown | SD |
| WNT4 | SNV | Missense_Mutation | c.536N>A | p.Ala179Asp | p.A179D | P56705 | protein_coding | tolerated(0.44) | benign(0.124) | TCGA-D5-6930-01 | Colorectum | colon adenocarcinoma | Male | >=65 | I/II | Unknown | Unknown | SD | |
| WNT4 | SNV | Missense_Mutation | rs760357534 | c.289N>A | p.Val97Ile | p.V97I | P56705 | protein_coding | tolerated(0.08) | benign(0.16) | TCGA-G4-6628-01 | Colorectum | colon adenocarcinoma | Male | >=65 | I/II | Unknown | Unknown | SD |
| WNT4 | SNV | Missense_Mutation | c.125N>T | p.Thr42Met | p.T42M | P56705 | protein_coding | tolerated(0.31) | possibly_damaging(0.759) | TCGA-QG-A5Z2-01 | Colorectum | colon adenocarcinoma | Male | <65 | I/II | Unknown | Unknown | SD | |
| WNT4 | SNV | Missense_Mutation | c.85N>A | p.Ala29Thr | p.A29T | P56705 | protein_coding | deleterious(0.01) | probably_damaging(0.923) | TCGA-DC-6155-01 | Colorectum | rectum adenocarcinoma | Female | <65 | III/IV | Ancillary | leucovorin | SD |
| Page: 1 2 3 4 |
Top |
Related drugs of malignant transformation related genes |
| Identification of chemicals and drugs interact with genes involved in malignant transfromation |
| (DGIdb 4.0) |
| Entrez ID | Symbol | Category | Interaction Types | Drug Claim Name | Drug Name | PMIDs |
| Page: 1 |

Copyright 2023-Present -The University of Texas Health Science Center at Houston |