
|
|||||
|
 | |
| |
| |
| |
| |
| |
|
Gene: WNT3 |
Gene summary for WNT3 |
| Gene information | Species | Human | Gene symbol | WNT3 | Gene ID | 7473 |
| Gene name | Wnt family member 3 | |
| Gene Alias | INT4 | |
| Cytomap | 17q21.31-q21.32 | |
| Gene Type | protein-coding | GO ID | GO:0000003 | UniProtAcc | P56703 |
Top |
Malignant transformation analysis |
| Identification of the aberrant gene expression in precancerous and cancerous lesions by comparing the gene expression of stem-like cells in diseased tissues with normal stem cells |
| Entrez ID | Symbol | Replicates | Species | Organ | Tissue | Adj P-value | Log2FC | Malignancy |
| 7473 | WNT3 | P1_cSCC | Human | Skin | cSCC | 1.50e-25 | 7.91e-01 | 0.0292 |
| 7473 | WNT3 | P2_cSCC | Human | Skin | cSCC | 6.73e-16 | 5.92e-01 | -0.024 |
| 7473 | WNT3 | P4_cSCC | Human | Skin | cSCC | 1.74e-24 | 5.01e-01 | -0.00290000000000005 |
| 7473 | WNT3 | P10_cSCC | Human | Skin | cSCC | 8.77e-13 | 4.42e-01 | 0.1017 |
| 7473 | WNT3 | cSCC_p1 | Human | Skin | cSCC | 8.23e-09 | 2.89e-01 | -0.1916 |
| 7473 | WNT3 | cSCC_p10 | Human | Skin | cSCC | 3.73e-09 | 2.50e-01 | -0.2095 |
| 7473 | WNT3 | cSCC_p11 | Human | Skin | cSCC | 3.60e-04 | 1.55e-01 | -0.2102 |
| 7473 | WNT3 | cSCC_p8 | Human | Skin | cSCC | 4.93e-24 | 4.40e-01 | -0.1971 |
| 7473 | WNT3 | cSCC_p9 | Human | Skin | cSCC | 4.07e-21 | 3.63e-01 | -0.1991 |
| Page: 1 |
| Tissue | Expression Dynamics | Abbreviation |
| Skin | 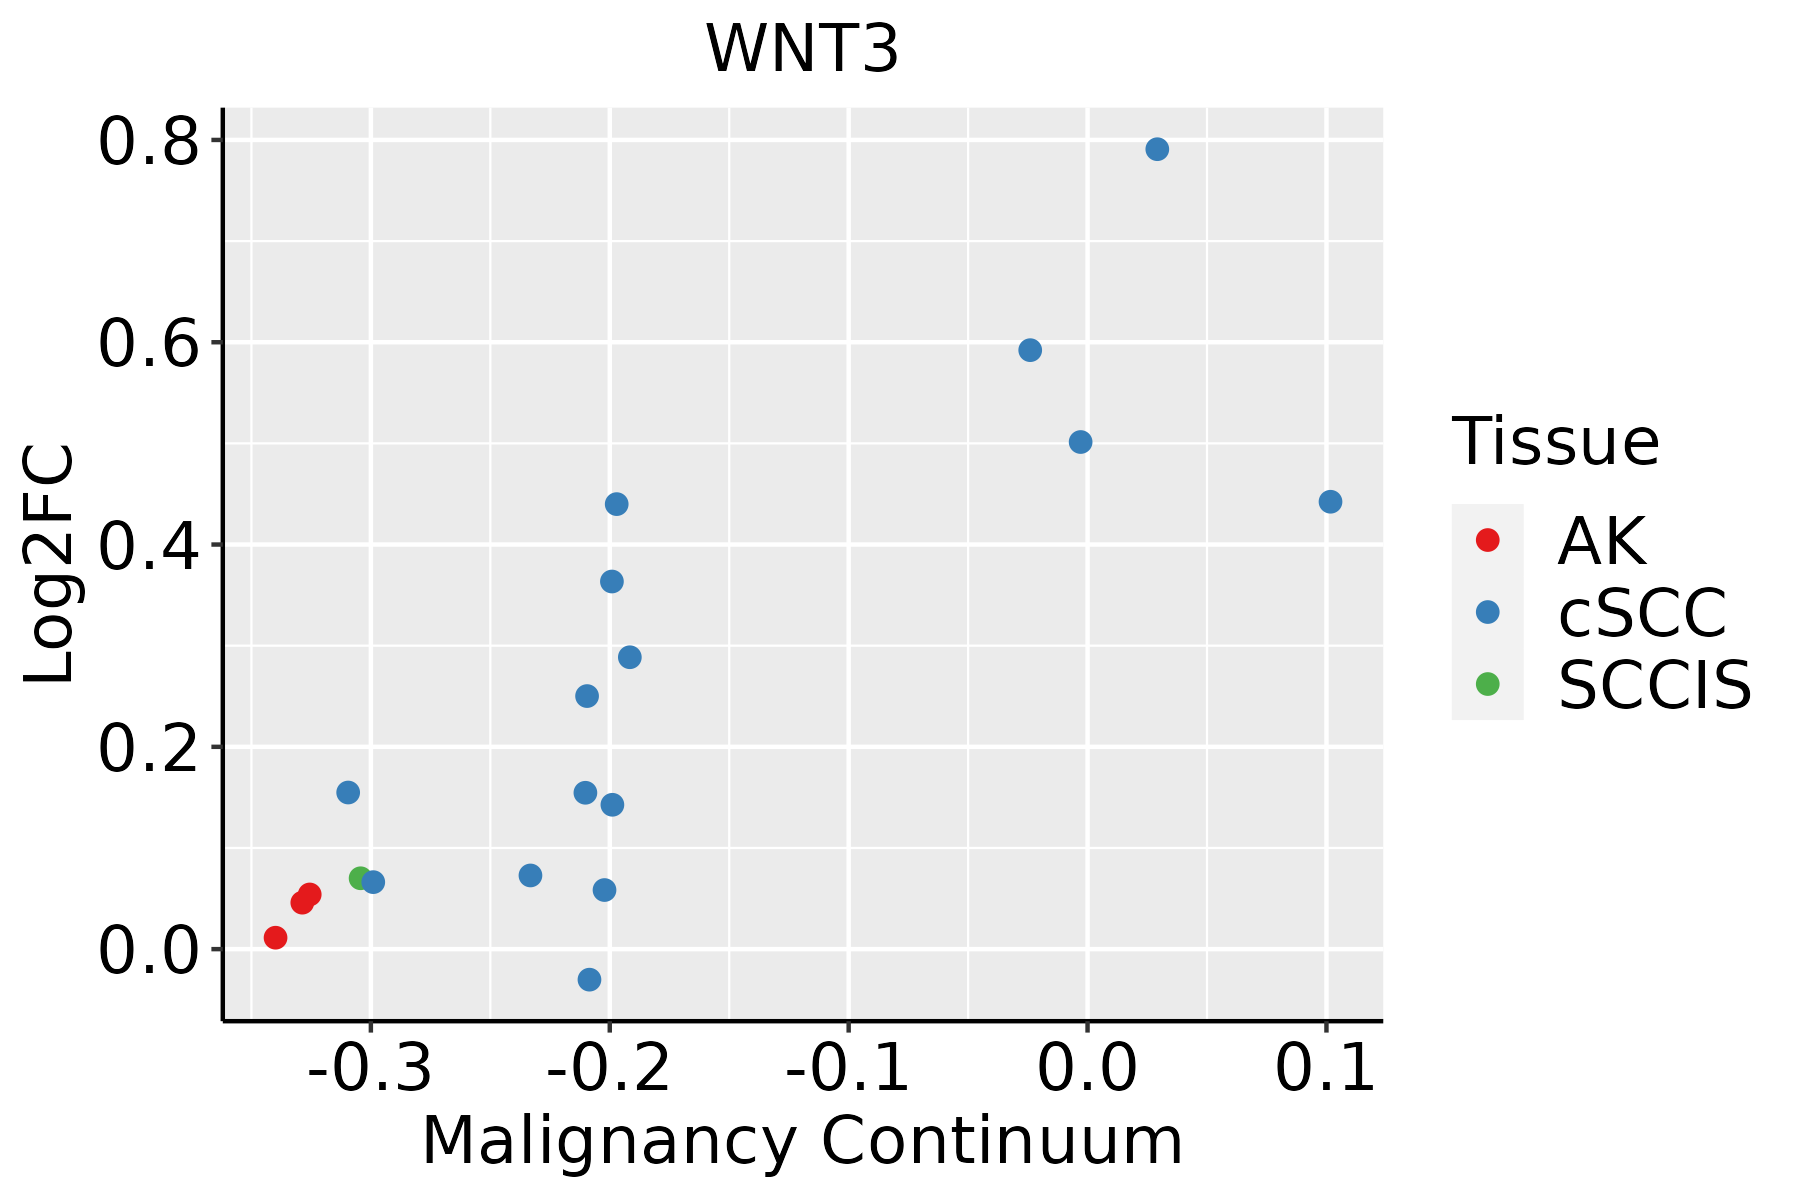 | AK: Actinic keratosis |
| cSCC: Cutaneous squamous cell carcinoma | ||
| SCCIS:squamous cell carcinoma in situ |
| ∗log2FC in expression of this searched gene in stem-like cells from each diseased tissue sample relative to stem-like cells in normal samples in each tissue plotted against the malignancy continuum. Samples are colored based on if they are from different disease stage. |
Top |
Malignant transformation related pathway analysis |
| Find out the enriched GO biological processes and KEGG pathways involved in transition from healthy to precancer to cancer |
| Tissue | Disease Stage | Enriched GO biological Processes |
| Colorectum | AD |  |
| Colorectum | SER |  |
| Colorectum | MSS |  |
| Colorectum | MSI-H |  |
| Colorectum | FAP |  |
| ∗Top 15 enriched GO BP terms are showed in the bar plot of each disease state in each tissue. Each row represents a significant GO biological process which is colored according to the -log10(p.adjust). |
| Page: 1 2 3 4 5 6 7 8 9 |
| GO ID | Tissue | Disease Stage | Description | Gene Ratio | Bg Ratio | pvalue | p.adjust | Count |
| GO:004873227 | Skin | cSCC | gland development | 167/4864 | 436/18723 | 7.64e-09 | 2.44e-07 | 167 |
| GO:001604925 | Skin | cSCC | cell growth | 173/4864 | 482/18723 | 7.21e-07 | 1.34e-05 | 173 |
| GO:0030901110 | Skin | cSCC | midbrain development | 45/4864 | 90/18723 | 8.81e-07 | 1.63e-05 | 45 |
| GO:001605524 | Skin | cSCC | Wnt signaling pathway | 158/4864 | 444/18723 | 3.80e-06 | 5.70e-05 | 158 |
| GO:019873824 | Skin | cSCC | cell-cell signaling by wnt | 158/4864 | 446/18723 | 5.08e-06 | 7.38e-05 | 158 |
| GO:000164923 | Skin | cSCC | osteoblast differentiation | 89/4864 | 229/18723 | 1.18e-05 | 1.51e-04 | 89 |
| GO:003011124 | Skin | cSCC | regulation of Wnt signaling pathway | 117/4864 | 328/18723 | 5.80e-05 | 5.75e-04 | 117 |
| GO:0032535111 | Skin | cSCC | regulation of cellular component size | 131/4864 | 383/18723 | 1.89e-04 | 1.59e-03 | 131 |
| GO:000155824 | Skin | cSCC | regulation of cell growth | 140/4864 | 414/18723 | 2.07e-04 | 1.72e-03 | 140 |
| GO:001072016 | Skin | cSCC | positive regulation of cell development | 105/4864 | 298/18723 | 2.30e-04 | 1.89e-03 | 105 |
| GO:000150323 | Skin | cSCC | ossification | 137/4864 | 408/18723 | 3.39e-04 | 2.68e-03 | 137 |
| GO:003017724 | Skin | cSCC | positive regulation of Wnt signaling pathway | 55/4864 | 140/18723 | 3.72e-04 | 2.92e-03 | 55 |
| GO:003134622 | Skin | cSCC | positive regulation of cell projection organization | 120/4864 | 353/18723 | 4.49e-04 | 3.44e-03 | 120 |
| GO:006007024 | Skin | cSCC | canonical Wnt signaling pathway | 104/4864 | 303/18723 | 7.13e-04 | 5.03e-03 | 104 |
| GO:003087922 | Skin | cSCC | mammary gland development | 53/4864 | 137/18723 | 7.21e-04 | 5.05e-03 | 53 |
| GO:005076913 | Skin | cSCC | positive regulation of neurogenesis | 80/4864 | 225/18723 | 8.85e-04 | 6.07e-03 | 80 |
| GO:003030722 | Skin | cSCC | positive regulation of cell growth | 61/4864 | 166/18723 | 1.39e-03 | 8.78e-03 | 61 |
| GO:006118012 | Skin | cSCC | mammary gland epithelium development | 29/4864 | 67/18723 | 1.55e-03 | 9.60e-03 | 29 |
| GO:00724972 | Skin | cSCC | mesenchymal stem cell differentiation | 8/4864 | 11/18723 | 1.56e-03 | 9.60e-03 | 8 |
| GO:005076722 | Skin | cSCC | regulation of neurogenesis | 118/4864 | 364/18723 | 3.32e-03 | 1.81e-02 | 118 |
| Page: 1 2 |
| Pathway ID | Tissue | Disease Stage | Description | Gene Ratio | Bg Ratio | pvalue | p.adjust | qvalue | Count |
| Page: 1 |
Top |
Cell-cell communication analysis |
| Identification of potential cell-cell interactions between two cell types and their ligand-receptor pairs for different disease states |
| Ligand | Receptor | LRpair | Pathway | Tissue | Disease Stage |
| Page: 1 |
Top |
Single-cell gene regulatory network inference analysis |
| Find out the significant the regulons (TFs) and the target genes of each regulon across cell types for different disease states |
| TF | Cell Type | Tissue | Disease Stage | Target Gene | RSS | Regulon Activity |
| ∗The dot plots of a searched regulon are shown for all cell subpopulations in each disease state of each tissue based on the regulon specific score inferred using pySCENIC and by calculating the average expression. |
| Page: 1 |
Top |
Somatic mutation of malignant transformation related genes |
| Annotation of somatic variants for genes involved in malignant transformation |
| Hugo Symbol | Variant Class | Variant Classification | dbSNP RS | HGVSc | HGVSp | HGVSp Short | SWISSPROT | BIOTYPE | SIFT | PolyPhen | Tumor Sample Barcode | Tissue | Histology | Sex | Age | Stage | Therapy Types | Drugs | Outcome |
| WNT3 | SNV | Missense_Mutation | c.198N>T | p.Met66Ile | p.M66I | P56703 | protein_coding | deleterious(0.02) | probably_damaging(0.985) | TCGA-A2-A3Y0-01 | Breast | breast invasive carcinoma | Female | <65 | I/II | Chemotherapy | adriamycin | CR | |
| WNT3 | SNV | Missense_Mutation | novel | c.365N>A | p.Gly122Asp | p.G122D | P56703 | protein_coding | deleterious(0) | probably_damaging(1) | TCGA-2W-A8YY-01 | Cervix | cervical & endocervical cancer | Female | <65 | I/II | Chemotherapy | cisplatin | CR |
| WNT3 | SNV | Missense_Mutation | rs759165713 | c.721N>A | p.Ala241Thr | p.A241T | P56703 | protein_coding | deleterious(0) | probably_damaging(0.999) | TCGA-4J-AA1J-01 | Cervix | cervical & endocervical cancer | Female | <65 | I/II | Unknown | Unknown | SD |
| WNT3 | SNV | Missense_Mutation | c.628G>A | p.Gly210Arg | p.G210R | P56703 | protein_coding | deleterious(0) | probably_damaging(1) | TCGA-AA-3846-01 | Colorectum | colon adenocarcinoma | Female | >=65 | I/II | Unknown | Unknown | SD | |
| WNT3 | SNV | Missense_Mutation | novel | c.20G>T | p.Gly7Val | p.G7V | P56703 | protein_coding | tolerated(0.5) | probably_damaging(0.953) | TCGA-AA-3979-01 | Colorectum | colon adenocarcinoma | Male | >=65 | I/II | Unknown | Unknown | SD |
| WNT3 | SNV | Missense_Mutation | c.892C>T | p.Arg298Trp | p.R298W | P56703 | protein_coding | deleterious(0) | probably_damaging(0.996) | TCGA-AA-A03J-01 | Colorectum | colon adenocarcinoma | Female | >=65 | I/II | Unknown | Unknown | SD | |
| WNT3 | SNV | Missense_Mutation | c.529N>A | p.Glu177Lys | p.E177K | P56703 | protein_coding | deleterious(0) | benign(0.352) | TCGA-CM-6162-01 | Colorectum | colon adenocarcinoma | Female | <65 | III/IV | Chemotherapy | oxaliplatin | SD | |
| WNT3 | SNV | Missense_Mutation | c.551N>T | p.Ser184Leu | p.S184L | P56703 | protein_coding | tolerated(0.15) | possibly_damaging(0.453) | TCGA-NH-A50T-01 | Colorectum | colon adenocarcinoma | Female | >=65 | I/II | Unknown | Unknown | SD | |
| WNT3 | SNV | Missense_Mutation | rs757727243 | c.916N>A | p.Gly306Ser | p.G306S | P56703 | protein_coding | deleterious(0.01) | probably_damaging(0.993) | TCGA-WS-AB45-01 | Colorectum | colon adenocarcinoma | Female | <65 | I/II | Unknown | Unknown | SD |
| WNT3 | SNV | Missense_Mutation | c.1009N>G | p.Cys337Gly | p.C337G | P56703 | protein_coding | deleterious(0) | probably_damaging(0.998) | TCGA-AG-4007-01 | Colorectum | rectum adenocarcinoma | Male | >=65 | III/IV | Unknown | Unknown | SD |
| Page: 1 2 3 4 5 |
Top |
Related drugs of malignant transformation related genes |
| Identification of chemicals and drugs interact with genes involved in malignant transfromation |
| (DGIdb 4.0) |
| Entrez ID | Symbol | Category | Interaction Types | Drug Claim Name | Drug Name | PMIDs |
| Page: 1 |

Copyright 2023-Present -The University of Texas Health Science Center at Houston |