
|
|||||
|
 | |
| |
| |
| |
| |
| |
|
Gene: WNT2B |
Gene summary for WNT2B |
| Gene information | Species | Human | Gene symbol | WNT2B | Gene ID | 7482 |
| Gene name | Wnt family member 2B | |
| Gene Alias | WNT13 | |
| Cytomap | 1p13.2 | |
| Gene Type | protein-coding | GO ID | GO:0000003 | UniProtAcc | Q5TEH8 |
Top |
Malignant transformation analysis |
| Identification of the aberrant gene expression in precancerous and cancerous lesions by comparing the gene expression of stem-like cells in diseased tissues with normal stem cells |
| Entrez ID | Symbol | Replicates | Species | Organ | Tissue | Adj P-value | Log2FC | Malignancy |
| 7482 | WNT2B | LZE4T | Human | Esophagus | ESCC | 5.33e-03 | 1.51e-01 | 0.0811 |
| 7482 | WNT2B | P1T-E | Human | Esophagus | ESCC | 8.90e-04 | 1.82e-01 | 0.0875 |
| 7482 | WNT2B | P5T-E | Human | Esophagus | ESCC | 2.97e-04 | 1.21e-01 | 0.1327 |
| 7482 | WNT2B | P9T-E | Human | Esophagus | ESCC | 2.87e-09 | 2.19e-01 | 0.1131 |
| 7482 | WNT2B | P10T-E | Human | Esophagus | ESCC | 4.69e-06 | 8.59e-02 | 0.116 |
| 7482 | WNT2B | P11T-E | Human | Esophagus | ESCC | 1.17e-04 | 2.15e-01 | 0.1426 |
| 7482 | WNT2B | P12T-E | Human | Esophagus | ESCC | 1.82e-35 | 6.93e-01 | 0.1122 |
| 7482 | WNT2B | P20T-E | Human | Esophagus | ESCC | 1.86e-07 | 1.99e-01 | 0.1124 |
| 7482 | WNT2B | P22T-E | Human | Esophagus | ESCC | 3.75e-03 | 8.48e-02 | 0.1236 |
| 7482 | WNT2B | P23T-E | Human | Esophagus | ESCC | 1.82e-16 | 5.21e-01 | 0.108 |
| 7482 | WNT2B | P26T-E | Human | Esophagus | ESCC | 1.62e-16 | 3.10e-01 | 0.1276 |
| 7482 | WNT2B | P27T-E | Human | Esophagus | ESCC | 2.84e-17 | 2.03e-01 | 0.1055 |
| 7482 | WNT2B | P28T-E | Human | Esophagus | ESCC | 3.66e-25 | 5.72e-01 | 0.1149 |
| 7482 | WNT2B | P30T-E | Human | Esophagus | ESCC | 8.53e-15 | 7.06e-01 | 0.137 |
| 7482 | WNT2B | P31T-E | Human | Esophagus | ESCC | 1.75e-08 | 1.60e-01 | 0.1251 |
| 7482 | WNT2B | P37T-E | Human | Esophagus | ESCC | 2.98e-08 | 6.53e-02 | 0.1371 |
| 7482 | WNT2B | P40T-E | Human | Esophagus | ESCC | 3.22e-04 | 1.20e-01 | 0.109 |
| 7482 | WNT2B | P42T-E | Human | Esophagus | ESCC | 8.43e-06 | 2.05e-01 | 0.1175 |
| 7482 | WNT2B | P48T-E | Human | Esophagus | ESCC | 2.99e-10 | 2.11e-01 | 0.0959 |
| 7482 | WNT2B | P49T-E | Human | Esophagus | ESCC | 3.19e-03 | 3.83e-01 | 0.1768 |
| Page: 1 2 |
| Tissue | Expression Dynamics | Abbreviation |
| Esophagus |  | ESCC: Esophageal squamous cell carcinoma |
| HGIN: High-grade intraepithelial neoplasias | ||
| LGIN: Low-grade intraepithelial neoplasias | ||
| Thyroid | 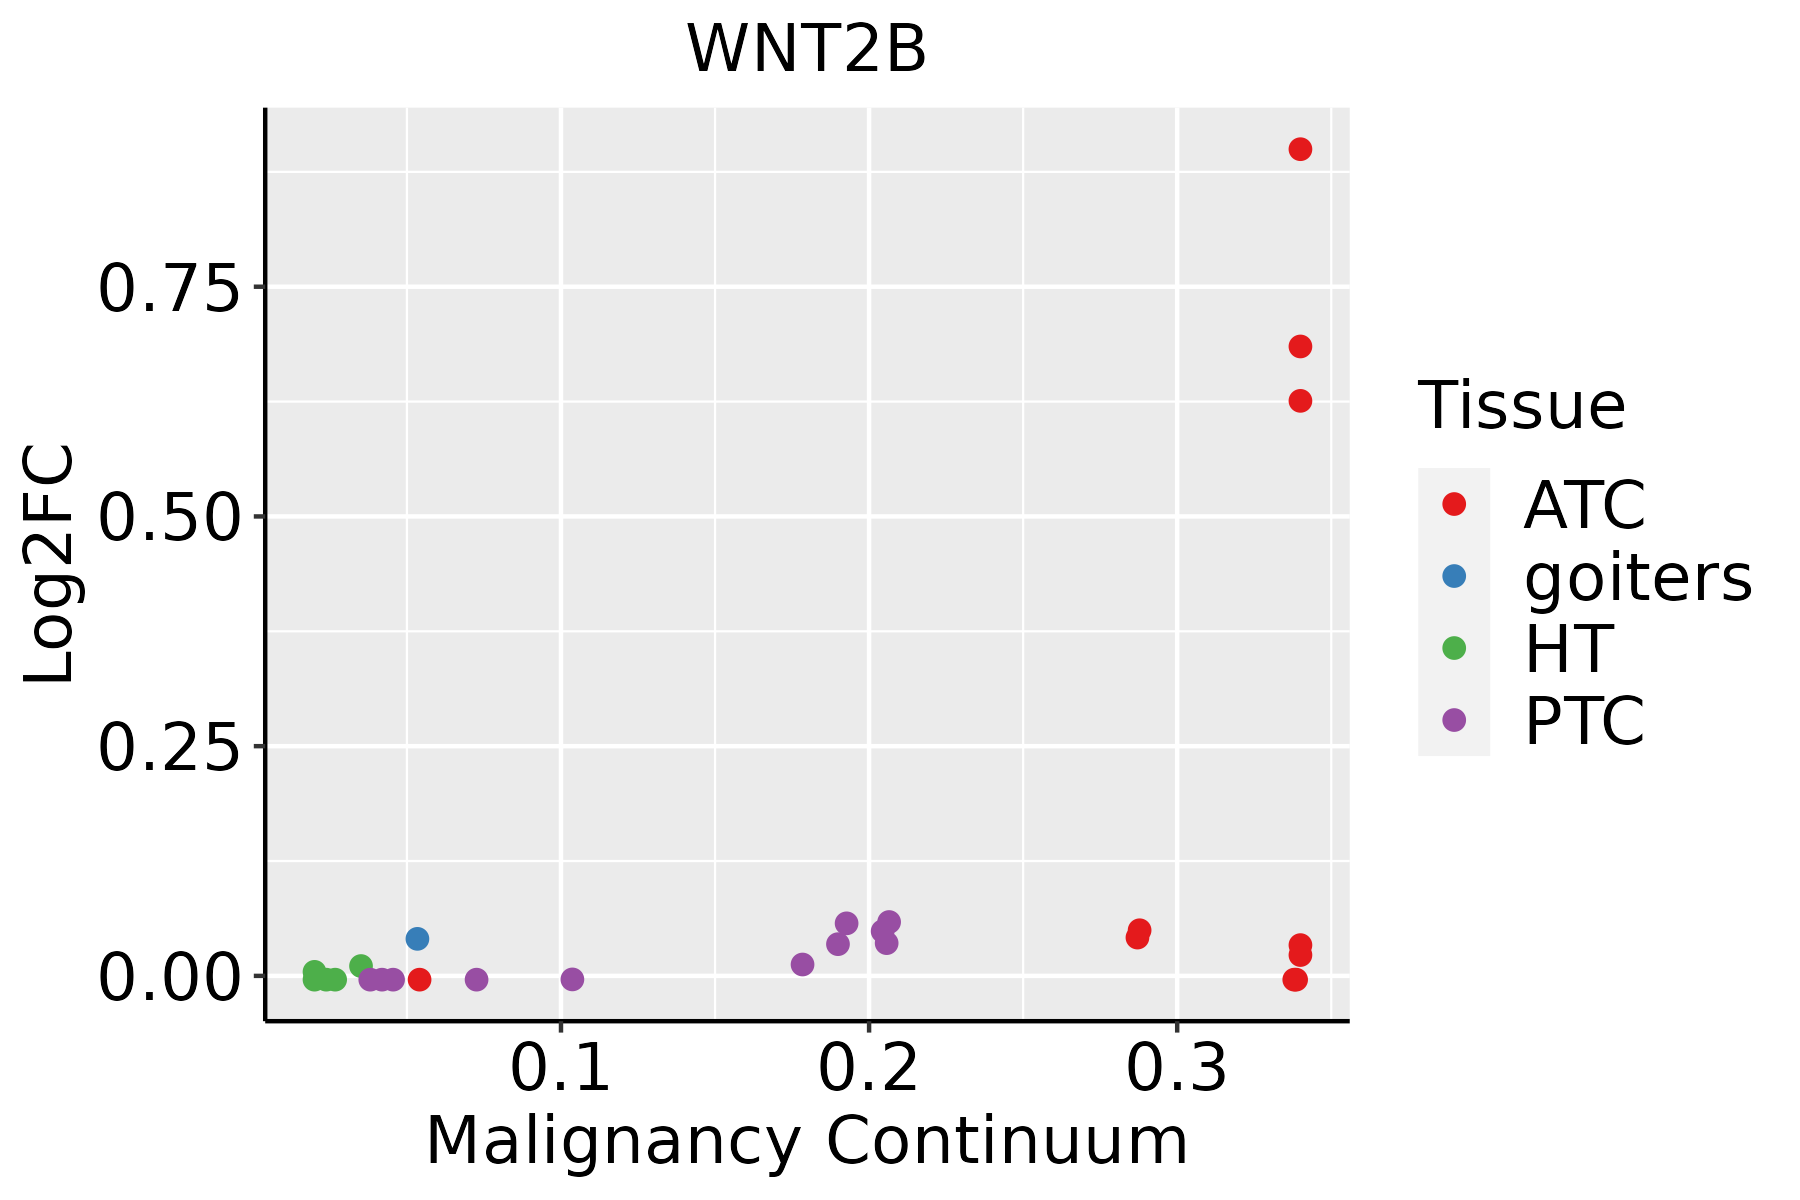 | ATC: Anaplastic thyroid cancer |
| HT: Hashimoto's thyroiditis | ||
| PTC: Papillary thyroid cancer |
| ∗log2FC in expression of this searched gene in stem-like cells from each diseased tissue sample relative to stem-like cells in normal samples in each tissue plotted against the malignancy continuum. Samples are colored based on if they are from different disease stage. |
Top |
Malignant transformation related pathway analysis |
| Find out the enriched GO biological processes and KEGG pathways involved in transition from healthy to precancer to cancer |
| Tissue | Disease Stage | Enriched GO biological Processes |
| Colorectum | AD |  |
| Colorectum | SER |  |
| Colorectum | MSS |  |
| Colorectum | MSI-H |  |
| Colorectum | FAP |  |
| ∗Top 15 enriched GO BP terms are showed in the bar plot of each disease state in each tissue. Each row represents a significant GO biological process which is colored according to the -log10(p.adjust). |
| Page: 1 2 3 4 5 6 7 8 9 |
| GO ID | Tissue | Disease Stage | Description | Gene Ratio | Bg Ratio | pvalue | p.adjust | Count |
| GO:0071496111 | Esophagus | ESCC | cellular response to external stimulus | 215/8552 | 320/18723 | 4.29e-15 | 2.43e-13 | 215 |
| GO:0031668111 | Esophagus | ESCC | cellular response to extracellular stimulus | 168/8552 | 246/18723 | 4.93e-13 | 2.23e-11 | 168 |
| GO:0031669110 | Esophagus | ESCC | cellular response to nutrient levels | 148/8552 | 215/18723 | 4.58e-12 | 1.76e-10 | 148 |
| GO:0031667111 | Esophagus | ESCC | response to nutrient levels | 289/8552 | 474/18723 | 9.25e-12 | 3.47e-10 | 289 |
| GO:001605517 | Esophagus | ESCC | Wnt signaling pathway | 268/8552 | 444/18723 | 2.32e-10 | 6.58e-09 | 268 |
| GO:019873817 | Esophagus | ESCC | cell-cell signaling by wnt | 269/8552 | 446/18723 | 2.41e-10 | 6.79e-09 | 269 |
| GO:0009267110 | Esophagus | ESCC | cellular response to starvation | 110/8552 | 156/18723 | 2.63e-10 | 7.37e-09 | 110 |
| GO:004259419 | Esophagus | ESCC | response to starvation | 133/8552 | 197/18723 | 4.31e-10 | 1.14e-08 | 133 |
| GO:00163316 | Esophagus | ESCC | morphogenesis of embryonic epithelium | 98/8552 | 147/18723 | 2.12e-07 | 3.27e-06 | 98 |
| GO:0061458110 | Esophagus | ESCC | reproductive system development | 247/8552 | 427/18723 | 2.24e-07 | 3.42e-06 | 247 |
| GO:004860818 | Esophagus | ESCC | reproductive structure development | 245/8552 | 424/18723 | 2.82e-07 | 4.14e-06 | 245 |
| GO:006007016 | Esophagus | ESCC | canonical Wnt signaling pathway | 180/8552 | 303/18723 | 9.15e-07 | 1.17e-05 | 180 |
| GO:00303239 | Esophagus | ESCC | respiratory tube development | 112/8552 | 181/18723 | 7.82e-06 | 7.69e-05 | 112 |
| GO:006056210 | Esophagus | ESCC | epithelial tube morphogenesis | 187/8552 | 325/18723 | 9.95e-06 | 9.44e-05 | 187 |
| GO:00605417 | Esophagus | ESCC | respiratory system development | 123/8552 | 203/18723 | 1.26e-05 | 1.15e-04 | 123 |
| GO:00303249 | Esophagus | ESCC | lung development | 109/8552 | 177/18723 | 1.40e-05 | 1.27e-04 | 109 |
| GO:00604257 | Esophagus | ESCC | lung morphogenesis | 37/8552 | 50/18723 | 4.42e-05 | 3.51e-04 | 37 |
| GO:00604414 | Esophagus | ESCC | epithelial tube branching involved in lung morphogenesis | 22/8552 | 29/18723 | 9.30e-04 | 4.73e-03 | 22 |
| GO:00016559 | Esophagus | ESCC | urogenital system development | 177/8552 | 338/18723 | 7.51e-03 | 2.69e-02 | 177 |
| GO:20000274 | Esophagus | ESCC | regulation of animal organ morphogenesis | 71/8552 | 125/18723 | 7.97e-03 | 2.84e-02 | 71 |
| Page: 1 2 3 4 |
| Pathway ID | Tissue | Disease Stage | Description | Gene Ratio | Bg Ratio | pvalue | p.adjust | qvalue | Count |
| hsa05022210 | Esophagus | ESCC | Pathways of neurodegeneration - multiple diseases | 318/4205 | 476/8465 | 6.10e-15 | 2.04e-13 | 1.05e-13 | 318 |
| hsa05010210 | Esophagus | ESCC | Alzheimer disease | 263/4205 | 384/8465 | 1.80e-14 | 5.47e-13 | 2.80e-13 | 263 |
| hsa0516510 | Esophagus | ESCC | Human papillomavirus infection | 215/4205 | 331/8465 | 7.86e-09 | 7.12e-08 | 3.65e-08 | 215 |
| hsa0520529 | Esophagus | ESCC | Proteoglycans in cancer | 138/4205 | 205/8465 | 1.79e-07 | 1.40e-06 | 7.15e-07 | 138 |
| hsa0522518 | Esophagus | ESCC | Hepatocellular carcinoma | 109/4205 | 168/8465 | 4.27e-05 | 1.88e-04 | 9.64e-05 | 109 |
| hsa041505 | Esophagus | ESCC | mTOR signaling pathway | 98/4205 | 156/8465 | 5.81e-04 | 1.95e-03 | 9.97e-04 | 98 |
| hsa0439018 | Esophagus | ESCC | Hippo signaling pathway | 92/4205 | 157/8465 | 1.46e-02 | 3.31e-02 | 1.69e-02 | 92 |
| hsa0502238 | Esophagus | ESCC | Pathways of neurodegeneration - multiple diseases | 318/4205 | 476/8465 | 6.10e-15 | 2.04e-13 | 1.05e-13 | 318 |
| hsa0501038 | Esophagus | ESCC | Alzheimer disease | 263/4205 | 384/8465 | 1.80e-14 | 5.47e-13 | 2.80e-13 | 263 |
| hsa0516515 | Esophagus | ESCC | Human papillomavirus infection | 215/4205 | 331/8465 | 7.86e-09 | 7.12e-08 | 3.65e-08 | 215 |
| hsa0520537 | Esophagus | ESCC | Proteoglycans in cancer | 138/4205 | 205/8465 | 1.79e-07 | 1.40e-06 | 7.15e-07 | 138 |
| hsa0522519 | Esophagus | ESCC | Hepatocellular carcinoma | 109/4205 | 168/8465 | 4.27e-05 | 1.88e-04 | 9.64e-05 | 109 |
| hsa0415013 | Esophagus | ESCC | mTOR signaling pathway | 98/4205 | 156/8465 | 5.81e-04 | 1.95e-03 | 9.97e-04 | 98 |
| hsa0439019 | Esophagus | ESCC | Hippo signaling pathway | 92/4205 | 157/8465 | 1.46e-02 | 3.31e-02 | 1.69e-02 | 92 |
| Page: 1 |
Top |
Cell-cell communication analysis |
| Identification of potential cell-cell interactions between two cell types and their ligand-receptor pairs for different disease states |
| Ligand | Receptor | LRpair | Pathway | Tissue | Disease Stage |
| WNT2B | FZD6_LRP5 | WNT2B_FZD6_LRP5 | WNT | Cervix | CC |
| WNT2B | FZD6_LRP6 | WNT2B_FZD6_LRP6 | WNT | Cervix | CC |
| WNT2B | FZD4_LRP6 | WNT2B_FZD4_LRP6 | WNT | Endometrium | AEH |
| WNT2B | FZD4_LRP6 | WNT2B_FZD4_LRP6 | WNT | Endometrium | EEC |
| WNT2B | FZD6_LRP6 | WNT2B_FZD6_LRP6 | WNT | Endometrium | EEC |
| WNT2B | FZD10_LRP6 | WNT2B_FZD10_LRP6 | WNT | Esophagus | ESCC |
| WNT2B | FZD3_LRP6 | WNT2B_FZD3_LRP6 | WNT | Esophagus | ESCC |
| WNT2B | FZD4_LRP6 | WNT2B_FZD4_LRP6 | WNT | Esophagus | ESCC |
| WNT2B | FZD5_LRP6 | WNT2B_FZD5_LRP6 | WNT | Esophagus | ESCC |
| WNT2B | FZD6_LRP6 | WNT2B_FZD6_LRP6 | WNT | Esophagus | ESCC |
| WNT2B | FZD8_LRP6 | WNT2B_FZD8_LRP6 | WNT | Esophagus | ESCC |
| WNT2B | FZD6_LRP5 | WNT2B_FZD6_LRP5 | WNT | HNSCC | Precancer |
| WNT2B | FZD6_LRP6 | WNT2B_FZD6_LRP6 | WNT | HNSCC | Precancer |
| WNT2B | FZD4_LRP5 | WNT2B_FZD4_LRP5 | WNT | Liver | Healthy |
| WNT2B | FZD6_LRP5 | WNT2B_FZD6_LRP5 | WNT | Liver | Healthy |
| WNT2B | FZD4_LRP6 | WNT2B_FZD4_LRP6 | WNT | Liver | Healthy |
| WNT2B | FZD6_LRP6 | WNT2B_FZD6_LRP6 | WNT | Liver | Healthy |
| WNT2B | FZD1_LRP5 | WNT2B_FZD1_LRP5 | WNT | THCA | Cancer |
| WNT2B | FZD4_LRP5 | WNT2B_FZD4_LRP5 | WNT | THCA | Cancer |
| WNT2B | FZD6_LRP5 | WNT2B_FZD6_LRP5 | WNT | THCA | Cancer |
| Page: 1 2 |
Top |
Single-cell gene regulatory network inference analysis |
| Find out the significant the regulons (TFs) and the target genes of each regulon across cell types for different disease states |
| TF | Cell Type | Tissue | Disease Stage | Target Gene | RSS | Regulon Activity |
| ∗The dot plots of a searched regulon are shown for all cell subpopulations in each disease state of each tissue based on the regulon specific score inferred using pySCENIC and by calculating the average expression. |
| Page: 1 |
Top |
Somatic mutation of malignant transformation related genes |
| Annotation of somatic variants for genes involved in malignant transformation |
| Hugo Symbol | Variant Class | Variant Classification | dbSNP RS | HGVSc | HGVSp | HGVSp Short | SWISSPROT | BIOTYPE | SIFT | PolyPhen | Tumor Sample Barcode | Tissue | Histology | Sex | Age | Stage | Therapy Types | Drugs | Outcome |
| WNT2B | SNV | Missense_Mutation | rs754142898 | c.650T>C | p.Met217Thr | p.M217T | Q93097 | protein_coding | deleterious(0) | probably_damaging(0.986) | TCGA-A8-A08L-01 | Breast | breast invasive carcinoma | Female | >=65 | III/IV | Unknown | Unknown | SD |
| WNT2B | SNV | Missense_Mutation | novel | c.651G>T | p.Met217Ile | p.M217I | Q93097 | protein_coding | deleterious(0) | probably_damaging(0.995) | TCGA-A8-A08L-01 | Breast | breast invasive carcinoma | Female | >=65 | III/IV | Unknown | Unknown | SD |
| WNT2B | SNV | Missense_Mutation | c.757N>T | p.Arg253Cys | p.R253C | Q93097 | protein_coding | deleterious(0.01) | possibly_damaging(0.601) | TCGA-AO-A128-01 | Breast | breast invasive carcinoma | Female | <65 | I/II | Chemotherapy | doxorubicin | SD | |
| WNT2B | SNV | Missense_Mutation | rs140445206 | c.302N>A | p.Arg101Gln | p.R101Q | Q93097 | protein_coding | tolerated(0.21) | benign(0.041) | TCGA-B6-A0RI-01 | Breast | breast invasive carcinoma | Female | <65 | III/IV | Unknown | Unknown | PD |
| WNT2B | SNV | Missense_Mutation | rs140255509 | c.379N>A | p.Val127Ile | p.V127I | Q93097 | protein_coding | deleterious(0.01) | benign(0.317) | TCGA-D8-A1JL-01 | Breast | breast invasive carcinoma | Female | >=65 | I/II | Unknown | Unknown | SD |
| WNT2B | SNV | Missense_Mutation | rs180824040 | c.668N>A | p.Arg223His | p.R223H | Q93097 | protein_coding | deleterious(0.03) | possibly_damaging(0.46) | TCGA-E9-A1NE-01 | Breast | breast invasive carcinoma | Female | <65 | I/II | Chemotherapy | doxorubicin | CR |
| WNT2B | insertion | Nonsense_Mutation | novel | c.1031_1032insAATATTTTAAATTGATGAGATAAAAAACATAGAAGTT | p.Tyr344Ter | p.Y344* | Q93097 | protein_coding | TCGA-A2-A0EQ-01 | Breast | breast invasive carcinoma | Female | <65 | I/II | Chemotherapy | adriamycin | SD | ||
| WNT2B | SNV | Missense_Mutation | rs768030352 | c.590G>A | p.Arg197His | p.R197H | Q93097 | protein_coding | tolerated(0.1) | benign(0.066) | TCGA-2W-A8YY-01 | Cervix | cervical & endocervical cancer | Female | <65 | I/II | Chemotherapy | cisplatin | CR |
| WNT2B | SNV | Missense_Mutation | rs759333195 | c.247C>T | p.Arg83Trp | p.R83W | Q93097 | protein_coding | deleterious(0) | probably_damaging(0.999) | TCGA-C5-A2M2-01 | Cervix | cervical & endocervical cancer | Female | <65 | I/II | Unknown | Unknown | SD |
| WNT2B | SNV | Missense_Mutation | c.335N>A | p.Arg112His | p.R112H | Q93097 | protein_coding | deleterious(0.01) | probably_damaging(0.973) | TCGA-AA-A010-01 | Colorectum | colon adenocarcinoma | Female | <65 | I/II | Chemotherapy | folinic | CR |
| Page: 1 2 3 4 5 6 7 |
Top |
Related drugs of malignant transformation related genes |
| Identification of chemicals and drugs interact with genes involved in malignant transfromation |
| (DGIdb 4.0) |
| Entrez ID | Symbol | Category | Interaction Types | Drug Claim Name | Drug Name | PMIDs |
| Page: 1 |

Copyright 2023-Present -The University of Texas Health Science Center at Houston |