
|
|||||
|
 | |
| |
| |
| |
| |
| |
|
Gene: WNT2 |
Gene summary for WNT2 |
| Gene information | Species | Human | Gene symbol | WNT2 | Gene ID | 7472 |
| Gene name | Wnt family member 2 | |
| Gene Alias | INT1L1 | |
| Cytomap | 7q31.2 | |
| Gene Type | protein-coding | GO ID | GO:0000003 | UniProtAcc | P09544 |
Top |
Malignant transformation analysis |
| Identification of the aberrant gene expression in precancerous and cancerous lesions by comparing the gene expression of stem-like cells in diseased tissues with normal stem cells |
| Entrez ID | Symbol | Replicates | Species | Organ | Tissue | Adj P-value | Log2FC | Malignancy |
| 7472 | WNT2 | S027 | Human | Liver | HCC | 9.45e-26 | 1.70e+00 | 0.2446 |
| 7472 | WNT2 | S028 | Human | Liver | HCC | 1.59e-44 | 1.65e+00 | 0.2503 |
| 7472 | WNT2 | S029 | Human | Liver | HCC | 3.68e-62 | 2.66e+00 | 0.2581 |
| Page: 1 |
| Tissue | Expression Dynamics | Abbreviation |
| Liver | 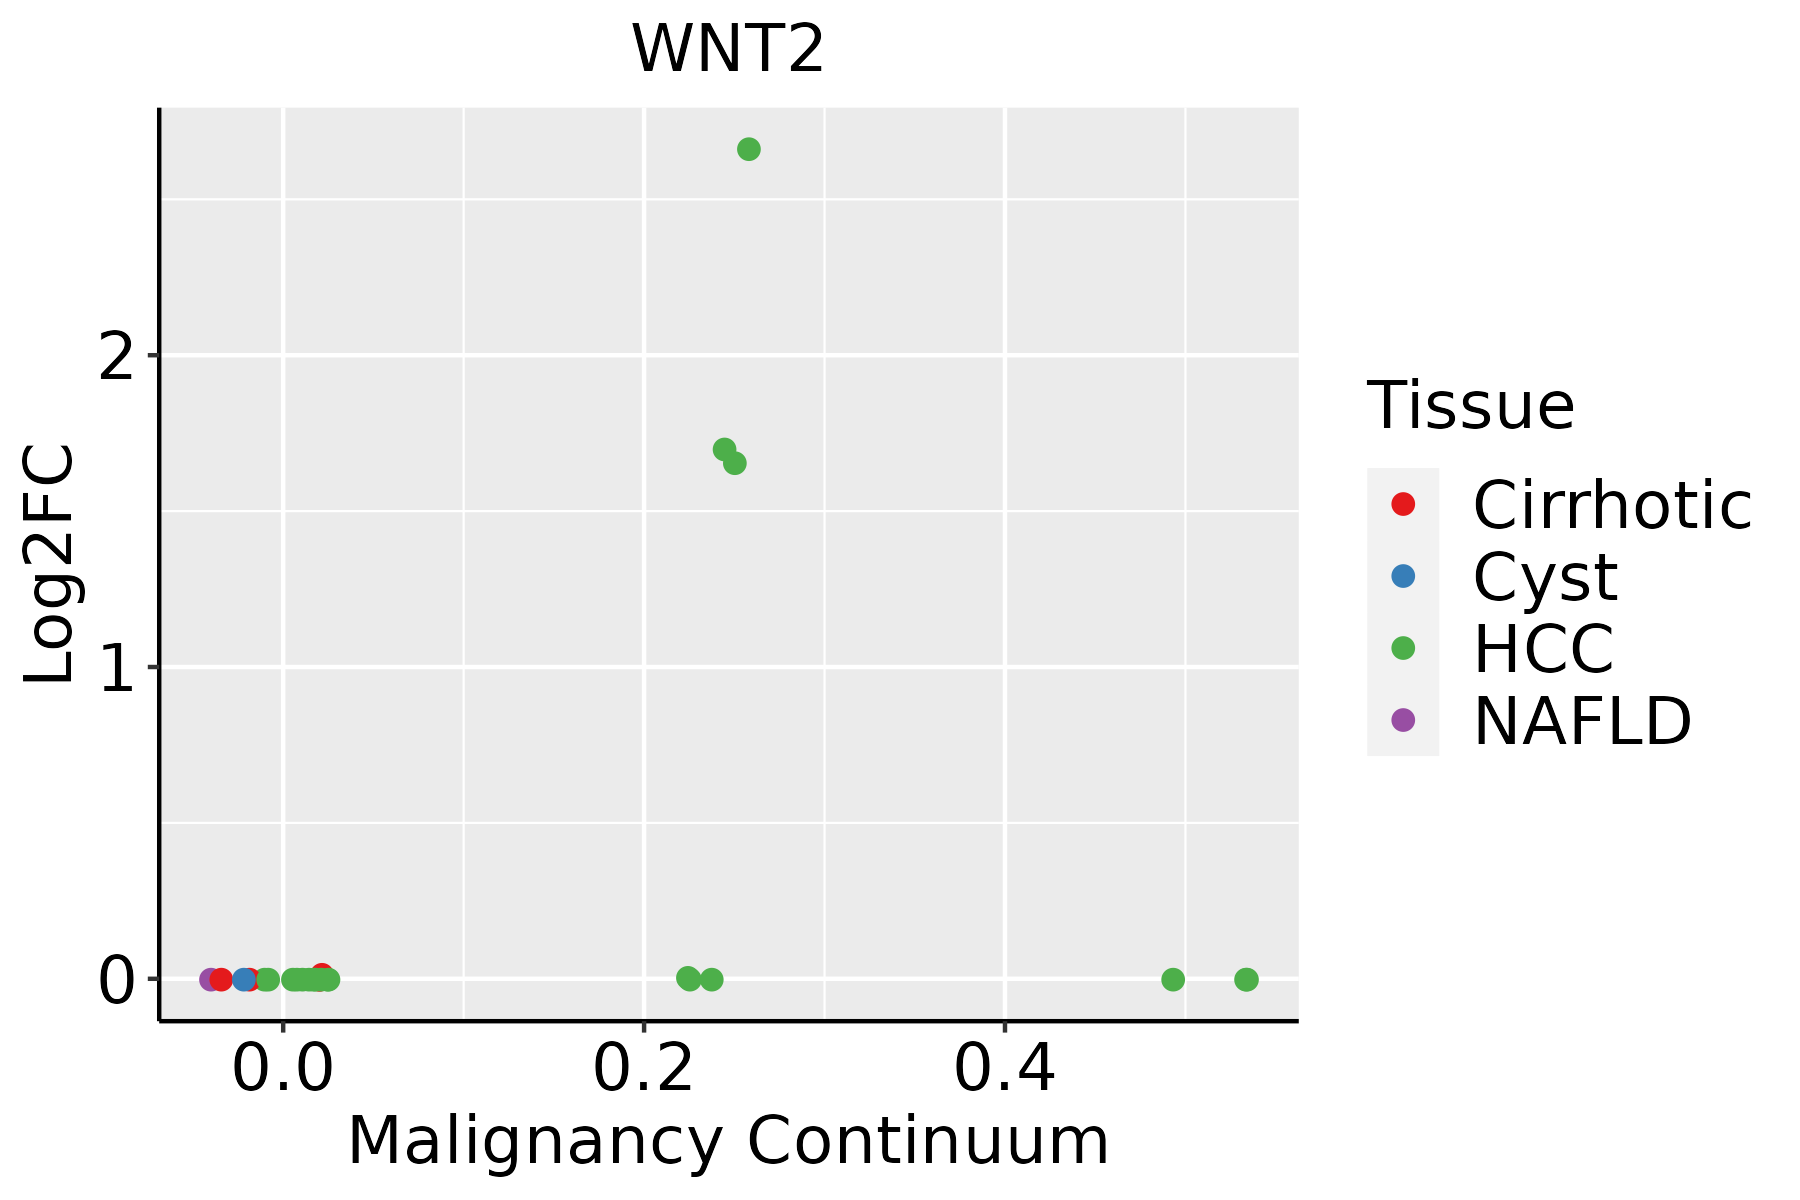 | HCC: Hepatocellular carcinoma |
| NAFLD: Non-alcoholic fatty liver disease |
| ∗log2FC in expression of this searched gene in stem-like cells from each diseased tissue sample relative to stem-like cells in normal samples in each tissue plotted against the malignancy continuum. Samples are colored based on if they are from different disease stage. |
Top |
Malignant transformation related pathway analysis |
| Find out the enriched GO biological processes and KEGG pathways involved in transition from healthy to precancer to cancer |
| Tissue | Disease Stage | Enriched GO biological Processes |
| Colorectum | AD |  |
| Colorectum | SER |  |
| Colorectum | MSS |  |
| Colorectum | MSI-H |  |
| Colorectum | FAP |  |
| ∗Top 15 enriched GO BP terms are showed in the bar plot of each disease state in each tissue. Each row represents a significant GO biological process which is colored according to the -log10(p.adjust). |
| Page: 1 2 3 4 5 6 7 8 9 |
| GO ID | Tissue | Disease Stage | Description | Gene Ratio | Bg Ratio | pvalue | p.adjust | Count |
| GO:0071496111 | Esophagus | ESCC | cellular response to external stimulus | 215/8552 | 320/18723 | 4.29e-15 | 2.43e-13 | 215 |
| GO:0031668111 | Esophagus | ESCC | cellular response to extracellular stimulus | 168/8552 | 246/18723 | 4.93e-13 | 2.23e-11 | 168 |
| GO:0031669110 | Esophagus | ESCC | cellular response to nutrient levels | 148/8552 | 215/18723 | 4.58e-12 | 1.76e-10 | 148 |
| GO:0031667111 | Esophagus | ESCC | response to nutrient levels | 289/8552 | 474/18723 | 9.25e-12 | 3.47e-10 | 289 |
| GO:001605517 | Esophagus | ESCC | Wnt signaling pathway | 268/8552 | 444/18723 | 2.32e-10 | 6.58e-09 | 268 |
| GO:019873817 | Esophagus | ESCC | cell-cell signaling by wnt | 269/8552 | 446/18723 | 2.41e-10 | 6.79e-09 | 269 |
| GO:0009267110 | Esophagus | ESCC | cellular response to starvation | 110/8552 | 156/18723 | 2.63e-10 | 7.37e-09 | 110 |
| GO:004259419 | Esophagus | ESCC | response to starvation | 133/8552 | 197/18723 | 4.31e-10 | 1.14e-08 | 133 |
| GO:00163316 | Esophagus | ESCC | morphogenesis of embryonic epithelium | 98/8552 | 147/18723 | 2.12e-07 | 3.27e-06 | 98 |
| GO:0061458110 | Esophagus | ESCC | reproductive system development | 247/8552 | 427/18723 | 2.24e-07 | 3.42e-06 | 247 |
| GO:004860818 | Esophagus | ESCC | reproductive structure development | 245/8552 | 424/18723 | 2.82e-07 | 4.14e-06 | 245 |
| GO:006007016 | Esophagus | ESCC | canonical Wnt signaling pathway | 180/8552 | 303/18723 | 9.15e-07 | 1.17e-05 | 180 |
| GO:00303239 | Esophagus | ESCC | respiratory tube development | 112/8552 | 181/18723 | 7.82e-06 | 7.69e-05 | 112 |
| GO:006056210 | Esophagus | ESCC | epithelial tube morphogenesis | 187/8552 | 325/18723 | 9.95e-06 | 9.44e-05 | 187 |
| GO:00605417 | Esophagus | ESCC | respiratory system development | 123/8552 | 203/18723 | 1.26e-05 | 1.15e-04 | 123 |
| GO:00303249 | Esophagus | ESCC | lung development | 109/8552 | 177/18723 | 1.40e-05 | 1.27e-04 | 109 |
| GO:00604257 | Esophagus | ESCC | lung morphogenesis | 37/8552 | 50/18723 | 4.42e-05 | 3.51e-04 | 37 |
| GO:00604414 | Esophagus | ESCC | epithelial tube branching involved in lung morphogenesis | 22/8552 | 29/18723 | 9.30e-04 | 4.73e-03 | 22 |
| GO:00016559 | Esophagus | ESCC | urogenital system development | 177/8552 | 338/18723 | 7.51e-03 | 2.69e-02 | 177 |
| GO:20000274 | Esophagus | ESCC | regulation of animal organ morphogenesis | 71/8552 | 125/18723 | 7.97e-03 | 2.84e-02 | 71 |
| Page: 1 2 3 4 5 |
| Pathway ID | Tissue | Disease Stage | Description | Gene Ratio | Bg Ratio | pvalue | p.adjust | qvalue | Count |
| Page: 1 |
Top |
Cell-cell communication analysis |
| Identification of potential cell-cell interactions between two cell types and their ligand-receptor pairs for different disease states |
| Ligand | Receptor | LRpair | Pathway | Tissue | Disease Stage |
| WNT2 | FZD6_LRP5 | WNT2_FZD6_LRP5 | WNT | Endometrium | ADJ |
| WNT2 | FZD4_LRP6 | WNT2_FZD4_LRP6 | WNT | Endometrium | ADJ |
| WNT2 | FZD6_LRP6 | WNT2_FZD6_LRP6 | WNT | Endometrium | ADJ |
| WNT2 | FZD4_LRP6 | WNT2_FZD4_LRP6 | WNT | Endometrium | AEH |
| WNT2 | FZD4_LRP6 | WNT2_FZD4_LRP6 | WNT | Endometrium | EEC |
| WNT2 | FZD6_LRP6 | WNT2_FZD6_LRP6 | WNT | Endometrium | EEC |
| WNT2 | FZD10_LRP6 | WNT2_FZD10_LRP6 | WNT | Esophagus | ESCC |
| WNT2 | FZD3_LRP6 | WNT2_FZD3_LRP6 | WNT | Esophagus | ESCC |
| WNT2 | FZD4_LRP6 | WNT2_FZD4_LRP6 | WNT | Esophagus | ESCC |
| WNT2 | FZD5_LRP6 | WNT2_FZD5_LRP6 | WNT | Esophagus | ESCC |
| WNT2 | FZD6_LRP6 | WNT2_FZD6_LRP6 | WNT | Esophagus | ESCC |
| WNT2 | FZD8_LRP6 | WNT2_FZD8_LRP6 | WNT | Esophagus | ESCC |
| WNT2 | FZD4_LRP5 | WNT2_FZD4_LRP5 | WNT | HNSCC | OSCC |
| WNT2 | FZD6_LRP5 | WNT2_FZD6_LRP5 | WNT | HNSCC | OSCC |
| WNT2 | FZD6_LRP6 | WNT2_FZD6_LRP6 | WNT | HNSCC | OSCC |
| WNT2 | FZD6_LRP5 | WNT2_FZD6_LRP5 | WNT | HNSCC | Precancer |
| WNT2 | FZD6_LRP6 | WNT2_FZD6_LRP6 | WNT | HNSCC | Precancer |
| WNT2 | FZD1_LRP5 | WNT2_FZD1_LRP5 | WNT | THCA | Cancer |
| WNT2 | FZD4_LRP5 | WNT2_FZD4_LRP5 | WNT | THCA | Cancer |
| WNT2 | FZD6_LRP5 | WNT2_FZD6_LRP5 | WNT | THCA | Cancer |
| Page: 1 2 |
Top |
Single-cell gene regulatory network inference analysis |
| Find out the significant the regulons (TFs) and the target genes of each regulon across cell types for different disease states |
| TF | Cell Type | Tissue | Disease Stage | Target Gene | RSS | Regulon Activity |
| ∗The dot plots of a searched regulon are shown for all cell subpopulations in each disease state of each tissue based on the regulon specific score inferred using pySCENIC and by calculating the average expression. |
| Page: 1 |
Top |
Somatic mutation of malignant transformation related genes |
| Annotation of somatic variants for genes involved in malignant transformation |
| Hugo Symbol | Variant Class | Variant Classification | dbSNP RS | HGVSc | HGVSp | HGVSp Short | SWISSPROT | BIOTYPE | SIFT | PolyPhen | Tumor Sample Barcode | Tissue | Histology | Sex | Age | Stage | Therapy Types | Drugs | Outcome |
| WNT2 | SNV | Missense_Mutation | rs757215951 | c.433N>A | p.Ala145Thr | p.A145T | P09544 | protein_coding | tolerated(0.12) | benign(0.005) | TCGA-AR-A1AK-01 | Breast | breast invasive carcinoma | Female | >=65 | I/II | Hormone Therapy | anastrozole | SD |
| WNT2 | SNV | Missense_Mutation | novel | c.391G>A | p.Glu131Lys | p.E131K | P09544 | protein_coding | deleterious(0.01) | possibly_damaging(0.752) | TCGA-BH-A18U-01 | Breast | breast invasive carcinoma | Female | >=65 | III/IV | Unknown | Unknown | SD |
| WNT2 | insertion | In_Frame_Ins | novel | c.658_659insCCCACCACTGTGACTATGGAAAATGGTCCCAGGGCTTTAAATTTA | p.Cys220delinsSerHisHisCysAspTyrGlyLysTrpSerGlnGlyPheLysPheSer | p.C220delinsSHHCDYGKWSQGFKFS | P09544 | protein_coding | TCGA-AN-A049-01 | Breast | breast invasive carcinoma | Female | <65 | I/II | Unknown | Unknown | SD | ||
| WNT2 | SNV | Missense_Mutation | rs756788881 | c.1003C>T | p.Arg335Cys | p.R335C | P09544 | protein_coding | deleterious(0) | probably_damaging(0.953) | TCGA-A6-2679-01 | Colorectum | colon adenocarcinoma | Female | >=65 | I/II | Unknown | Unknown | SD |
| WNT2 | SNV | Missense_Mutation | rs377188020 | c.508G>A | p.Ala170Thr | p.A170T | P09544 | protein_coding | tolerated(0.28) | benign(0.036) | TCGA-D5-6928-01 | Colorectum | colon adenocarcinoma | Male | >=65 | I/II | Unknown | Unknown | SD |
| WNT2 | SNV | Missense_Mutation | rs779778873 | c.997N>A | p.Ala333Thr | p.A333T | P09544 | protein_coding | tolerated(0.39) | benign(0.124) | TCGA-AG-3882-01 | Colorectum | rectum adenocarcinoma | Female | >=65 | I/II | Unknown | Unknown | SD |
| WNT2 | SNV | Missense_Mutation | c.227N>A | p.Cys76Tyr | p.C76Y | P09544 | protein_coding | deleterious(0) | probably_damaging(1) | TCGA-EI-6507-01 | Colorectum | rectum adenocarcinoma | Male | <65 | I/II | Unknown | Unknown | SD | |
| WNT2 | SNV | Missense_Mutation | rs769047659 | c.16N>A | p.Gly6Ser | p.G6S | P09544 | protein_coding | tolerated(0.94) | benign(0) | TCGA-EI-6882-01 | Colorectum | rectum adenocarcinoma | Male | <65 | I/II | Unknown | Unknown | SD |
| WNT2 | SNV | Missense_Mutation | c.558N>T | p.Met186Ile | p.M186I | P09544 | protein_coding | deleterious(0) | probably_damaging(0.987) | TCGA-EI-6917-01 | Colorectum | rectum adenocarcinoma | Male | <65 | III/IV | Chemotherapy | 5fluorouracil+oxaciplatina+l-folinian | SD | |
| WNT2 | SNV | Missense_Mutation | c.575G>T | p.Arg192Ile | p.R192I | P09544 | protein_coding | deleterious(0) | probably_damaging(0.981) | TCGA-F5-6814-01 | Colorectum | rectum adenocarcinoma | Male | <65 | I/II | Unknown | Unknown | SD |
| Page: 1 2 3 4 5 6 |
Top |
Related drugs of malignant transformation related genes |
| Identification of chemicals and drugs interact with genes involved in malignant transfromation |
| (DGIdb 4.0) |
| Entrez ID | Symbol | Category | Interaction Types | Drug Claim Name | Drug Name | PMIDs |
| Page: 1 |

Copyright 2023-Present -The University of Texas Health Science Center at Houston |