
|
|||||
|
 | |
| |
| |
| |
| |
| |
|
Gene: WNK2 |
Gene summary for WNK2 |
| Gene information | Species | Human | Gene symbol | WNK2 | Gene ID | 65268 |
| Gene name | WNK lysine deficient protein kinase 2 | |
| Gene Alias | NY-CO-43 | |
| Cytomap | 9q22.31 | |
| Gene Type | protein-coding | GO ID | GO:0000165 | UniProtAcc | Q9Y3S1 |
Top |
Malignant transformation analysis |
| Identification of the aberrant gene expression in precancerous and cancerous lesions by comparing the gene expression of stem-like cells in diseased tissues with normal stem cells |
| Entrez ID | Symbol | Replicates | Species | Organ | Tissue | Adj P-value | Log2FC | Malignancy |
| 65268 | WNK2 | HTA11_3410_2000001011 | Human | Colorectum | AD | 6.37e-19 | -5.49e-01 | 0.0155 |
| 65268 | WNK2 | HTA11_2487_2000001011 | Human | Colorectum | SER | 5.62e-11 | -6.66e-01 | -0.1808 |
| 65268 | WNK2 | HTA11_1938_2000001011 | Human | Colorectum | AD | 3.09e-19 | -9.34e-01 | -0.0811 |
| 65268 | WNK2 | HTA11_78_2000001011 | Human | Colorectum | AD | 3.72e-27 | -9.33e-01 | -0.1088 |
| 65268 | WNK2 | HTA11_347_2000001011 | Human | Colorectum | AD | 2.65e-03 | 2.22e-01 | -0.1954 |
| 65268 | WNK2 | HTA11_3361_2000001011 | Human | Colorectum | AD | 1.50e-06 | -5.19e-01 | -0.1207 |
| 65268 | WNK2 | HTA11_83_2000001011 | Human | Colorectum | SER | 3.92e-06 | -5.66e-01 | -0.1526 |
| 65268 | WNK2 | HTA11_5212_2000001011 | Human | Colorectum | AD | 7.63e-04 | -6.38e-01 | -0.2061 |
| 65268 | WNK2 | HTA11_5216_2000001011 | Human | Colorectum | SER | 4.36e-03 | -5.86e-01 | -0.1462 |
| 65268 | WNK2 | HTA11_866_3004761011 | Human | Colorectum | AD | 1.05e-02 | -3.21e-01 | 0.096 |
| 65268 | WNK2 | HTA11_7663_2000001011 | Human | Colorectum | SER | 2.19e-02 | 5.63e-01 | 0.0131 |
| 65268 | WNK2 | HTA11_6818_2000001021 | Human | Colorectum | AD | 1.66e-07 | -6.06e-01 | 0.0588 |
| 65268 | WNK2 | HTA11_99999970781_79442 | Human | Colorectum | MSS | 3.78e-30 | -7.29e-01 | 0.294 |
| 65268 | WNK2 | HTA11_99999965062_69753 | Human | Colorectum | MSI-H | 1.32e-15 | 1.03e+00 | 0.3487 |
| 65268 | WNK2 | HTA11_99999971662_82457 | Human | Colorectum | MSS | 4.07e-05 | -4.38e-01 | 0.3859 |
| 65268 | WNK2 | HTA11_99999973899_84307 | Human | Colorectum | MSS | 7.34e-06 | -6.07e-01 | 0.2585 |
| 65268 | WNK2 | HTA11_99999974143_84620 | Human | Colorectum | MSS | 1.10e-46 | -9.71e-01 | 0.3005 |
| 65268 | WNK2 | F007 | Human | Colorectum | FAP | 1.29e-08 | -4.86e-01 | 0.1176 |
| 65268 | WNK2 | A002-C-010 | Human | Colorectum | FAP | 5.07e-03 | -2.69e-01 | 0.242 |
| 65268 | WNK2 | A001-C-207 | Human | Colorectum | FAP | 1.62e-16 | -6.29e-01 | 0.1278 |
| Page: 1 2 3 |
| Tissue | Expression Dynamics | Abbreviation |
| Colorectum (GSE201348) |  | FAP: Familial adenomatous polyposis |
| CRC: Colorectal cancer | ||
| Colorectum (HTA11) |  | AD: Adenomas |
| SER: Sessile serrated lesions | ||
| MSI-H: Microsatellite-high colorectal cancer | ||
| MSS: Microsatellite stable colorectal cancer | ||
| Oral Cavity | 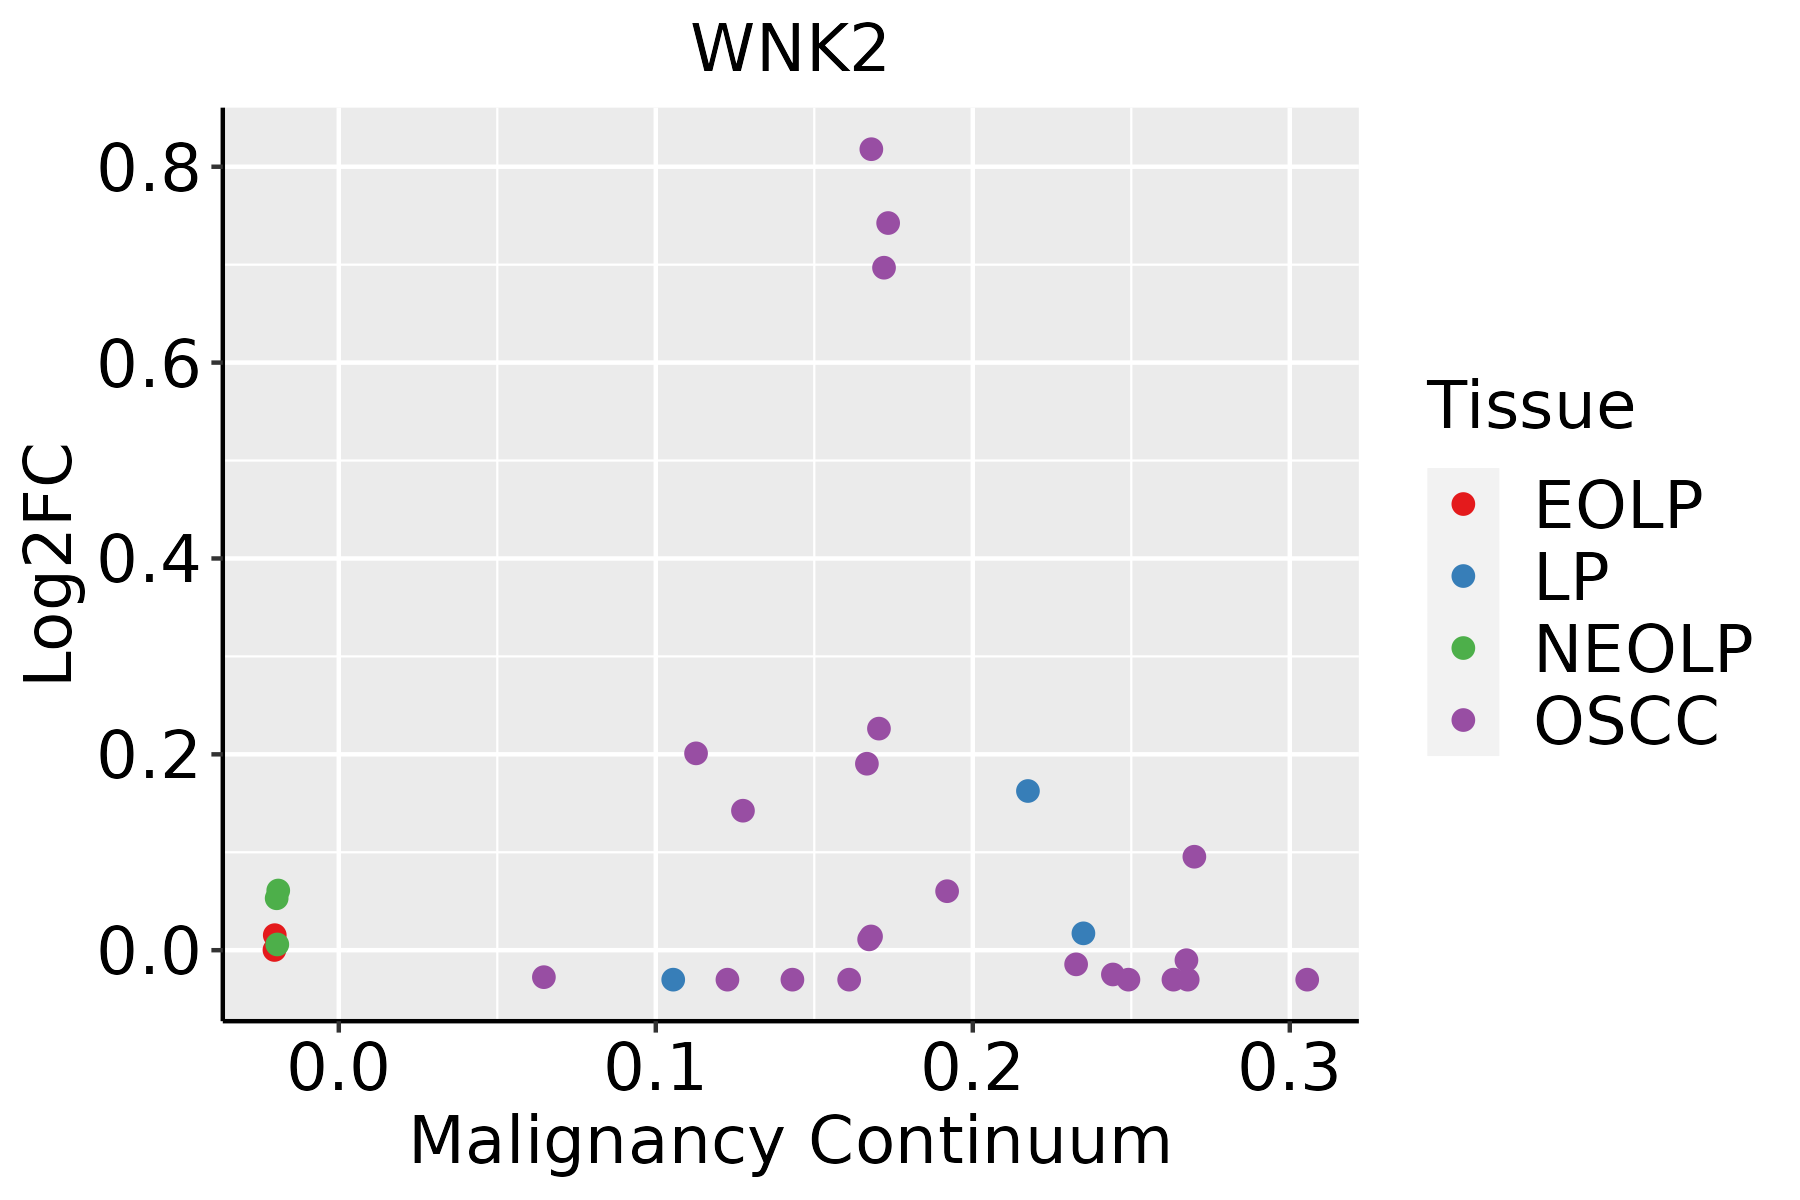 | EOLP: Erosive Oral lichen planus |
| LP: leukoplakia | ||
| NEOLP: Non-erosive oral lichen planus | ||
| OSCC: Oral squamous cell carcinoma |
| ∗log2FC in expression of this searched gene in stem-like cells from each diseased tissue sample relative to stem-like cells in normal samples in each tissue plotted against the malignancy continuum. Samples are colored based on if they are from different disease stage. |
Top |
Malignant transformation related pathway analysis |
| Find out the enriched GO biological processes and KEGG pathways involved in transition from healthy to precancer to cancer |
| Tissue | Disease Stage | Enriched GO biological Processes |
| Colorectum | AD |  |
| Colorectum | SER |  |
| Colorectum | MSS |  |
| Colorectum | MSI-H |  |
| Colorectum | FAP |  |
| ∗Top 15 enriched GO BP terms are showed in the bar plot of each disease state in each tissue. Each row represents a significant GO biological process which is colored according to the -log10(p.adjust). |
| Page: 1 2 3 4 5 6 7 8 9 |
| GO ID | Tissue | Disease Stage | Description | Gene Ratio | Bg Ratio | pvalue | p.adjust | Count |
| GO:0030111 | Colorectum | AD | regulation of Wnt signaling pathway | 102/3918 | 328/18723 | 8.51e-06 | 2.03e-04 | 102 |
| GO:0016055 | Colorectum | AD | Wnt signaling pathway | 130/3918 | 444/18723 | 1.60e-05 | 3.37e-04 | 130 |
| GO:0198738 | Colorectum | AD | cell-cell signaling by wnt | 130/3918 | 446/18723 | 2.02e-05 | 4.10e-04 | 130 |
| GO:0046777 | Colorectum | AD | protein autophosphorylation | 74/3918 | 227/18723 | 2.48e-05 | 4.76e-04 | 74 |
| GO:0002028 | Colorectum | AD | regulation of sodium ion transport | 36/3918 | 90/18723 | 2.89e-05 | 5.37e-04 | 36 |
| GO:0060070 | Colorectum | AD | canonical Wnt signaling pathway | 90/3918 | 303/18723 | 1.76e-04 | 2.38e-03 | 90 |
| GO:0060828 | Colorectum | AD | regulation of canonical Wnt signaling pathway | 77/3918 | 253/18723 | 2.19e-04 | 2.87e-03 | 77 |
| GO:0010765 | Colorectum | AD | positive regulation of sodium ion transport | 17/3918 | 35/18723 | 2.48e-04 | 3.13e-03 | 17 |
| GO:1902305 | Colorectum | AD | regulation of sodium ion transmembrane transport | 27/3918 | 68/18723 | 3.19e-04 | 3.80e-03 | 27 |
| GO:0043409 | Colorectum | AD | negative regulation of MAPK cascade | 57/3918 | 180/18723 | 4.61e-04 | 5.14e-03 | 57 |
| GO:2000649 | Colorectum | AD | regulation of sodium ion transmembrane transporter activity | 23/3918 | 58/18723 | 8.82e-04 | 8.53e-03 | 23 |
| GO:0030177 | Colorectum | AD | positive regulation of Wnt signaling pathway | 45/3918 | 140/18723 | 1.23e-03 | 1.09e-02 | 45 |
| GO:1902307 | Colorectum | AD | positive regulation of sodium ion transmembrane transport | 11/3918 | 21/18723 | 1.43e-03 | 1.22e-02 | 11 |
| GO:2000651 | Colorectum | AD | positive regulation of sodium ion transmembrane transporter activity | 9/3918 | 16/18723 | 2.06e-03 | 1.64e-02 | 9 |
| GO:0032411 | Colorectum | AD | positive regulation of transporter activity | 37/3918 | 120/18723 | 6.82e-03 | 4.22e-02 | 37 |
| GO:00467771 | Colorectum | SER | protein autophosphorylation | 60/2897 | 227/18723 | 1.36e-05 | 4.25e-04 | 60 |
| GO:00020281 | Colorectum | SER | regulation of sodium ion transport | 28/2897 | 90/18723 | 1.45e-04 | 2.86e-03 | 28 |
| GO:00160551 | Colorectum | SER | Wnt signaling pathway | 97/2897 | 444/18723 | 2.02e-04 | 3.68e-03 | 97 |
| GO:01987381 | Colorectum | SER | cell-cell signaling by wnt | 97/2897 | 446/18723 | 2.39e-04 | 4.11e-03 | 97 |
| GO:00301111 | Colorectum | SER | regulation of Wnt signaling pathway | 75/2897 | 328/18723 | 2.47e-04 | 4.20e-03 | 75 |
| Page: 1 2 3 4 5 6 7 |
| Pathway ID | Tissue | Disease Stage | Description | Gene Ratio | Bg Ratio | pvalue | p.adjust | qvalue | Count |
| Page: 1 |
Top |
Cell-cell communication analysis |
| Identification of potential cell-cell interactions between two cell types and their ligand-receptor pairs for different disease states |
| Ligand | Receptor | LRpair | Pathway | Tissue | Disease Stage |
| Page: 1 |
Top |
Single-cell gene regulatory network inference analysis |
| Find out the significant the regulons (TFs) and the target genes of each regulon across cell types for different disease states |
| TF | Cell Type | Tissue | Disease Stage | Target Gene | RSS | Regulon Activity |
| ∗The dot plots of a searched regulon are shown for all cell subpopulations in each disease state of each tissue based on the regulon specific score inferred using pySCENIC and by calculating the average expression. |
| Page: 1 |
Top |
Somatic mutation of malignant transformation related genes |
| Annotation of somatic variants for genes involved in malignant transformation |
| Hugo Symbol | Variant Class | Variant Classification | dbSNP RS | HGVSc | HGVSp | HGVSp Short | SWISSPROT | BIOTYPE | SIFT | PolyPhen | Tumor Sample Barcode | Tissue | Histology | Sex | Age | Stage | Therapy Types | Drugs | Outcome |
| WNK2 | SNV | Missense_Mutation | c.2279C>T | p.Pro760Leu | p.P760L | Q9Y3S1 | protein_coding | tolerated(0.06) | benign(0.007) | TCGA-A2-A1FW-01 | Breast | breast invasive carcinoma | Female | <65 | III/IV | Chemotherapy | cytoxan | SD | |
| WNK2 | SNV | Missense_Mutation | rs765224623 | c.4892G>A | p.Arg1631His | p.R1631H | Q9Y3S1 | protein_coding | tolerated(0.65) | benign(0) | TCGA-A8-A09Z-01 | Breast | breast invasive carcinoma | Female | >=65 | I/II | Unknown | Unknown | SD |
| WNK2 | SNV | Missense_Mutation | rs763861327 | c.1318N>A | p.Glu440Lys | p.E440K | Q9Y3S1 | protein_coding | deleterious(0.01) | probably_damaging(0.998) | TCGA-AC-A23H-01 | Breast | breast invasive carcinoma | Female | >=65 | I/II | Unknown | Unknown | PD |
| WNK2 | SNV | Missense_Mutation | c.4882G>C | p.Asp1628His | p.D1628H | Q9Y3S1 | protein_coding | deleterious(0.04) | probably_damaging(0.996) | TCGA-AR-A1AH-01 | Breast | breast invasive carcinoma | Female | <65 | I/II | Unspecific | PD | ||
| WNK2 | SNV | Missense_Mutation | novel | c.5977G>T | p.Ala1993Ser | p.A1993S | Q9Y3S1 | protein_coding | deleterious(0.02) | probably_damaging(0.989) | TCGA-AR-A1AY-01 | Breast | breast invasive carcinoma | Female | >=65 | I/II | Unspecific | Doxorubicin | SD |
| WNK2 | SNV | Missense_Mutation | c.1278N>G | p.Ile426Met | p.I426M | Q9Y3S1 | protein_coding | deleterious(0) | probably_damaging(0.995) | TCGA-BH-A0HP-01 | Breast | breast invasive carcinoma | Female | >=65 | III/IV | Chemotherapy | doxorubicin | SD | |
| WNK2 | SNV | Missense_Mutation | c.4493N>C | p.Glu1498Ala | p.E1498A | Q9Y3S1 | protein_coding | tolerated(0.07) | possibly_damaging(0.76) | TCGA-BH-A18H-01 | Breast | breast invasive carcinoma | Female | <65 | I/II | Chemotherapy | adriamycin | CR | |
| WNK2 | insertion | In_Frame_Ins | novel | c.1523_1524insCTCCAGCTCACCCTCTGC | p.Asp508_Glu509insSerSerSerProSerAla | p.D508_E509insSSSPSA | Q9Y3S1 | protein_coding | TCGA-A8-A09B-01 | Breast | breast invasive carcinoma | Female | <65 | III/IV | Chemotherapy | 5-fluorouracil | SD | ||
| WNK2 | deletion | Frame_Shift_Del | novel | c.2256delN | p.Gln753SerfsTer23 | p.Q753Sfs*23 | Q9Y3S1 | protein_coding | TCGA-D8-A27V-01 | Breast | breast invasive carcinoma | Female | <65 | I/II | Hormone Therapy | tamoxiphen | SD | ||
| WNK2 | SNV | Missense_Mutation | novel | c.720N>T | p.Lys240Asn | p.K240N | Q9Y3S1 | protein_coding | deleterious(0) | probably_damaging(0.999) | TCGA-2W-A8YY-01 | Cervix | cervical & endocervical cancer | Female | <65 | I/II | Chemotherapy | cisplatin | CR |
| Page: 1 2 3 4 5 6 7 8 9 10 11 12 13 14 15 16 17 |
Top |
Related drugs of malignant transformation related genes |
| Identification of chemicals and drugs interact with genes involved in malignant transfromation |
| (DGIdb 4.0) |
| Entrez ID | Symbol | Category | Interaction Types | Drug Claim Name | Drug Name | PMIDs |
| 65268 | WNK2 | KINASE, SERINE THREONINE KINASE, DRUGGABLE GENOME, ENZYME | inhibitor | 249565802 |
| Page: 1 |

Copyright 2023-Present -The University of Texas Health Science Center at Houston |