
|
|||||
|
 | |
| |
| |
| |
| |
| |
|
Gene: WLS |
Gene summary for WLS |
| Gene information | Species | Human | Gene symbol | WLS | Gene ID | 79971 |
| Gene name | Wnt ligand secretion mediator | |
| Gene Alias | C1orf139 | |
| Cytomap | 1p31.3 | |
| Gene Type | protein-coding | GO ID | GO:0001704 | UniProtAcc | Q5T9L3 |
Top |
Malignant transformation analysis |
| Identification of the aberrant gene expression in precancerous and cancerous lesions by comparing the gene expression of stem-like cells in diseased tissues with normal stem cells |
| Entrez ID | Symbol | Replicates | Species | Organ | Tissue | Adj P-value | Log2FC | Malignancy |
| 79971 | WLS | HTA11_3410_2000001011 | Human | Colorectum | AD | 2.39e-13 | -5.05e-01 | 0.0155 |
| 79971 | WLS | HTA11_2487_2000001011 | Human | Colorectum | SER | 1.91e-02 | -3.87e-01 | -0.1808 |
| 79971 | WLS | HTA11_347_2000001011 | Human | Colorectum | AD | 3.79e-03 | -1.09e-01 | -0.1954 |
| 79971 | WLS | HTA11_3361_2000001011 | Human | Colorectum | AD | 9.37e-03 | -4.45e-01 | -0.1207 |
| 79971 | WLS | HTA11_696_2000001011 | Human | Colorectum | AD | 2.83e-05 | -4.16e-01 | -0.1464 |
| 79971 | WLS | HTA11_866_2000001011 | Human | Colorectum | AD | 1.44e-06 | -4.46e-01 | -0.1001 |
| 79971 | WLS | HTA11_1391_2000001011 | Human | Colorectum | AD | 1.52e-03 | -3.77e-01 | -0.059 |
| 79971 | WLS | HTA11_546_2000001011 | Human | Colorectum | AD | 3.69e-02 | -4.67e-01 | -0.0842 |
| 79971 | WLS | HTA11_866_3004761011 | Human | Colorectum | AD | 6.67e-06 | -4.02e-01 | 0.096 |
| 79971 | WLS | HTA11_10711_2000001011 | Human | Colorectum | AD | 1.46e-02 | -4.00e-01 | 0.0338 |
| 79971 | WLS | HTA11_7696_3000711011 | Human | Colorectum | AD | 8.10e-09 | -4.22e-01 | 0.0674 |
| 79971 | WLS | HTA11_99999970781_79442 | Human | Colorectum | MSS | 7.58e-05 | -3.78e-01 | 0.294 |
| 79971 | WLS | HTA11_99999965104_69814 | Human | Colorectum | MSS | 3.73e-02 | -3.56e-01 | 0.281 |
| 79971 | WLS | HTA11_99999973899_84307 | Human | Colorectum | MSS | 2.55e-05 | -5.54e-01 | 0.2585 |
| 79971 | WLS | HTA11_99999974143_84620 | Human | Colorectum | MSS | 2.64e-04 | -3.97e-01 | 0.3005 |
| 79971 | WLS | F007 | Human | Colorectum | FAP | 3.62e-03 | -2.30e-01 | 0.1176 |
| 79971 | WLS | A001-C-207 | Human | Colorectum | FAP | 5.84e-06 | -3.41e-01 | 0.1278 |
| 79971 | WLS | A015-C-203 | Human | Colorectum | FAP | 3.28e-13 | -3.93e-01 | -0.1294 |
| 79971 | WLS | A015-C-204 | Human | Colorectum | FAP | 1.41e-04 | -2.82e-01 | -0.0228 |
| 79971 | WLS | A002-C-201 | Human | Colorectum | FAP | 7.41e-15 | -4.46e-01 | 0.0324 |
| Page: 1 2 3 4 5 6 7 8 |
| Tissue | Expression Dynamics | Abbreviation |
| Colorectum (GSE201348) |  | FAP: Familial adenomatous polyposis |
| CRC: Colorectal cancer | ||
| Colorectum (HTA11) |  | AD: Adenomas |
| SER: Sessile serrated lesions | ||
| MSI-H: Microsatellite-high colorectal cancer | ||
| MSS: Microsatellite stable colorectal cancer | ||
| Esophagus | 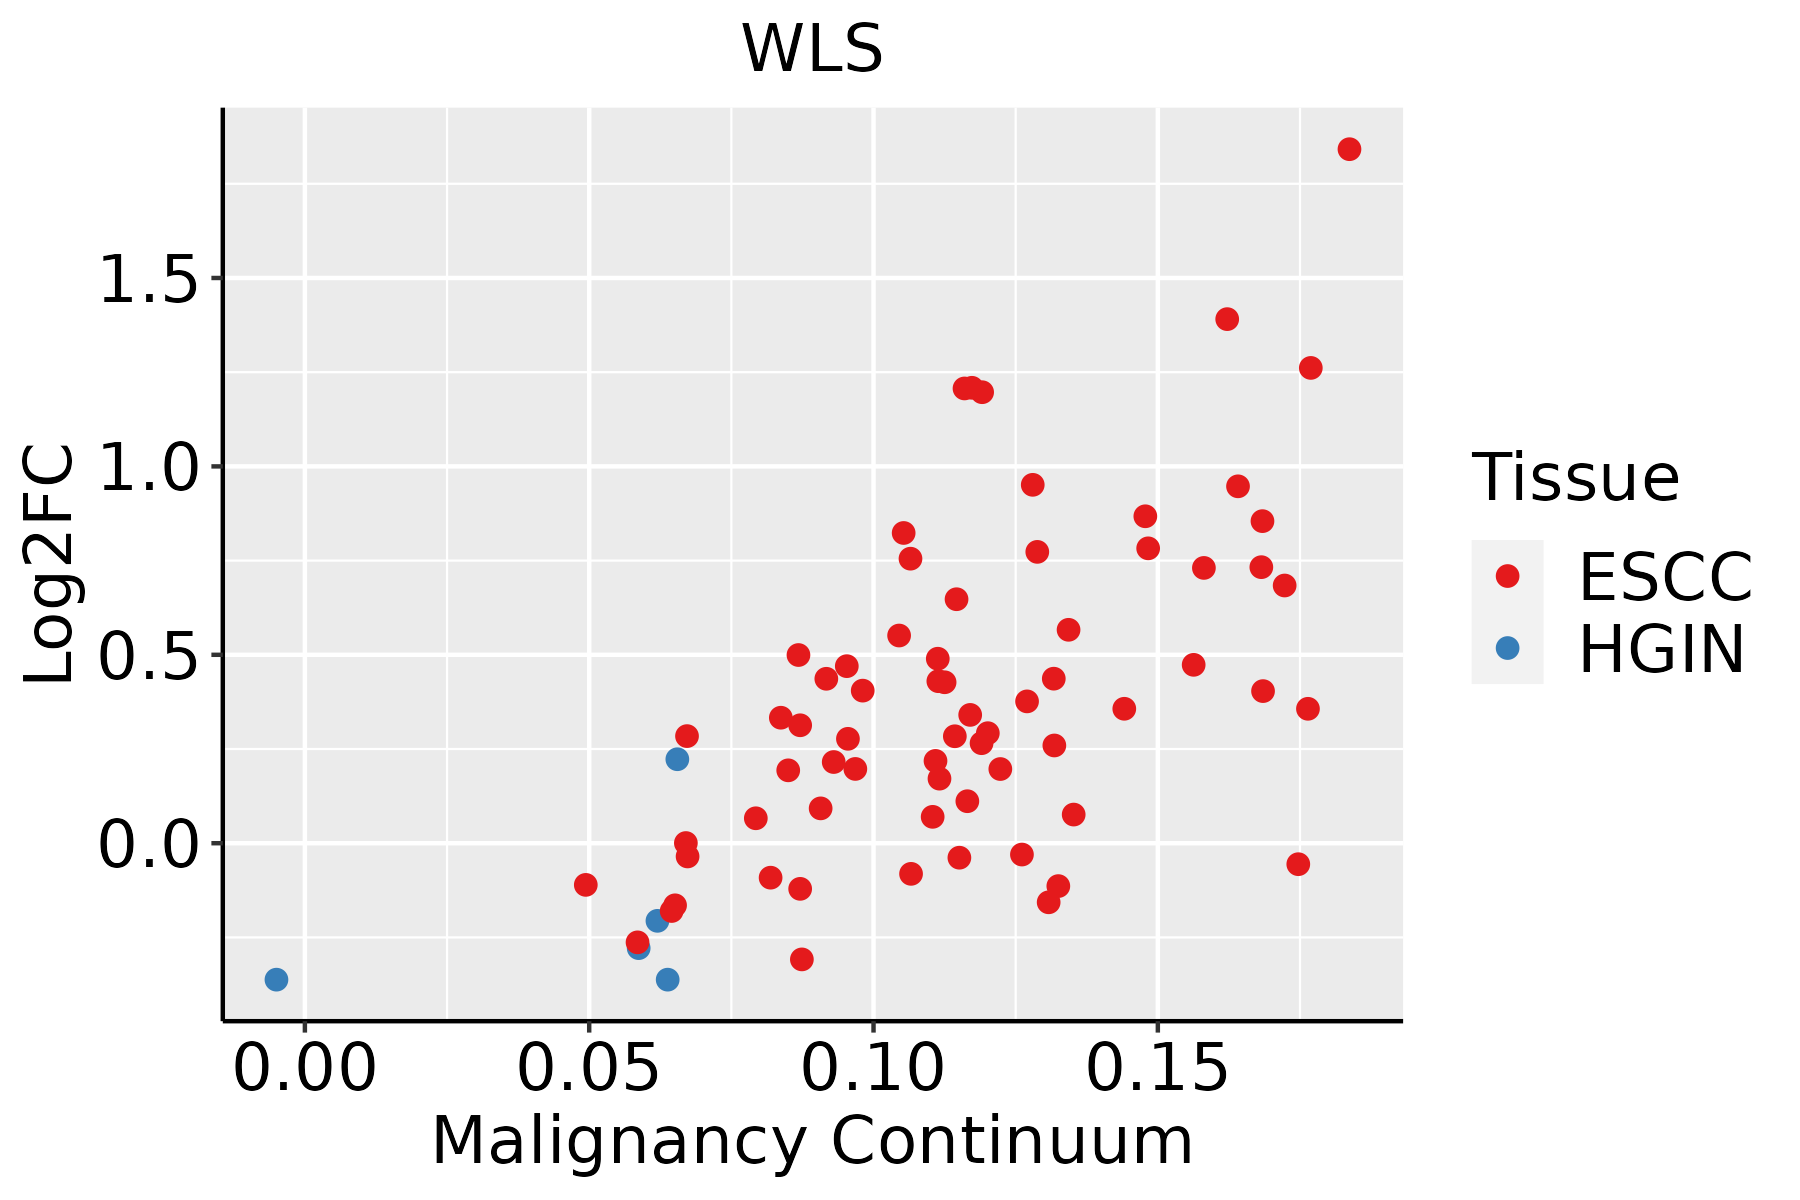 | ESCC: Esophageal squamous cell carcinoma |
| HGIN: High-grade intraepithelial neoplasias | ||
| LGIN: Low-grade intraepithelial neoplasias | ||
| Liver | 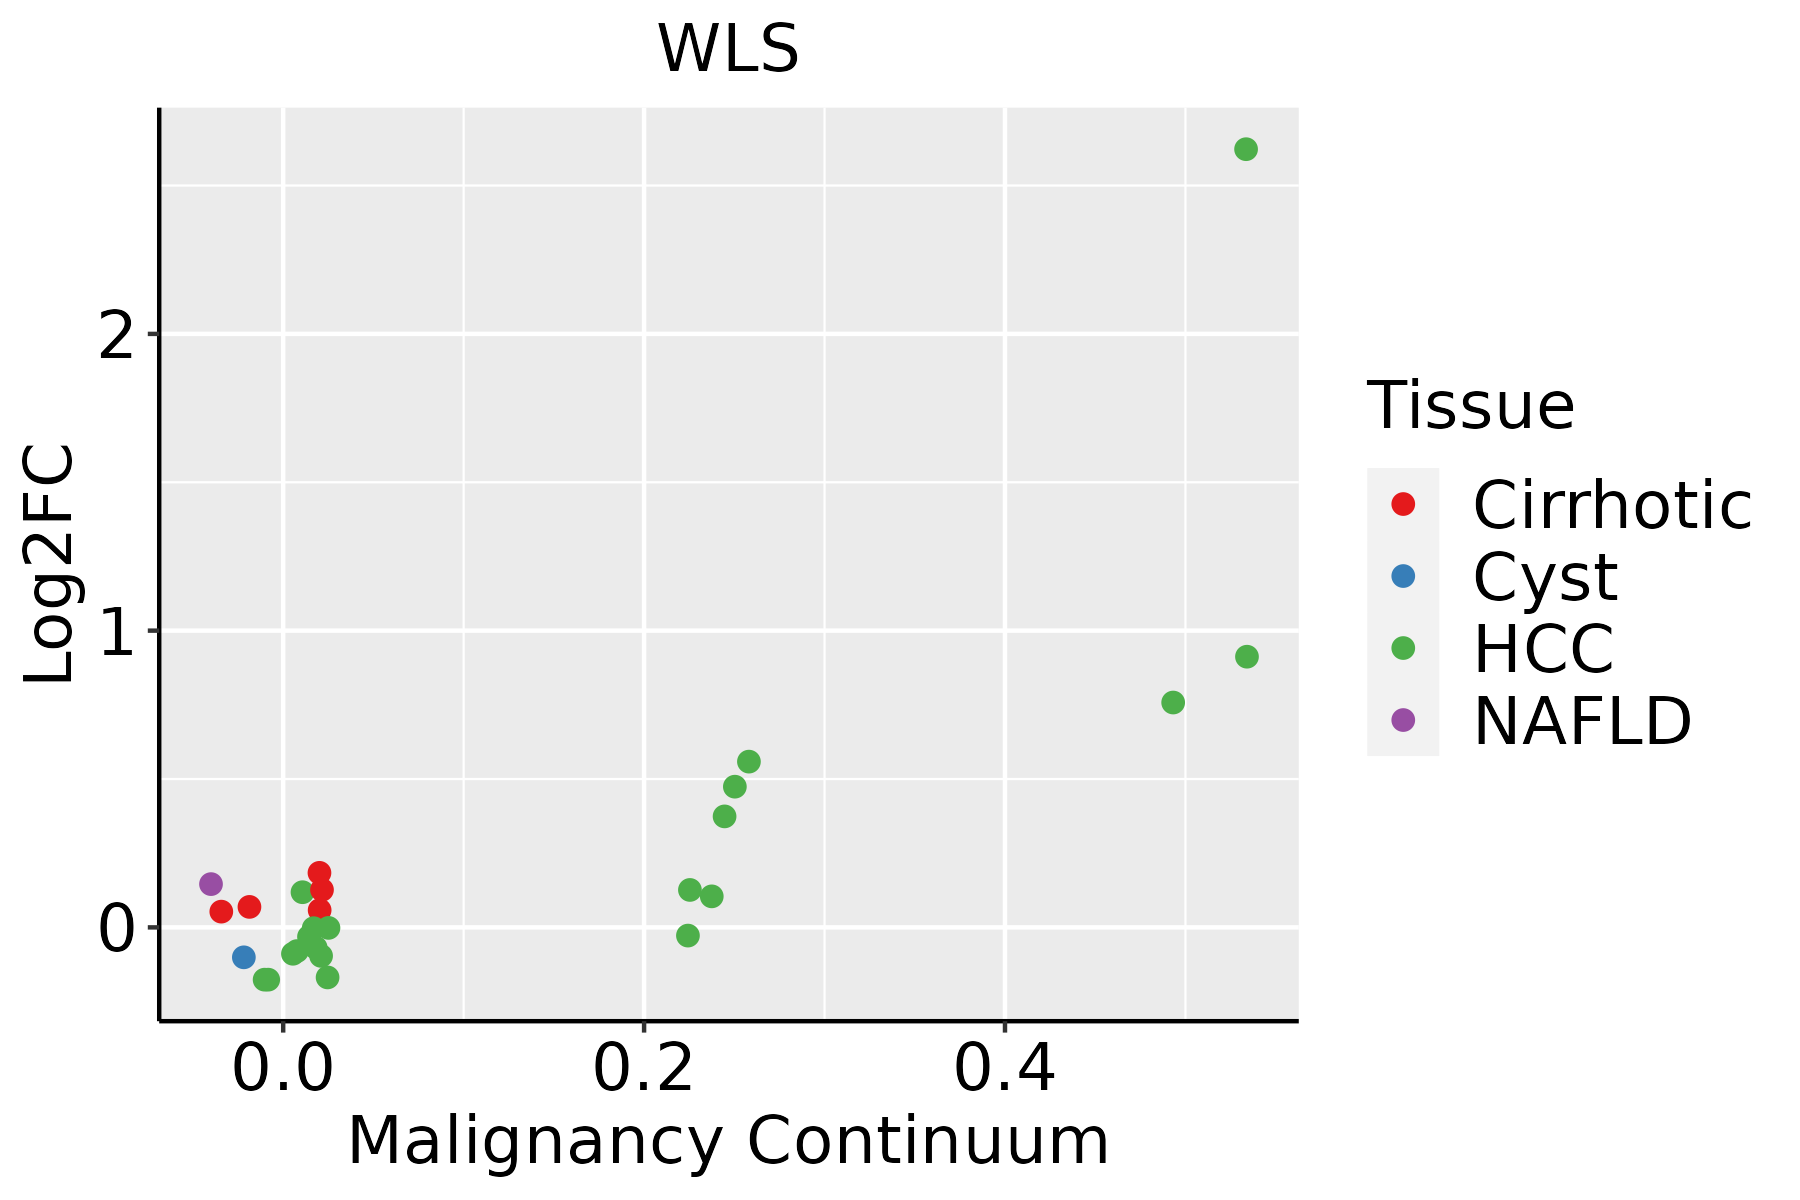 | HCC: Hepatocellular carcinoma |
| NAFLD: Non-alcoholic fatty liver disease | ||
| Oral Cavity | 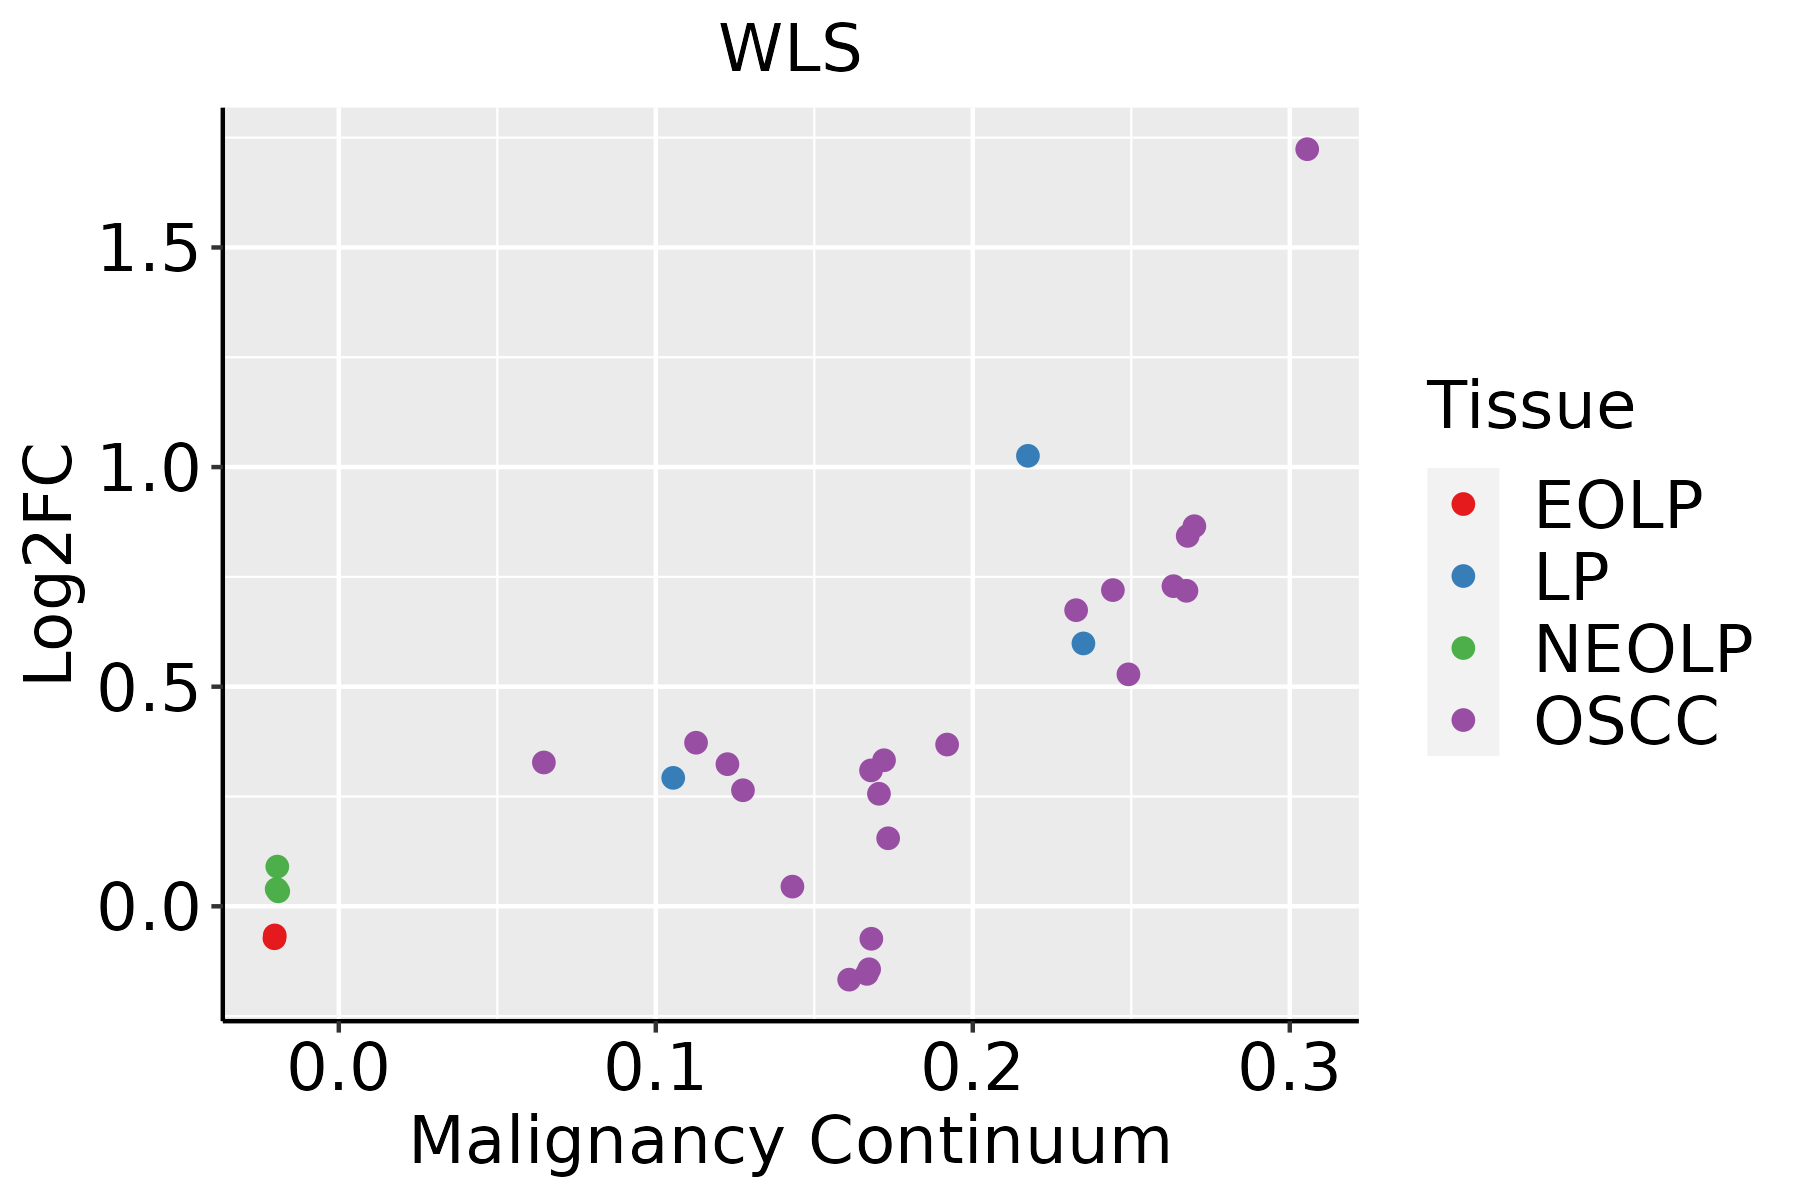 | EOLP: Erosive Oral lichen planus |
| LP: leukoplakia | ||
| NEOLP: Non-erosive oral lichen planus | ||
| OSCC: Oral squamous cell carcinoma | ||
| Prostate | 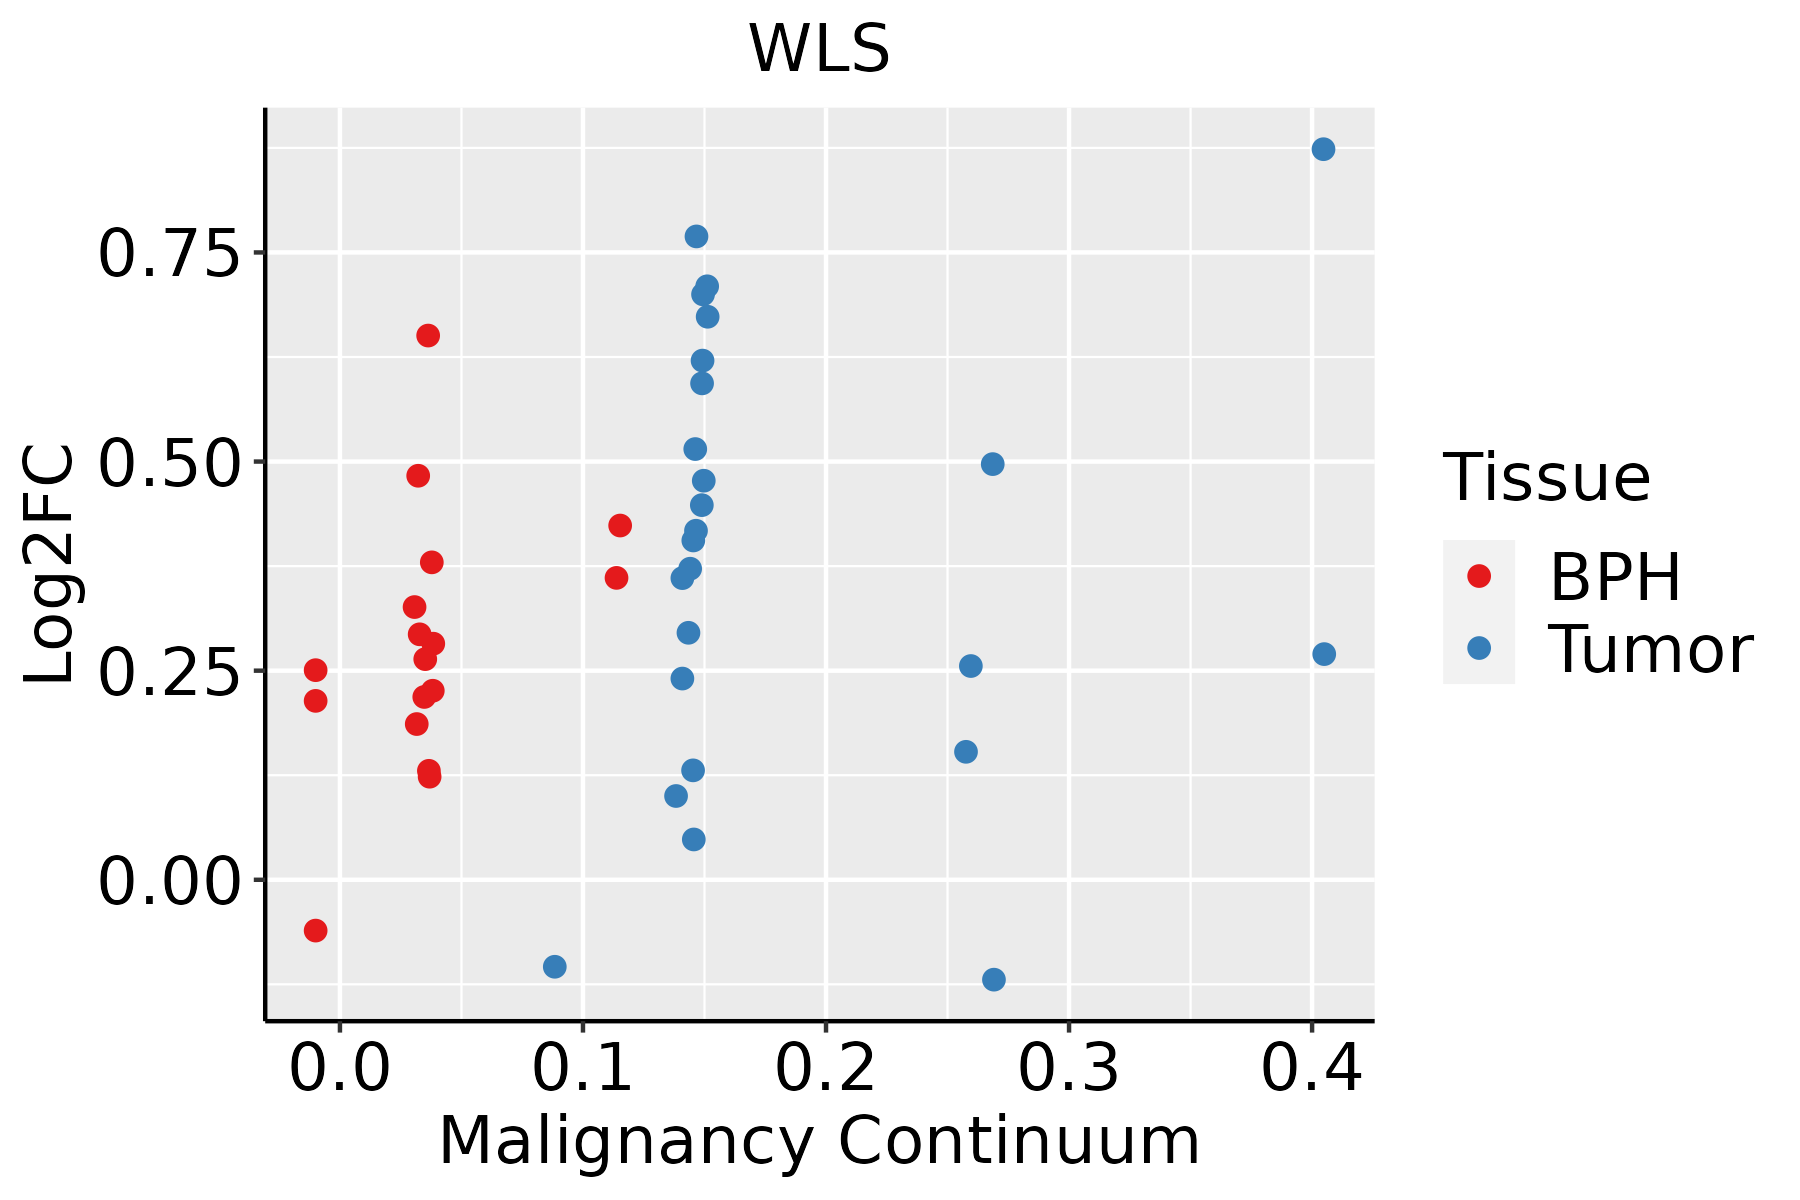 | BPH: Benign Prostatic Hyperplasia |
| Skin | 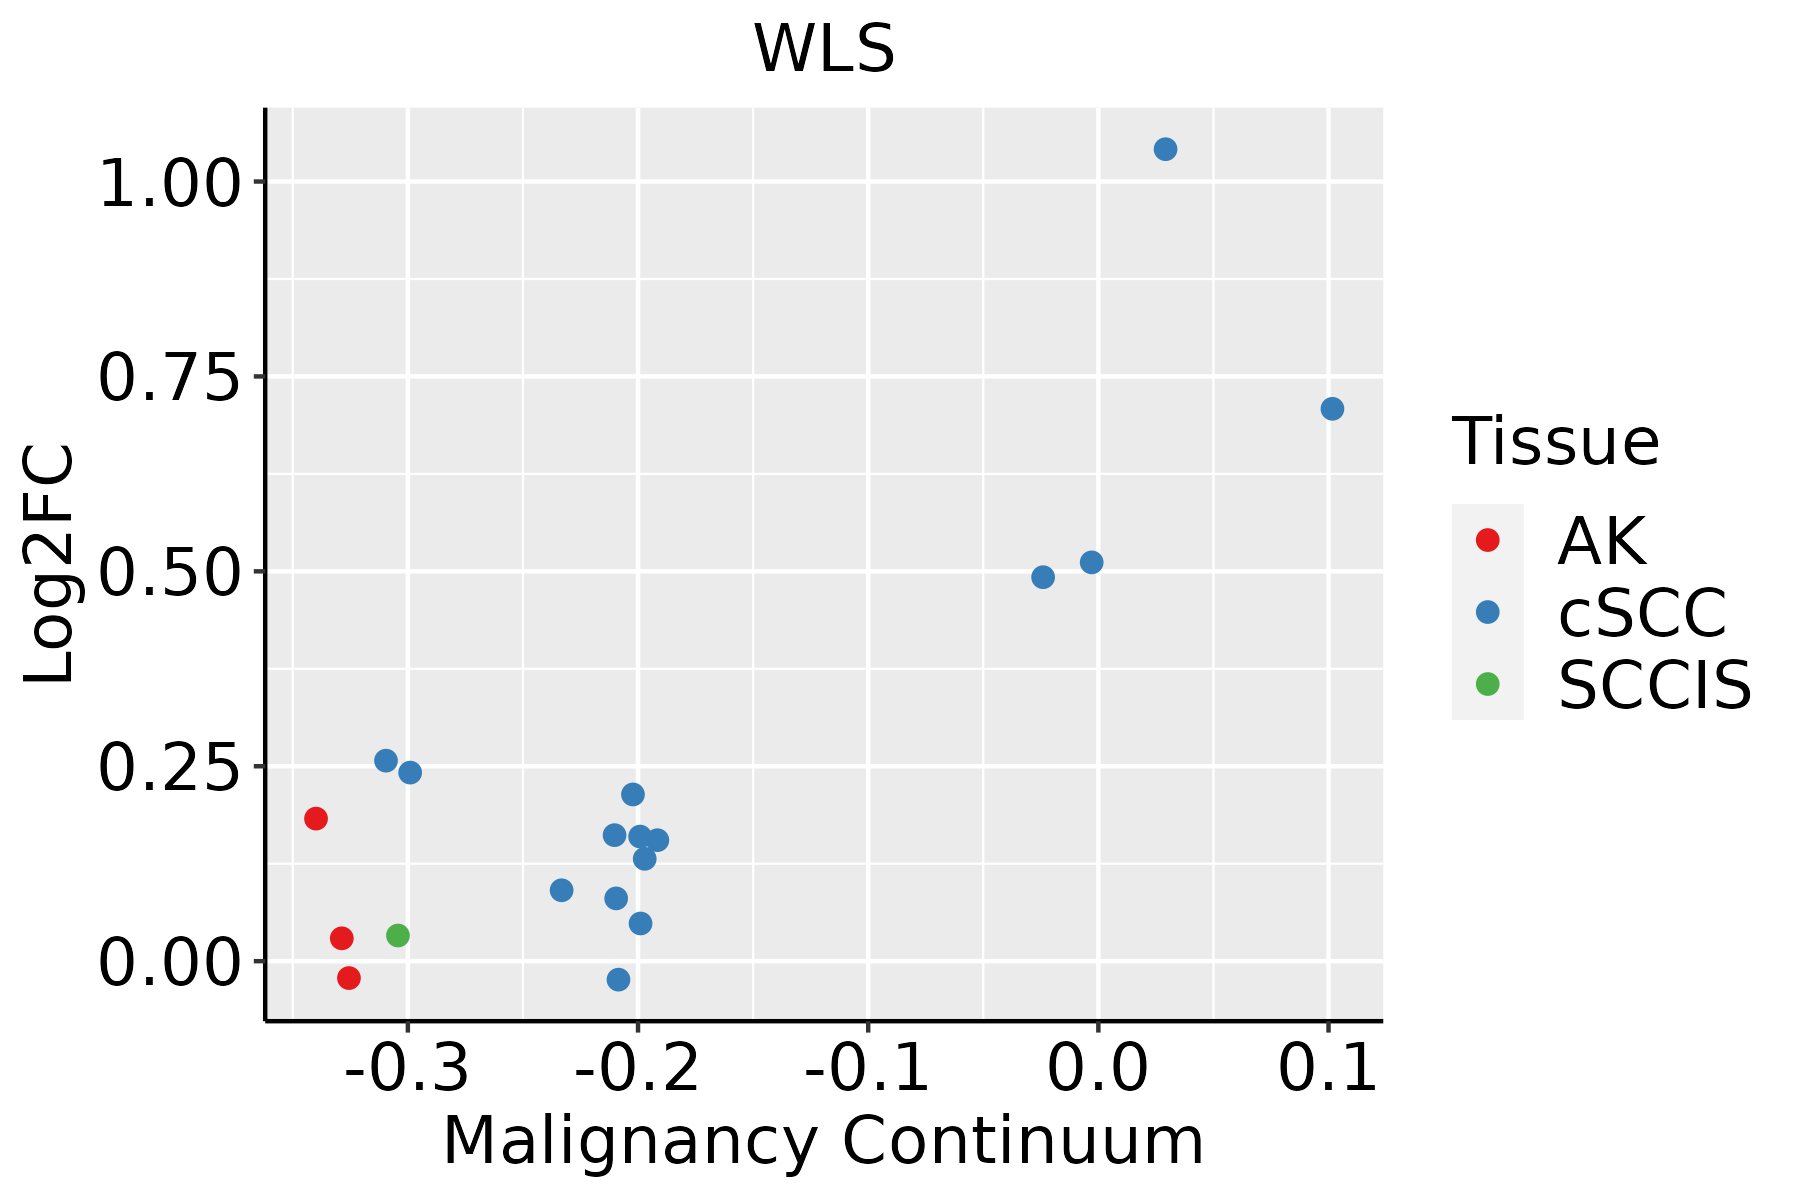 | AK: Actinic keratosis |
| cSCC: Cutaneous squamous cell carcinoma | ||
| SCCIS:squamous cell carcinoma in situ | ||
| Thyroid | 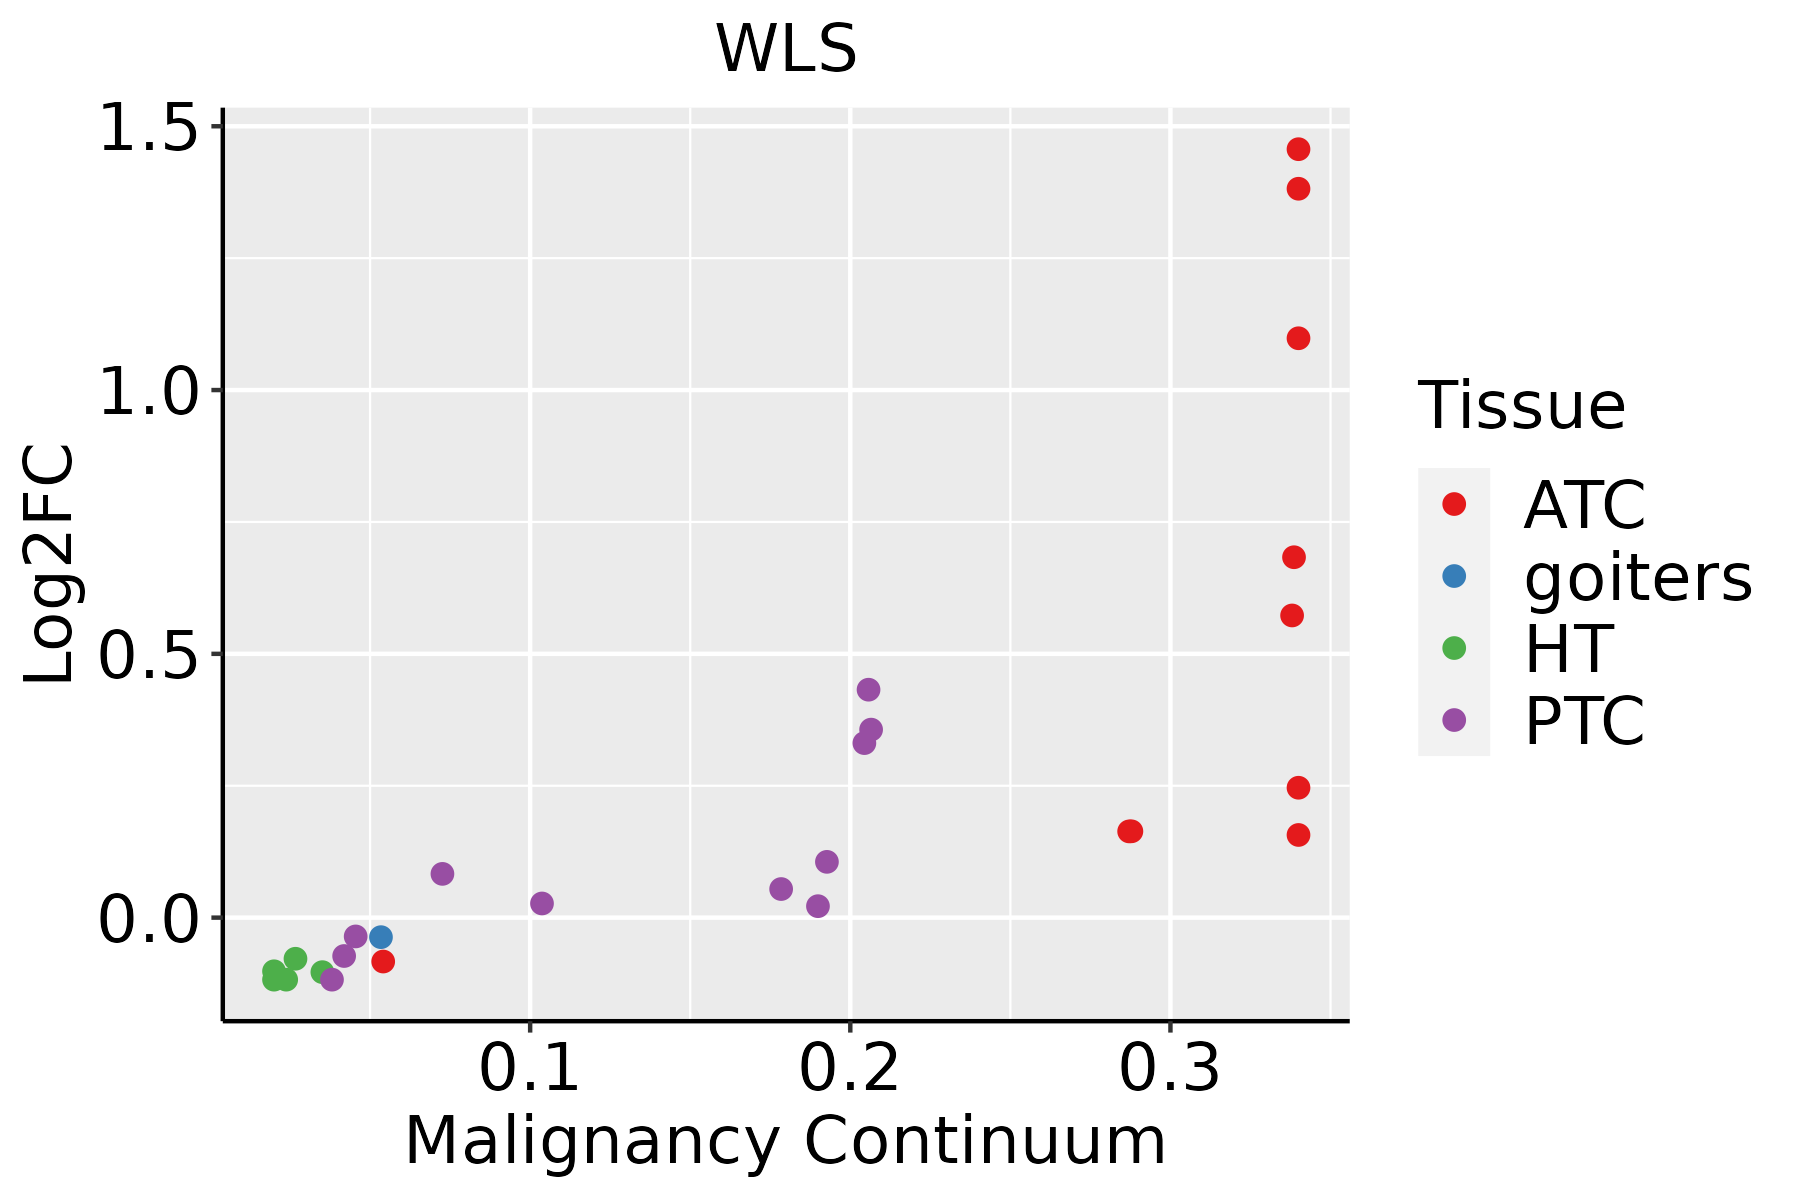 | ATC: Anaplastic thyroid cancer |
| HT: Hashimoto's thyroiditis | ||
| PTC: Papillary thyroid cancer |
| ∗log2FC in expression of this searched gene in stem-like cells from each diseased tissue sample relative to stem-like cells in normal samples in each tissue plotted against the malignancy continuum. Samples are colored based on if they are from different disease stage. |
Top |
Malignant transformation related pathway analysis |
| Find out the enriched GO biological processes and KEGG pathways involved in transition from healthy to precancer to cancer |
| Tissue | Disease Stage | Enriched GO biological Processes |
| Colorectum | AD |  |
| Colorectum | SER |  |
| Colorectum | MSS |  |
| Colorectum | MSI-H |  |
| Colorectum | FAP |  |
| ∗Top 15 enriched GO BP terms are showed in the bar plot of each disease state in each tissue. Each row represents a significant GO biological process which is colored according to the -log10(p.adjust). |
| Page: 1 2 3 4 5 6 7 8 9 |
| GO ID | Tissue | Disease Stage | Description | Gene Ratio | Bg Ratio | pvalue | p.adjust | Count |
| GO:0048732 | Colorectum | AD | gland development | 149/3918 | 436/18723 | 6.07e-11 | 6.33e-09 | 149 |
| GO:1904951 | Colorectum | AD | positive regulation of establishment of protein localization | 112/3918 | 319/18723 | 2.55e-09 | 1.80e-07 | 112 |
| GO:0051222 | Colorectum | AD | positive regulation of protein transport | 106/3918 | 303/18723 | 8.45e-09 | 5.08e-07 | 106 |
| GO:0030111 | Colorectum | AD | regulation of Wnt signaling pathway | 102/3918 | 328/18723 | 8.51e-06 | 2.03e-04 | 102 |
| GO:0016055 | Colorectum | AD | Wnt signaling pathway | 130/3918 | 444/18723 | 1.60e-05 | 3.37e-04 | 130 |
| GO:0198738 | Colorectum | AD | cell-cell signaling by wnt | 130/3918 | 446/18723 | 2.02e-05 | 4.10e-04 | 130 |
| GO:0050708 | Colorectum | AD | regulation of protein secretion | 83/3918 | 268/18723 | 6.59e-05 | 1.07e-03 | 83 |
| GO:0009306 | Colorectum | AD | protein secretion | 105/3918 | 359/18723 | 1.05e-04 | 1.57e-03 | 105 |
| GO:0035592 | Colorectum | AD | establishment of protein localization to extracellular region | 105/3918 | 360/18723 | 1.18e-04 | 1.73e-03 | 105 |
| GO:0060070 | Colorectum | AD | canonical Wnt signaling pathway | 90/3918 | 303/18723 | 1.76e-04 | 2.38e-03 | 90 |
| GO:0071692 | Colorectum | AD | protein localization to extracellular region | 106/3918 | 368/18723 | 1.86e-04 | 2.49e-03 | 106 |
| GO:0043123 | Colorectum | AD | positive regulation of I-kappaB kinase/NF-kappaB signaling | 60/3918 | 186/18723 | 1.91e-04 | 2.56e-03 | 60 |
| GO:0043122 | Colorectum | AD | regulation of I-kappaB kinase/NF-kappaB signaling | 76/3918 | 249/18723 | 2.17e-04 | 2.85e-03 | 76 |
| GO:0060828 | Colorectum | AD | regulation of canonical Wnt signaling pathway | 77/3918 | 253/18723 | 2.19e-04 | 2.87e-03 | 77 |
| GO:0051047 | Colorectum | AD | positive regulation of secretion | 90/3918 | 310/18723 | 4.11e-04 | 4.66e-03 | 90 |
| GO:0007249 | Colorectum | AD | I-kappaB kinase/NF-kappaB signaling | 82/3918 | 281/18723 | 6.09e-04 | 6.40e-03 | 82 |
| GO:1903532 | Colorectum | AD | positive regulation of secretion by cell | 82/3918 | 282/18723 | 6.85e-04 | 7.00e-03 | 82 |
| GO:0030901 | Colorectum | AD | midbrain development | 32/3918 | 90/18723 | 9.45e-04 | 8.95e-03 | 32 |
| GO:0030177 | Colorectum | AD | positive regulation of Wnt signaling pathway | 45/3918 | 140/18723 | 1.23e-03 | 1.09e-02 | 45 |
| GO:0050714 | Colorectum | AD | positive regulation of protein secretion | 42/3918 | 137/18723 | 4.64e-03 | 3.16e-02 | 42 |
| Page: 1 2 3 4 5 6 7 8 9 10 11 12 13 14 15 |
| Pathway ID | Tissue | Disease Stage | Description | Gene Ratio | Bg Ratio | pvalue | p.adjust | qvalue | Count |
| Page: 1 |
Top |
Cell-cell communication analysis |
| Identification of potential cell-cell interactions between two cell types and their ligand-receptor pairs for different disease states |
| Ligand | Receptor | LRpair | Pathway | Tissue | Disease Stage |
| Page: 1 |
Top |
Single-cell gene regulatory network inference analysis |
| Find out the significant the regulons (TFs) and the target genes of each regulon across cell types for different disease states |
| TF | Cell Type | Tissue | Disease Stage | Target Gene | RSS | Regulon Activity |
| ∗The dot plots of a searched regulon are shown for all cell subpopulations in each disease state of each tissue based on the regulon specific score inferred using pySCENIC and by calculating the average expression. |
| Page: 1 |
Top |
Somatic mutation of malignant transformation related genes |
| Annotation of somatic variants for genes involved in malignant transformation |
| Hugo Symbol | Variant Class | Variant Classification | dbSNP RS | HGVSc | HGVSp | HGVSp Short | SWISSPROT | BIOTYPE | SIFT | PolyPhen | Tumor Sample Barcode | Tissue | Histology | Sex | Age | Stage | Therapy Types | Drugs | Outcome |
| WLS | SNV | Missense_Mutation | novel | c.1484A>C | p.Lys495Thr | p.K495T | Q5T9L3 | protein_coding | deleterious(0.03) | probably_damaging(0.921) | TCGA-AN-A046-01 | Breast | breast invasive carcinoma | Female | >=65 | I/II | Unknown | Unknown | SD |
| WLS | SNV | Missense_Mutation | c.473N>C | p.Leu158Pro | p.L158P | Q5T9L3 | protein_coding | deleterious(0) | probably_damaging(0.98) | TCGA-AR-A251-01 | Breast | breast invasive carcinoma | Female | <65 | III/IV | Chemotherapy | doxorubicin | SD | |
| WLS | SNV | Missense_Mutation | c.466N>G | p.Arg156Gly | p.R156G | Q5T9L3 | protein_coding | deleterious(0) | probably_damaging(0.988) | TCGA-BH-A0AY-01 | Breast | breast invasive carcinoma | Female | <65 | I/II | Chemotherapy | SD | ||
| WLS | SNV | Missense_Mutation | c.440C>T | p.Thr147Ile | p.T147I | Q5T9L3 | protein_coding | tolerated(0.07) | possibly_damaging(0.812) | TCGA-BH-A18G-01 | Breast | breast invasive carcinoma | Female | >=65 | I/II | Unknown | Unknown | SD | |
| WLS | SNV | Missense_Mutation | c.376N>C | p.Glu126Gln | p.E126Q | Q5T9L3 | protein_coding | tolerated(0.3) | benign(0.071) | TCGA-D8-A27G-01 | Breast | breast invasive carcinoma | Female | >=65 | I/II | Unknown | Unknown | SD | |
| WLS | SNV | Missense_Mutation | c.416N>A | p.Arg139His | p.R139H | Q5T9L3 | protein_coding | deleterious(0) | probably_damaging(0.978) | TCGA-E2-A15D-01 | Breast | breast invasive carcinoma | Female | <65 | I/II | Hormone Therapy | tamoxiphen | SD | |
| WLS | SNV | Missense_Mutation | c.1064N>A | p.Arg355Lys | p.R355K | Q5T9L3 | protein_coding | deleterious(0.05) | probably_damaging(0.972) | TCGA-EK-A2PL-01 | Cervix | cervical & endocervical cancer | Female | <65 | III/IV | Unknown | Unknown | SD | |
| WLS | SNV | Missense_Mutation | rs368075278 | c.154N>T | p.Arg52Cys | p.R52C | Q5T9L3 | protein_coding | tolerated(0.05) | benign(0.34) | TCGA-A6-2679-01 | Colorectum | colon adenocarcinoma | Female | >=65 | I/II | Unknown | Unknown | SD |
| WLS | SNV | Missense_Mutation | c.449N>T | p.Ala150Val | p.A150V | Q5T9L3 | protein_coding | tolerated(0.1) | benign(0.225) | TCGA-A6-6653-01 | Colorectum | colon adenocarcinoma | Male | >=65 | I/II | Unknown | Unknown | SD | |
| WLS | SNV | Missense_Mutation | c.152C>T | p.Ala51Val | p.A51V | Q5T9L3 | protein_coding | tolerated(0.3) | benign(0) | TCGA-A6-6781-01 | Colorectum | colon adenocarcinoma | Male | <65 | III/IV | Chemotherapy | oxaliplatin | SD |
| Page: 1 2 3 4 5 6 |
Top |
Related drugs of malignant transformation related genes |
| Identification of chemicals and drugs interact with genes involved in malignant transfromation |
| (DGIdb 4.0) |
| Entrez ID | Symbol | Category | Interaction Types | Drug Claim Name | Drug Name | PMIDs |
| Page: 1 |

Copyright 2023-Present -The University of Texas Health Science Center at Houston |