
|
|||||
|
 | |
| |
| |
| |
| |
| |
|
Gene: WIZ |
Gene summary for WIZ |
| Gene information | Species | Human | Gene symbol | WIZ | Gene ID | 58525 |
| Gene name | WIZ zinc finger | |
| Gene Alias | ZNF803 | |
| Cytomap | 19p13.12 | |
| Gene Type | protein-coding | GO ID | GO:0006139 | UniProtAcc | O95785 |
Top |
Malignant transformation analysis |
| Identification of the aberrant gene expression in precancerous and cancerous lesions by comparing the gene expression of stem-like cells in diseased tissues with normal stem cells |
| Entrez ID | Symbol | Replicates | Species | Organ | Tissue | Adj P-value | Log2FC | Malignancy |
| 58525 | WIZ | HCC1_Meng | Human | Liver | HCC | 1.18e-33 | 1.17e-01 | 0.0246 |
| 58525 | WIZ | HCC2_Meng | Human | Liver | HCC | 5.47e-10 | 7.41e-02 | 0.0107 |
| 58525 | WIZ | HCC1 | Human | Liver | HCC | 4.57e-06 | 1.95e+00 | 0.5336 |
| 58525 | WIZ | HCC2 | Human | Liver | HCC | 6.76e-06 | 1.28e+00 | 0.5341 |
| 58525 | WIZ | Pt14.a | Human | Liver | HCC | 4.71e-03 | 2.42e-01 | 0.0169 |
| 58525 | WIZ | S014 | Human | Liver | HCC | 3.77e-02 | 1.39e-01 | 0.2254 |
| 58525 | WIZ | S016 | Human | Liver | HCC | 6.98e-08 | 2.15e-01 | 0.2243 |
| 58525 | WIZ | S027 | Human | Liver | HCC | 3.28e-09 | 5.38e-01 | 0.2446 |
| 58525 | WIZ | S028 | Human | Liver | HCC | 2.08e-19 | 5.06e-01 | 0.2503 |
| 58525 | WIZ | S029 | Human | Liver | HCC | 3.82e-15 | 4.52e-01 | 0.2581 |
| 58525 | WIZ | C04 | Human | Oral cavity | OSCC | 3.71e-07 | 5.96e-01 | 0.2633 |
| 58525 | WIZ | C21 | Human | Oral cavity | OSCC | 2.50e-17 | 5.53e-01 | 0.2678 |
| 58525 | WIZ | C30 | Human | Oral cavity | OSCC | 3.64e-26 | 9.47e-01 | 0.3055 |
| 58525 | WIZ | C43 | Human | Oral cavity | OSCC | 1.61e-09 | 1.92e-01 | 0.1704 |
| 58525 | WIZ | C51 | Human | Oral cavity | OSCC | 4.47e-05 | 4.31e-01 | 0.2674 |
| 58525 | WIZ | C57 | Human | Oral cavity | OSCC | 1.40e-03 | 2.04e-01 | 0.1679 |
| 58525 | WIZ | C06 | Human | Oral cavity | OSCC | 3.27e-02 | 4.98e-01 | 0.2699 |
| 58525 | WIZ | C08 | Human | Oral cavity | OSCC | 6.59e-18 | 2.89e-01 | 0.1919 |
| 58525 | WIZ | LP15 | Human | Oral cavity | LP | 1.82e-02 | 5.19e-01 | 0.2174 |
| 58525 | WIZ | SYSMH1 | Human | Oral cavity | OSCC | 4.67e-10 | 2.15e-01 | 0.1127 |
| Page: 1 2 |
| Tissue | Expression Dynamics | Abbreviation |
| Liver | 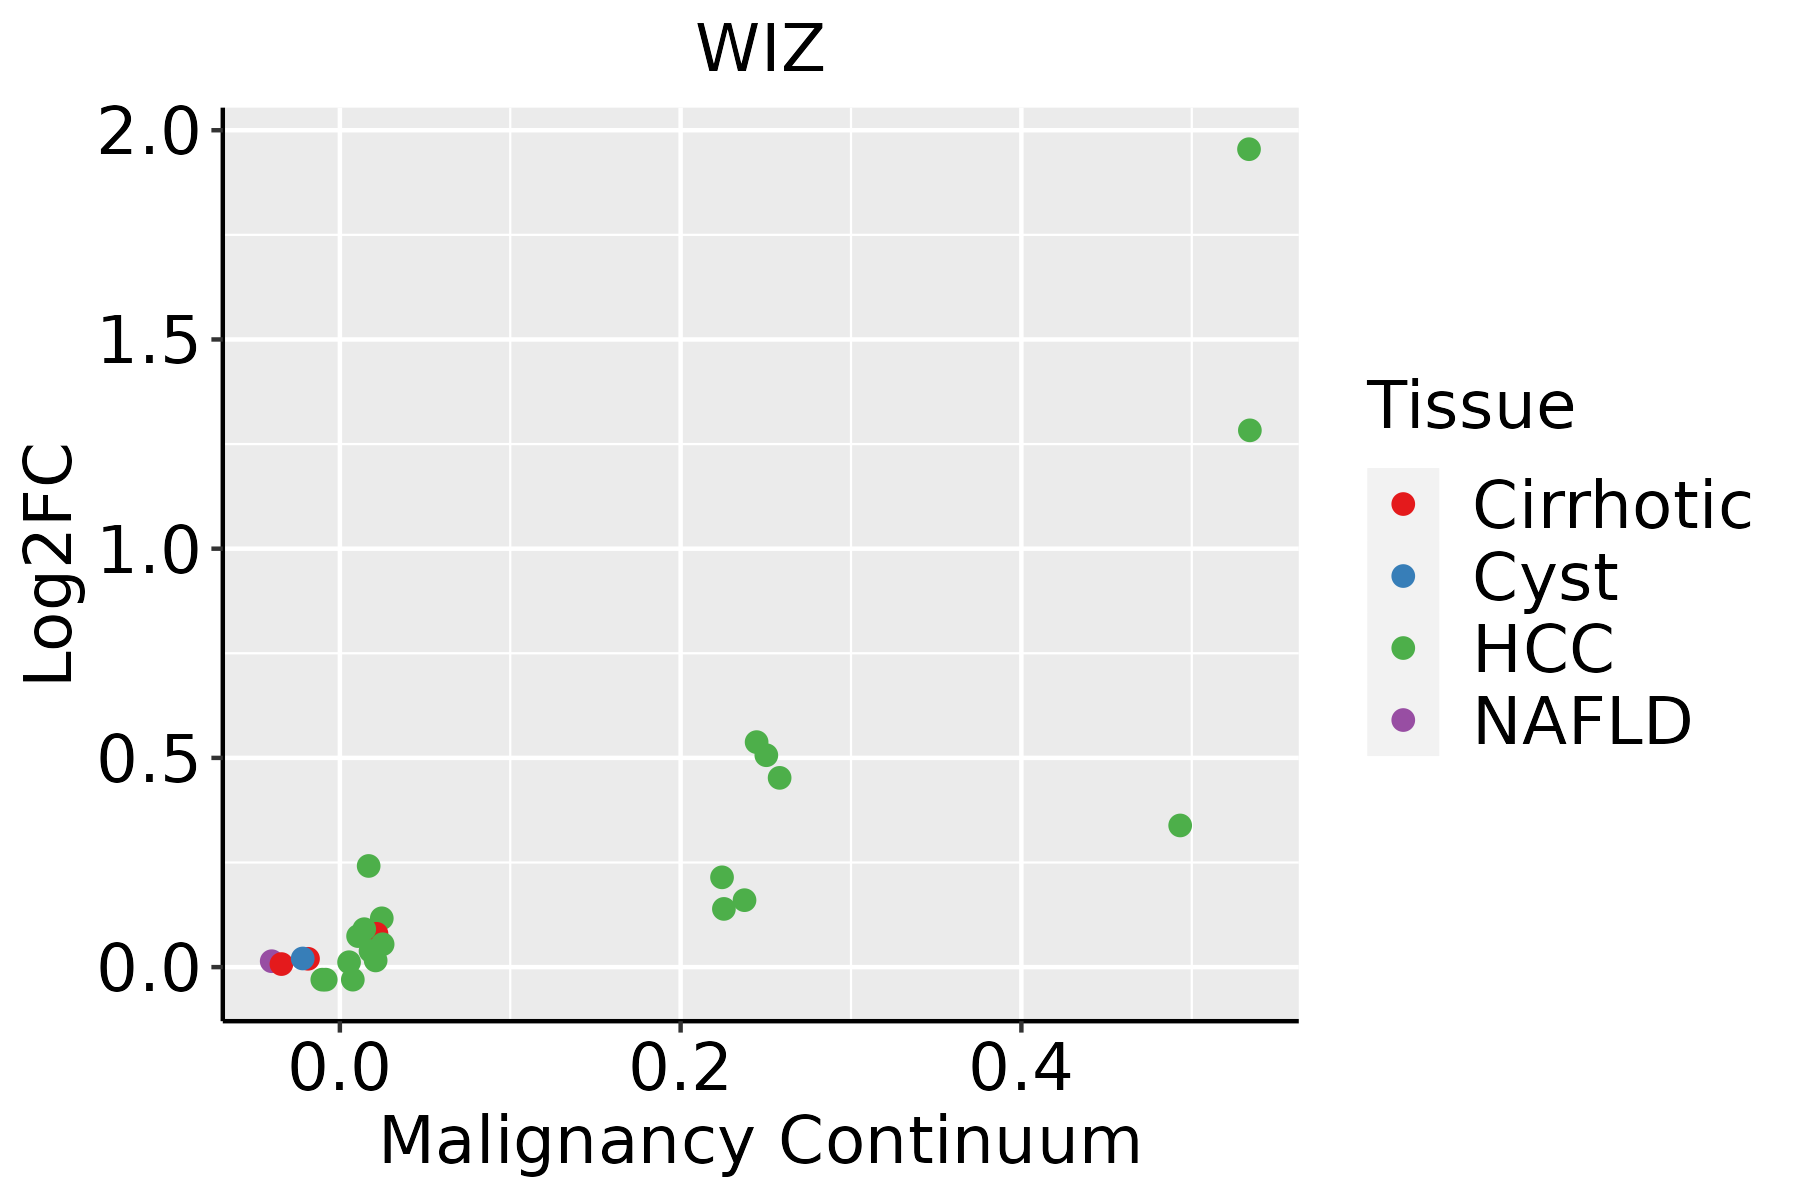 | HCC: Hepatocellular carcinoma |
| NAFLD: Non-alcoholic fatty liver disease | ||
| Oral Cavity | 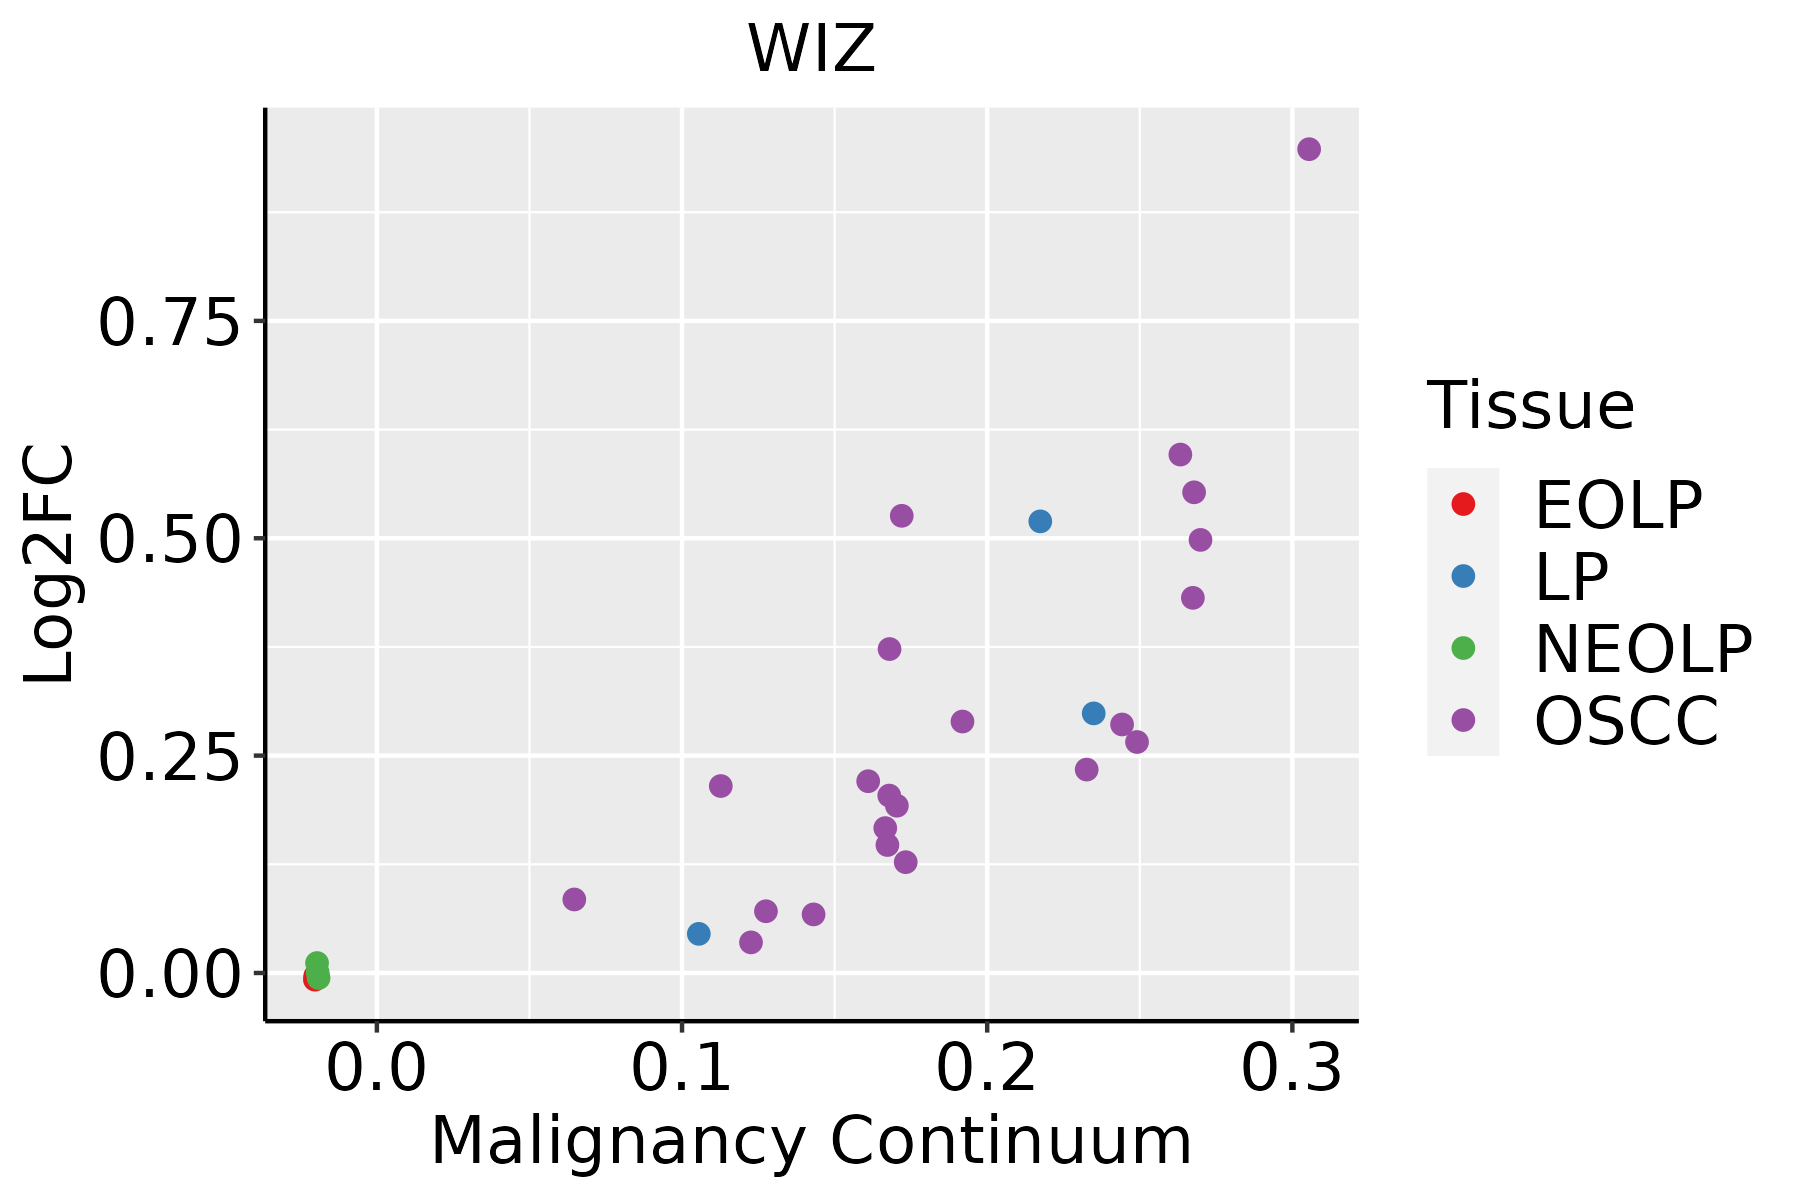 | EOLP: Erosive Oral lichen planus |
| LP: leukoplakia | ||
| NEOLP: Non-erosive oral lichen planus | ||
| OSCC: Oral squamous cell carcinoma | ||
| Thyroid |  | ATC: Anaplastic thyroid cancer |
| HT: Hashimoto's thyroiditis | ||
| PTC: Papillary thyroid cancer |
| ∗log2FC in expression of this searched gene in stem-like cells from each diseased tissue sample relative to stem-like cells in normal samples in each tissue plotted against the malignancy continuum. Samples are colored based on if they are from different disease stage. |
Top |
Malignant transformation related pathway analysis |
| Find out the enriched GO biological processes and KEGG pathways involved in transition from healthy to precancer to cancer |
| Tissue | Disease Stage | Enriched GO biological Processes |
| Colorectum | AD |  |
| Colorectum | SER |  |
| Colorectum | MSS |  |
| Colorectum | MSI-H |  |
| Colorectum | FAP |  |
| ∗Top 15 enriched GO BP terms are showed in the bar plot of each disease state in each tissue. Each row represents a significant GO biological process which is colored according to the -log10(p.adjust). |
| Page: 1 2 3 4 5 6 7 8 9 |
| GO ID | Tissue | Disease Stage | Description | Gene Ratio | Bg Ratio | pvalue | p.adjust | Count |
| GO:003164722 | Liver | HCC | regulation of protein stability | 211/7958 | 298/18723 | 2.29e-23 | 5.01e-21 | 211 |
| GO:005082122 | Liver | HCC | protein stabilization | 139/7958 | 191/18723 | 1.61e-17 | 1.71e-15 | 139 |
| GO:004578711 | Liver | HCC | positive regulation of cell cycle | 172/7958 | 313/18723 | 5.29e-06 | 6.58e-05 | 172 |
| GO:00062601 | Liver | HCC | DNA replication | 146/7958 | 260/18723 | 5.68e-06 | 7.02e-05 | 146 |
| GO:00900683 | Liver | HCC | positive regulation of cell cycle process | 125/7958 | 236/18723 | 7.21e-04 | 4.40e-03 | 125 |
| GO:00062751 | Liver | HCC | regulation of DNA replication | 60/7958 | 107/18723 | 3.15e-03 | 1.46e-02 | 60 |
| GO:0006261 | Liver | HCC | DNA-dependent DNA replication | 80/7958 | 151/18723 | 5.91e-03 | 2.44e-02 | 80 |
| GO:003164720 | Oral cavity | OSCC | regulation of protein stability | 193/7305 | 298/18723 | 1.30e-19 | 1.95e-17 | 193 |
| GO:00062603 | Oral cavity | OSCC | DNA replication | 159/7305 | 260/18723 | 3.25e-13 | 1.59e-11 | 159 |
| GO:005082120 | Oral cavity | OSCC | protein stabilization | 122/7305 | 191/18723 | 2.69e-12 | 1.09e-10 | 122 |
| GO:00457879 | Oral cavity | OSCC | positive regulation of cell cycle | 173/7305 | 313/18723 | 3.28e-09 | 7.44e-08 | 173 |
| GO:00900688 | Oral cavity | OSCC | positive regulation of cell cycle process | 126/7305 | 236/18723 | 4.75e-06 | 5.44e-05 | 126 |
| GO:00062611 | Oral cavity | OSCC | DNA-dependent DNA replication | 84/7305 | 151/18723 | 2.46e-05 | 2.30e-04 | 84 |
| GO:00062753 | Oral cavity | OSCC | regulation of DNA replication | 62/7305 | 107/18723 | 5.49e-05 | 4.54e-04 | 62 |
| GO:00457405 | Oral cavity | OSCC | positive regulation of DNA replication | 23/7305 | 40/18723 | 1.36e-02 | 4.50e-02 | 23 |
| GO:0031647110 | Oral cavity | LP | regulation of protein stability | 132/4623 | 298/18723 | 8.16e-14 | 7.99e-12 | 132 |
| GO:0050821110 | Oral cavity | LP | protein stabilization | 88/4623 | 191/18723 | 9.15e-11 | 5.51e-09 | 88 |
| GO:000626011 | Oral cavity | LP | DNA replication | 97/4623 | 260/18723 | 3.67e-06 | 7.75e-05 | 97 |
| GO:004578715 | Oral cavity | LP | positive regulation of cell cycle | 96/4623 | 313/18723 | 9.08e-03 | 4.85e-02 | 96 |
| GO:0031647113 | Thyroid | PTC | regulation of protein stability | 174/5968 | 298/18723 | 2.05e-21 | 4.05e-19 | 174 |
| Page: 1 2 |
| Pathway ID | Tissue | Disease Stage | Description | Gene Ratio | Bg Ratio | pvalue | p.adjust | qvalue | Count |
| Page: 1 |
Top |
Cell-cell communication analysis |
| Identification of potential cell-cell interactions between two cell types and their ligand-receptor pairs for different disease states |
| Ligand | Receptor | LRpair | Pathway | Tissue | Disease Stage |
| Page: 1 |
Top |
Single-cell gene regulatory network inference analysis |
| Find out the significant the regulons (TFs) and the target genes of each regulon across cell types for different disease states |
| TF | Cell Type | Tissue | Disease Stage | Target Gene | RSS | Regulon Activity |
| ∗The dot plots of a searched regulon are shown for all cell subpopulations in each disease state of each tissue based on the regulon specific score inferred using pySCENIC and by calculating the average expression. |
| Page: 1 |
Top |
Somatic mutation of malignant transformation related genes |
| Annotation of somatic variants for genes involved in malignant transformation |
| Hugo Symbol | Variant Class | Variant Classification | dbSNP RS | HGVSc | HGVSp | HGVSp Short | SWISSPROT | BIOTYPE | SIFT | PolyPhen | Tumor Sample Barcode | Tissue | Histology | Sex | Age | Stage | Therapy Types | Drugs | Outcome |
| WIZ | SNV | Missense_Mutation | novel | c.268N>A | p.Ala90Thr | p.A90T | O95785 | protein_coding | tolerated(0.06) | benign(0.278) | TCGA-AC-A8OS-01 | Breast | breast invasive carcinoma | Female | >=65 | I/II | Unknown | Unknown | SD |
| WIZ | SNV | Missense_Mutation | rs766342614 | c.1330N>A | p.Val444Ile | p.V444I | O95785 | protein_coding | deleterious(0) | probably_damaging(0.995) | TCGA-AR-A24T-01 | Breast | breast invasive carcinoma | Female | <65 | III/IV | Chemotherapy | cytoxan | SD |
| WIZ | SNV | Missense_Mutation | novel | c.2279C>A | p.Ser760Tyr | p.S760Y | O95785 | protein_coding | deleterious(0) | possibly_damaging(0.819) | TCGA-XX-A89A-01 | Breast | breast invasive carcinoma | Female | >=65 | I/II | Unknown | Unknown | SD |
| WIZ | SNV | Missense_Mutation | rs765008015 | c.736N>A | p.Ala246Thr | p.A246T | O95785 | protein_coding | deleterious(0) | probably_damaging(0.919) | TCGA-2W-A8YY-01 | Cervix | cervical & endocervical cancer | Female | <65 | I/II | Chemotherapy | cisplatin | CR |
| WIZ | SNV | Missense_Mutation | novel | c.455N>T | p.Ser152Leu | p.S152L | O95785 | protein_coding | deleterious(0.05) | benign(0.029) | TCGA-2W-A8YY-01 | Cervix | cervical & endocervical cancer | Female | <65 | I/II | Chemotherapy | cisplatin | CR |
| WIZ | SNV | Missense_Mutation | novel | c.197G>A | p.Arg66Gln | p.R66Q | O95785 | protein_coding | deleterious(0) | probably_damaging(0.998) | TCGA-C5-A2LZ-01 | Cervix | cervical & endocervical cancer | Female | >=65 | III/IV | Unknown | Unknown | PD |
| WIZ | SNV | Missense_Mutation | c.1034N>A | p.Arg345Gln | p.R345Q | O95785 | protein_coding | deleterious(0.01) | possibly_damaging(0.791) | TCGA-EK-A2PG-01 | Cervix | cervical & endocervical cancer | Female | >=65 | I/II | Unknown | Unknown | SD | |
| WIZ | SNV | Missense_Mutation | c.539C>T | p.Ser180Phe | p.S180F | O95785 | protein_coding | deleterious(0.01) | benign(0.23) | TCGA-IR-A3LH-01 | Cervix | cervical & endocervical cancer | Female | <65 | I/II | Chemotherapy | cisplatin | CR | |
| WIZ | SNV | Missense_Mutation | c.922N>C | p.Glu308Gln | p.E308Q | O95785 | protein_coding | tolerated(0.1) | possibly_damaging(0.706) | TCGA-AA-3814-01 | Colorectum | colon adenocarcinoma | Female | >=65 | I/II | Unknown | Unknown | SD | |
| WIZ | SNV | Missense_Mutation | c.961G>A | p.Ala321Thr | p.A321T | O95785 | protein_coding | tolerated(0.28) | benign(0) | TCGA-AA-3864-01 | Colorectum | colon adenocarcinoma | Male | >=65 | I/II | Unknown | Unknown | SD |
| Page: 1 2 3 4 5 6 7 8 |
Top |
Related drugs of malignant transformation related genes |
| Identification of chemicals and drugs interact with genes involved in malignant transfromation |
| (DGIdb 4.0) |
| Entrez ID | Symbol | Category | Interaction Types | Drug Claim Name | Drug Name | PMIDs |
| Page: 1 |

Copyright 2023-Present -The University of Texas Health Science Center at Houston |