
|
|||||
|
 | |
| |
| |
| |
| |
| |
|
Gene: WISP3 |
Gene summary for WISP3 |
| Gene information | Species | Human | Gene symbol | WISP3 | Gene ID | 8838 |
| Gene name | cellular communication network factor 6 | |
| Gene Alias | LIBC | |
| Cytomap | 6q21 | |
| Gene Type | protein-coding | GO ID | GO:0001525 | UniProtAcc | I6L968 |
Top |
Malignant transformation analysis |
| Identification of the aberrant gene expression in precancerous and cancerous lesions by comparing the gene expression of stem-like cells in diseased tissues with normal stem cells |
| Entrez ID | Symbol | Replicates | Species | Organ | Tissue | Adj P-value | Log2FC | Malignancy |
| 8838 | WISP3 | P4T-E | Human | Esophagus | ESCC | 1.63e-11 | 2.76e-01 | 0.1323 |
| 8838 | WISP3 | P12T-E | Human | Esophagus | ESCC | 4.31e-06 | 1.61e-01 | 0.1122 |
| 8838 | WISP3 | P16T-E | Human | Esophagus | ESCC | 2.05e-07 | 1.69e-01 | 0.1153 |
| 8838 | WISP3 | P20T-E | Human | Esophagus | ESCC | 3.21e-09 | 1.74e-01 | 0.1124 |
| 8838 | WISP3 | P21T-E | Human | Esophagus | ESCC | 4.12e-11 | 2.51e-01 | 0.1617 |
| 8838 | WISP3 | P23T-E | Human | Esophagus | ESCC | 1.96e-04 | 1.01e-01 | 0.108 |
| 8838 | WISP3 | P27T-E | Human | Esophagus | ESCC | 4.12e-11 | 2.21e-01 | 0.1055 |
| 8838 | WISP3 | P31T-E | Human | Esophagus | ESCC | 1.30e-15 | 2.69e-01 | 0.1251 |
| 8838 | WISP3 | P54T-E | Human | Esophagus | ESCC | 1.06e-02 | 1.06e-01 | 0.0975 |
| 8838 | WISP3 | P62T-E | Human | Esophagus | ESCC | 3.06e-29 | 5.14e-01 | 0.1302 |
| 8838 | WISP3 | P74T-E | Human | Esophagus | ESCC | 1.88e-22 | 6.12e-01 | 0.1479 |
| 8838 | WISP3 | P76T-E | Human | Esophagus | ESCC | 7.90e-03 | 8.43e-02 | 0.1207 |
| 8838 | WISP3 | P80T-E | Human | Esophagus | ESCC | 1.35e-03 | 1.43e-01 | 0.155 |
| 8838 | WISP3 | P89T-E | Human | Esophagus | ESCC | 3.00e-03 | 3.83e-01 | 0.1752 |
| 8838 | WISP3 | P126T-E | Human | Esophagus | ESCC | 1.08e-02 | 3.27e-01 | 0.1125 |
| 8838 | WISP3 | P127T-E | Human | Esophagus | ESCC | 4.64e-06 | 8.39e-02 | 0.0826 |
| 8838 | WISP3 | P128T-E | Human | Esophagus | ESCC | 1.62e-07 | 3.43e-01 | 0.1241 |
| 8838 | WISP3 | P130T-E | Human | Esophagus | ESCC | 8.73e-28 | 4.73e-01 | 0.1676 |
| Page: 1 |
| Tissue | Expression Dynamics | Abbreviation |
| Esophagus | 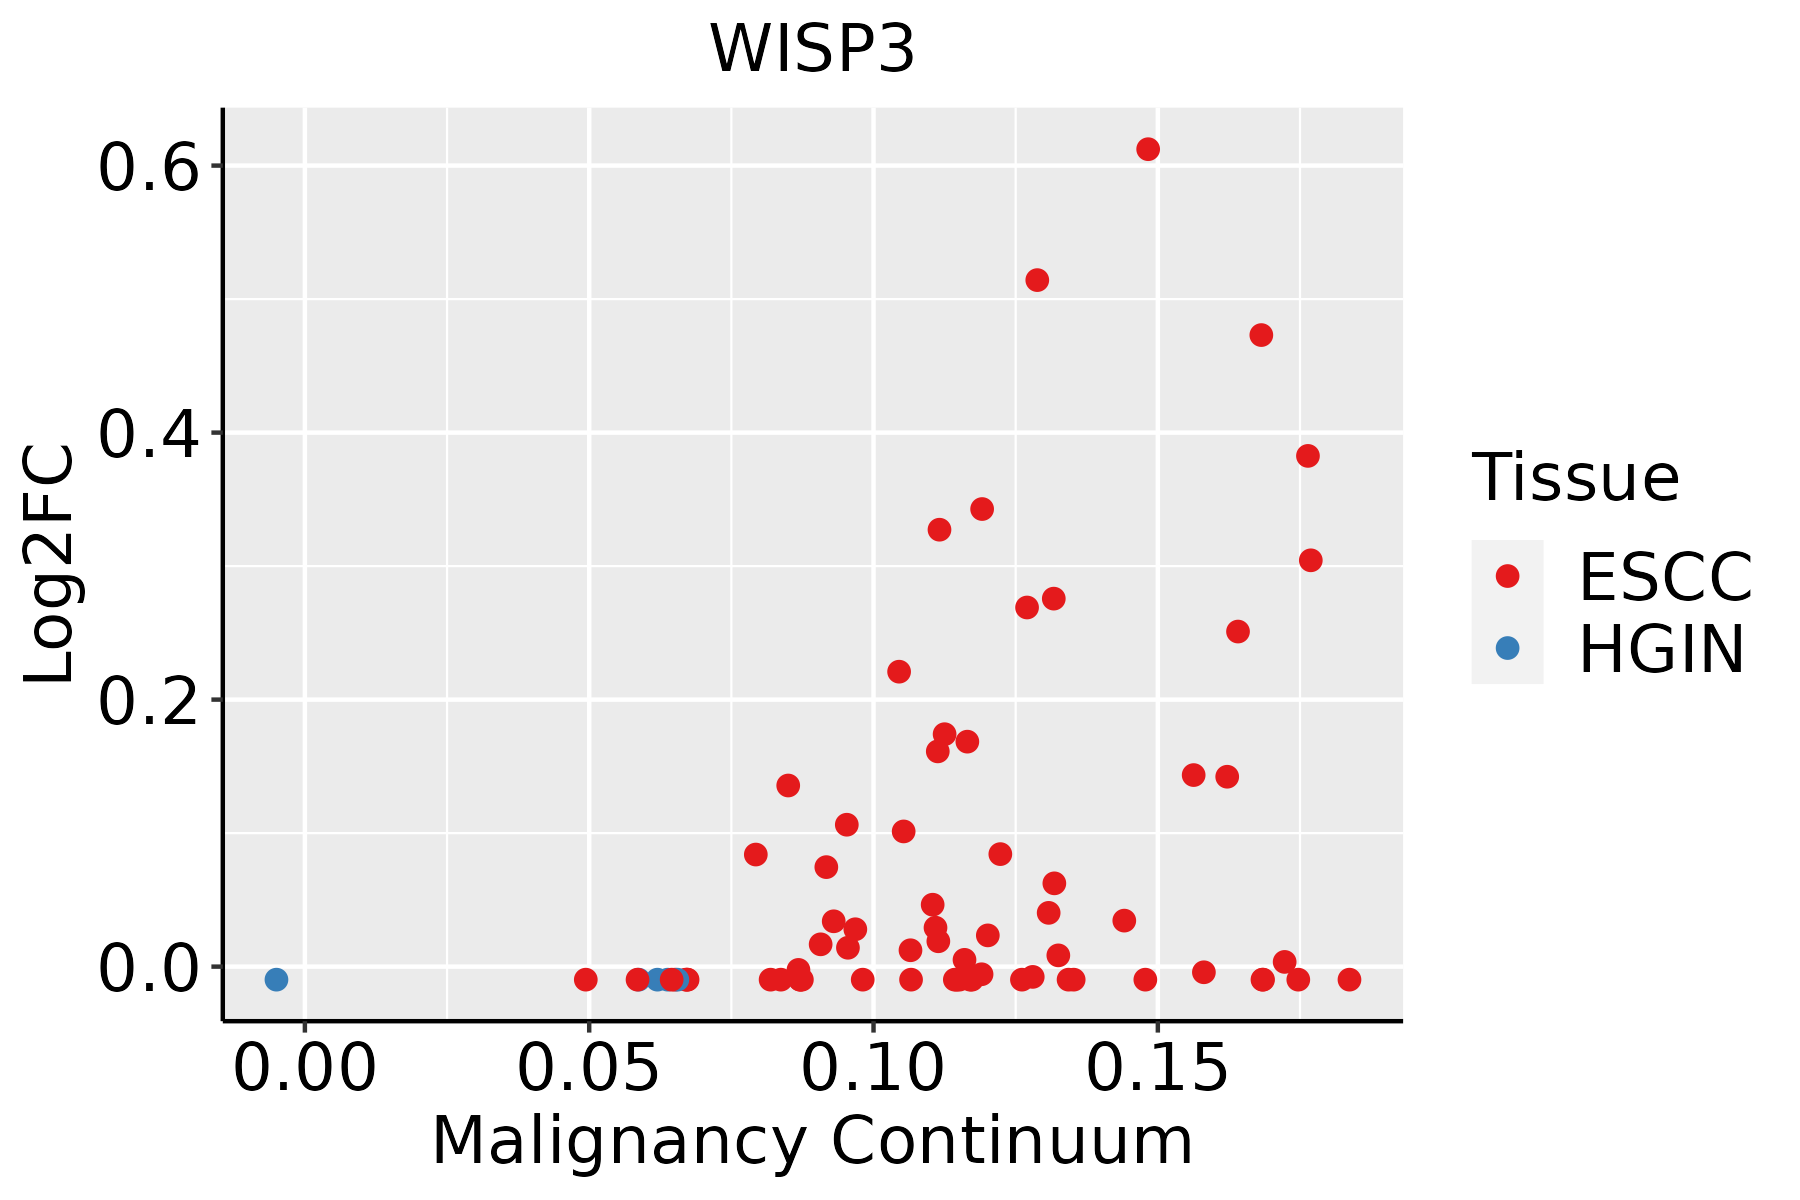 | ESCC: Esophageal squamous cell carcinoma |
| HGIN: High-grade intraepithelial neoplasias | ||
| LGIN: Low-grade intraepithelial neoplasias |
| ∗log2FC in expression of this searched gene in stem-like cells from each diseased tissue sample relative to stem-like cells in normal samples in each tissue plotted against the malignancy continuum. Samples are colored based on if they are from different disease stage. |
Top |
Malignant transformation related pathway analysis |
| Find out the enriched GO biological processes and KEGG pathways involved in transition from healthy to precancer to cancer |
| Tissue | Disease Stage | Enriched GO biological Processes |
| Colorectum | AD |  |
| Colorectum | SER |  |
| Colorectum | MSS |  |
| Colorectum | MSI-H |  |
| Colorectum | FAP |  |
| ∗Top 15 enriched GO BP terms are showed in the bar plot of each disease state in each tissue. Each row represents a significant GO biological process which is colored according to the -log10(p.adjust). |
| Page: 1 2 3 4 5 6 7 8 9 |
| GO ID | Tissue | Disease Stage | Description | Gene Ratio | Bg Ratio | pvalue | p.adjust | Count |
| Page: 1 |
| Pathway ID | Tissue | Disease Stage | Description | Gene Ratio | Bg Ratio | pvalue | p.adjust | qvalue | Count |
| Page: 1 |
Top |
Cell-cell communication analysis |
| Identification of potential cell-cell interactions between two cell types and their ligand-receptor pairs for different disease states |
| Ligand | Receptor | LRpair | Pathway | Tissue | Disease Stage |
| Page: 1 |
Top |
Single-cell gene regulatory network inference analysis |
| Find out the significant the regulons (TFs) and the target genes of each regulon across cell types for different disease states |
| TF | Cell Type | Tissue | Disease Stage | Target Gene | RSS | Regulon Activity |
| ∗The dot plots of a searched regulon are shown for all cell subpopulations in each disease state of each tissue based on the regulon specific score inferred using pySCENIC and by calculating the average expression. |
| Page: 1 |
Top |
Somatic mutation of malignant transformation related genes |
| Annotation of somatic variants for genes involved in malignant transformation |
| Hugo Symbol | Variant Class | Variant Classification | dbSNP RS | HGVSc | HGVSp | HGVSp Short | SWISSPROT | BIOTYPE | SIFT | PolyPhen | Tumor Sample Barcode | Tissue | Histology | Sex | Age | Stage | Therapy Types | Drugs | Outcome |
| WISP3 | SNV | Missense_Mutation | c.781G>C | p.Glu261Gln | p.E261Q | O95389 | protein_coding | tolerated(0.27) | possibly_damaging(0.825) | TCGA-AC-A23H-01 | Breast | breast invasive carcinoma | Female | >=65 | I/II | Unknown | Unknown | PD | |
| WISP3 | SNV | Missense_Mutation | c.256N>A | p.Val86Met | p.V86M | O95389 | protein_coding | deleterious(0.02) | benign(0.309) | TCGA-B6-A0WX-01 | Breast | breast invasive carcinoma | Female | <65 | III/IV | Unknown | Unknown | PD | |
| WISP3 | insertion | Frame_Shift_Ins | rs782739258 | c.669_670insA | p.Cys227MetfsTer21 | p.C227Mfs*21 | O95389 | protein_coding | TCGA-BH-A18G-01 | Breast | breast invasive carcinoma | Female | >=65 | I/II | Unknown | Unknown | SD | ||
| WISP3 | SNV | Missense_Mutation | novel | c.700T>C | p.Trp234Arg | p.W234R | O95389 | protein_coding | deleterious(0) | probably_damaging(0.992) | TCGA-2W-A8YY-01 | Cervix | cervical & endocervical cancer | Female | <65 | I/II | Chemotherapy | cisplatin | CR |
| WISP3 | SNV | Missense_Mutation | novel | c.800T>C | p.Ile267Thr | p.I267T | O95389 | protein_coding | deleterious(0) | possibly_damaging(0.744) | TCGA-AA-3975-01 | Colorectum | colon adenocarcinoma | Male | >=65 | I/II | Unknown | Unknown | SD |
| WISP3 | SNV | Missense_Mutation | c.570G>T | p.Lys190Asn | p.K190N | O95389 | protein_coding | tolerated(0.05) | benign(0.009) | TCGA-AA-3977-01 | Colorectum | colon adenocarcinoma | Male | >=65 | I/II | Unknown | Unknown | SD | |
| WISP3 | SNV | Missense_Mutation | rs140750750 | c.811N>A | p.Asp271Asn | p.D271N | O95389 | protein_coding | tolerated(0.27) | benign(0.006) | TCGA-AZ-4315-01 | Colorectum | colon adenocarcinoma | Male | <65 | I/II | Unknown | Unknown | SD |
| WISP3 | SNV | Missense_Mutation | c.698N>C | p.Lys233Thr | p.K233T | O95389 | protein_coding | tolerated(0.07) | benign(0.007) | TCGA-CA-6717-01 | Colorectum | colon adenocarcinoma | Male | <65 | I/II | Chemotherapy | oxaliplatin | CR | |
| WISP3 | SNV | Missense_Mutation | rs782594917 | c.980N>C | p.Lys327Thr | p.K327T | O95389 | protein_coding | deleterious(0.01) | probably_damaging(0.997) | TCGA-CA-6717-01 | Colorectum | colon adenocarcinoma | Male | <65 | I/II | Chemotherapy | oxaliplatin | CR |
| WISP3 | SNV | Missense_Mutation | c.464N>A | p.Pro155His | p.P155H | O95389 | protein_coding | deleterious(0) | probably_damaging(0.992) | TCGA-CK-4951-01 | Colorectum | colon adenocarcinoma | Female | >=65 | I/II | Unknown | Unknown | PD |
| Page: 1 2 3 4 5 |
Top |
Related drugs of malignant transformation related genes |
| Identification of chemicals and drugs interact with genes involved in malignant transfromation |
| (DGIdb 4.0) |
| Entrez ID | Symbol | Category | Interaction Types | Drug Claim Name | Drug Name | PMIDs |
| Page: 1 |

Copyright 2023-Present -The University of Texas Health Science Center at Houston |