
|
|||||
|
 | |
| |
| |
| |
| |
| |
|
Gene: WISP1 |
Gene summary for WISP1 |
| Gene information | Species | Human | Gene symbol | WISP1 | Gene ID | 8840 |
| Gene name | cellular communication network factor 4 | |
| Gene Alias | WISP1 | |
| Cytomap | 8q24.22 | |
| Gene Type | protein-coding | GO ID | GO:0001501 | UniProtAcc | O95388 |
Top |
Malignant transformation analysis |
| Identification of the aberrant gene expression in precancerous and cancerous lesions by comparing the gene expression of stem-like cells in diseased tissues with normal stem cells |
| Entrez ID | Symbol | Replicates | Species | Organ | Tissue | Adj P-value | Log2FC | Malignancy |
| 8840 | WISP1 | C38 | Human | Oral cavity | OSCC | 3.77e-20 | 1.23e+00 | 0.172 |
| 8840 | WISP1 | C46 | Human | Oral cavity | OSCC | 1.19e-04 | 1.49e-01 | 0.1673 |
| 8840 | WISP1 | LN38 | Human | Oral cavity | OSCC | 4.47e-05 | 6.74e-01 | 0.168 |
| 8840 | WISP1 | LN46 | Human | Oral cavity | OSCC | 9.20e-04 | 2.05e-01 | 0.1666 |
| 8840 | WISP1 | ATC12 | Human | Thyroid | ATC | 4.82e-02 | 1.00e-01 | 0.34 |
| 8840 | WISP1 | ATC13 | Human | Thyroid | ATC | 4.82e-02 | 7.86e-02 | 0.34 |
| 8840 | WISP1 | ATC2 | Human | Thyroid | ATC | 1.60e-07 | 5.69e-01 | 0.34 |
| 8840 | WISP1 | ATC4 | Human | Thyroid | ATC | 6.21e-03 | 1.20e-01 | 0.34 |
| Page: 1 |
| Tissue | Expression Dynamics | Abbreviation |
| Oral Cavity | 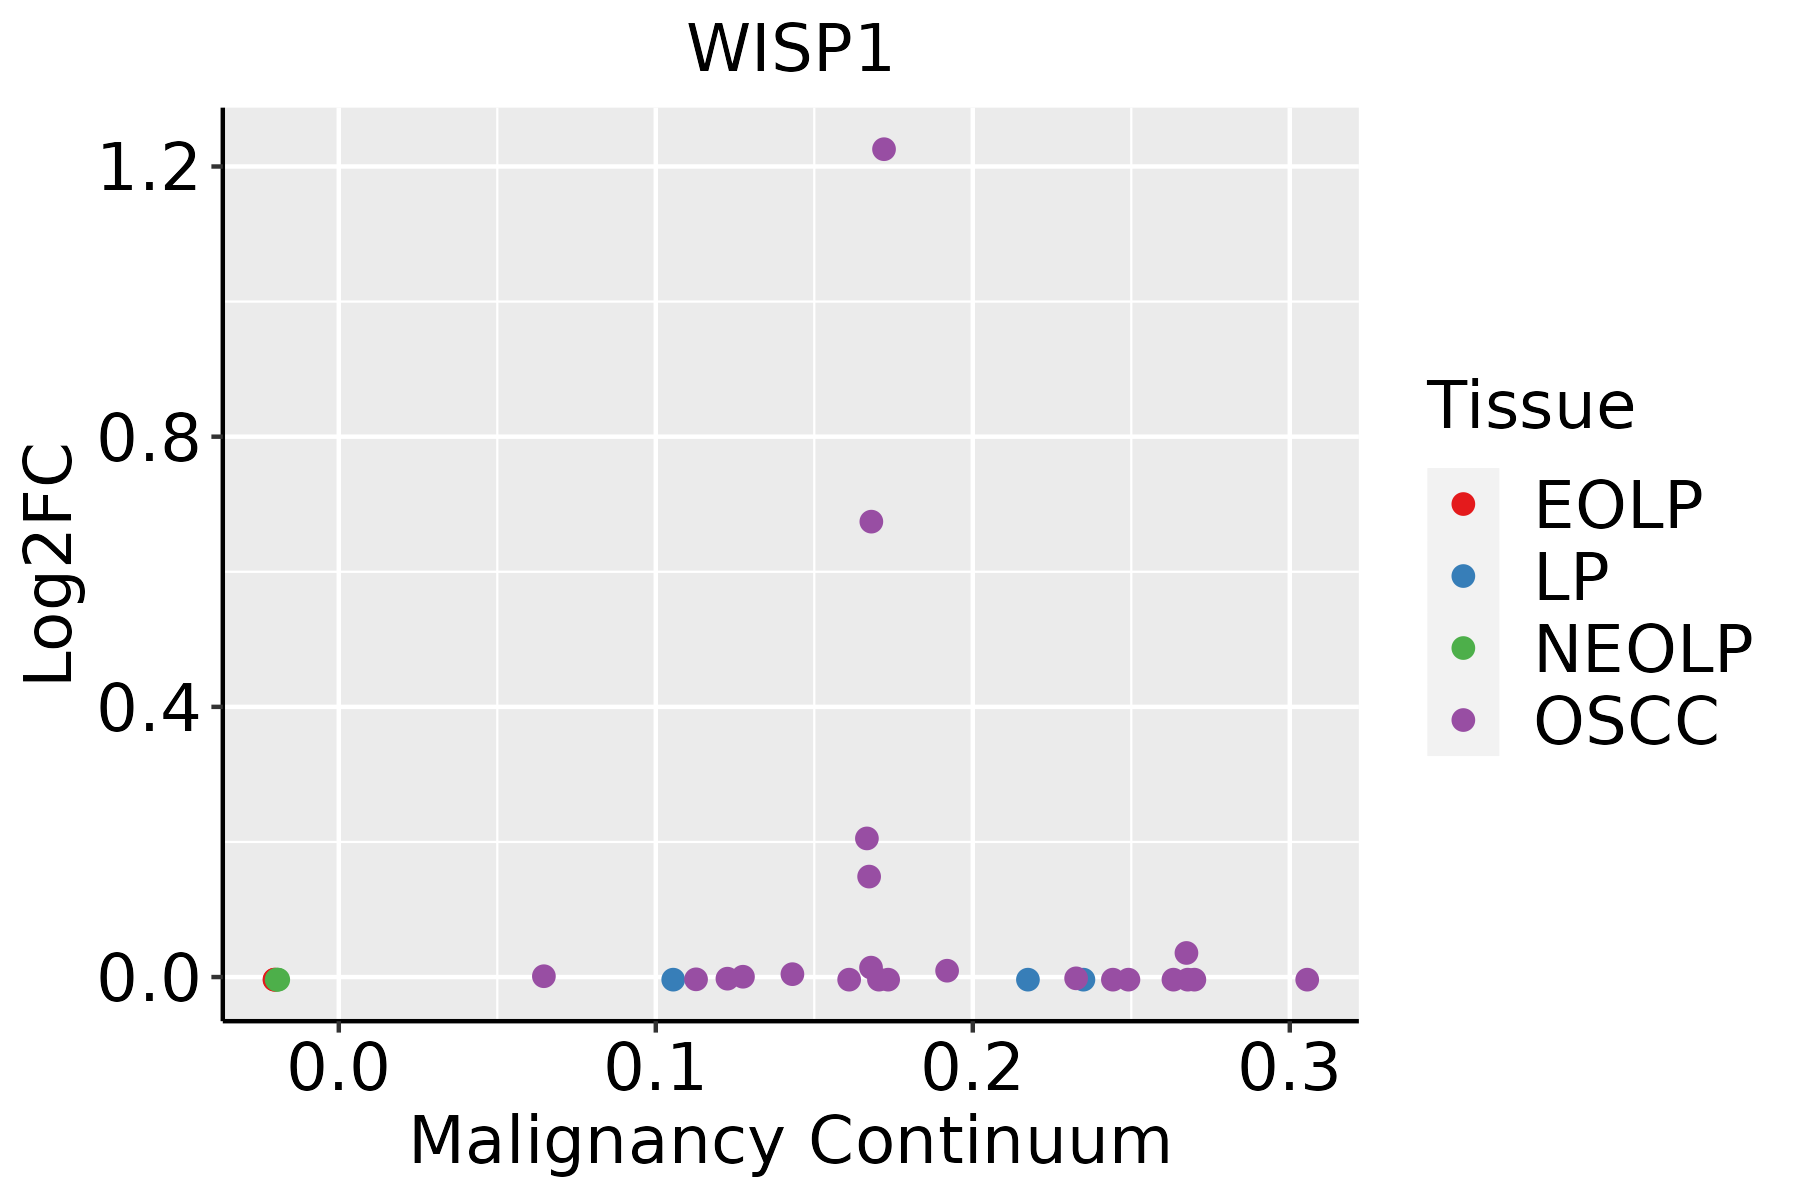 | EOLP: Erosive Oral lichen planus |
| LP: leukoplakia | ||
| NEOLP: Non-erosive oral lichen planus | ||
| OSCC: Oral squamous cell carcinoma | ||
| Thyroid |  | ATC: Anaplastic thyroid cancer |
| HT: Hashimoto's thyroiditis | ||
| PTC: Papillary thyroid cancer |
| ∗log2FC in expression of this searched gene in stem-like cells from each diseased tissue sample relative to stem-like cells in normal samples in each tissue plotted against the malignancy continuum. Samples are colored based on if they are from different disease stage. |
Top |
Malignant transformation related pathway analysis |
| Find out the enriched GO biological processes and KEGG pathways involved in transition from healthy to precancer to cancer |
| Tissue | Disease Stage | Enriched GO biological Processes |
| Colorectum | AD |  |
| Colorectum | SER |  |
| Colorectum | MSS |  |
| Colorectum | MSI-H |  |
| Colorectum | FAP |  |
| ∗Top 15 enriched GO BP terms are showed in the bar plot of each disease state in each tissue. Each row represents a significant GO biological process which is colored according to the -log10(p.adjust). |
| Page: 1 2 3 4 5 6 7 8 9 |
| GO ID | Tissue | Disease Stage | Description | Gene Ratio | Bg Ratio | pvalue | p.adjust | Count |
| Page: 1 |
| Pathway ID | Tissue | Disease Stage | Description | Gene Ratio | Bg Ratio | pvalue | p.adjust | qvalue | Count |
| Page: 1 |
Top |
Cell-cell communication analysis |
| Identification of potential cell-cell interactions between two cell types and their ligand-receptor pairs for different disease states |
| Ligand | Receptor | LRpair | Pathway | Tissue | Disease Stage |
| Page: 1 |
Top |
Single-cell gene regulatory network inference analysis |
| Find out the significant the regulons (TFs) and the target genes of each regulon across cell types for different disease states |
| TF | Cell Type | Tissue | Disease Stage | Target Gene | RSS | Regulon Activity |
| ∗The dot plots of a searched regulon are shown for all cell subpopulations in each disease state of each tissue based on the regulon specific score inferred using pySCENIC and by calculating the average expression. |
| Page: 1 |
Top |
Somatic mutation of malignant transformation related genes |
| Annotation of somatic variants for genes involved in malignant transformation |
| Hugo Symbol | Variant Class | Variant Classification | dbSNP RS | HGVSc | HGVSp | HGVSp Short | SWISSPROT | BIOTYPE | SIFT | PolyPhen | Tumor Sample Barcode | Tissue | Histology | Sex | Age | Stage | Therapy Types | Drugs | Outcome |
| WISP1 | SNV | Missense_Mutation | rs377237188 | c.512N>A | p.Arg171Gln | p.R171Q | O95388 | protein_coding | tolerated(0.37) | benign(0.013) | TCGA-AR-A2LK-01 | Breast | breast invasive carcinoma | Female | <65 | III/IV | Hormone Therapy | anastrozole | PD |
| WISP1 | SNV | Missense_Mutation | c.677N>A | p.Cys226Tyr | p.C226Y | O95388 | protein_coding | deleterious(0) | probably_damaging(0.996) | TCGA-BH-A0HA-01 | Breast | breast invasive carcinoma | Female | <65 | I/II | Unknown | Unknown | SD | |
| WISP1 | insertion | Nonsense_Mutation | novel | c.947_948insTCCCACATAGTGAGAAGGGAAAAACTGGGGGCTCAGGGGAAGAAG | p.Lys316delinsAsnProThrTerTerGluGlyLysAsnTrpGlyLeuArgGlyArgArg | p.K316delinsNPT**EGKNWGLRGRR | O95388 | protein_coding | TCGA-BH-A0AY-01 | Breast | breast invasive carcinoma | Female | <65 | I/II | Chemotherapy | SD | |||
| WISP1 | SNV | Missense_Mutation | c.881N>A | p.Arg294His | p.R294H | O95388 | protein_coding | deleterious(0.04) | benign(0.058) | TCGA-C5-A8YQ-01 | Cervix | cervical & endocervical cancer | Female | >=65 | I/II | Chemotherapy | cisplatin | PD | |
| WISP1 | SNV | Missense_Mutation | c.311G>A | p.Ser104Asn | p.S104N | O95388 | protein_coding | deleterious(0) | possibly_damaging(0.494) | TCGA-C5-A8YT-01 | Cervix | cervical & endocervical cancer | Female | <65 | I/II | Chemotherapy | cisplatin | PD | |
| WISP1 | SNV | Missense_Mutation | novel | c.805N>A | p.Ala269Thr | p.A269T | O95388 | protein_coding | tolerated(0.49) | benign(0.007) | TCGA-5M-AAT5-01 | Colorectum | colon adenocarcinoma | Unknown | Unknown | I/II | Unknown | Unknown | Unknown |
| WISP1 | SNV | Missense_Mutation | novel | c.149N>G | p.Lys50Arg | p.K50R | O95388 | protein_coding | tolerated(0.28) | benign(0.096) | TCGA-5M-AAT6-01 | Colorectum | colon adenocarcinoma | Female | <65 | III/IV | Unknown | Unknown | PD |
| WISP1 | SNV | Missense_Mutation | rs140648348 | c.482G>A | p.Arg161His | p.R161H | O95388 | protein_coding | deleterious(0.02) | possibly_damaging(0.87) | TCGA-CM-5341-01 | Colorectum | colon adenocarcinoma | Female | >=65 | III/IV | Chemotherapy | fluorouracil | SD |
| WISP1 | SNV | Missense_Mutation | c.268G>A | p.Ala90Thr | p.A90T | O95388 | protein_coding | deleterious(0.01) | probably_damaging(0.946) | TCGA-CM-5861-01 | Colorectum | colon adenocarcinoma | Female | <65 | I/II | Unknown | Unknown | PD | |
| WISP1 | SNV | Missense_Mutation | novel | c.805N>A | p.Ala269Thr | p.A269T | O95388 | protein_coding | tolerated(0.49) | benign(0.007) | TCGA-F4-6570-01 | Colorectum | colon adenocarcinoma | Female | >=65 | I/II | Unknown | Unknown | SD |
| Page: 1 2 3 4 5 6 7 8 9 |
Top |
Related drugs of malignant transformation related genes |
| Identification of chemicals and drugs interact with genes involved in malignant transfromation |
| (DGIdb 4.0) |
| Entrez ID | Symbol | Category | Interaction Types | Drug Claim Name | Drug Name | PMIDs |
| Page: 1 |

Copyright 2023-Present -The University of Texas Health Science Center at Houston |