
|
|||||
|
 | |
| |
| |
| |
| |
| |
|
Gene: WIPI1 |
Gene summary for WIPI1 |
| Gene information | Species | Human | Gene symbol | WIPI1 | Gene ID | 55062 |
| Gene name | WD repeat domain, phosphoinositide interacting 1 | |
| Gene Alias | ATG18 | |
| Cytomap | 17q24.2 | |
| Gene Type | protein-coding | GO ID | GO:0000045 | UniProtAcc | B4DX63 |
Top |
Malignant transformation analysis |
| Identification of the aberrant gene expression in precancerous and cancerous lesions by comparing the gene expression of stem-like cells in diseased tissues with normal stem cells |
| Entrez ID | Symbol | Replicates | Species | Organ | Tissue | Adj P-value | Log2FC | Malignancy |
| 55062 | WIPI1 | GSM4909293 | Human | Breast | IDC | 5.16e-10 | 3.04e-01 | 0.1581 |
| 55062 | WIPI1 | GSM4909294 | Human | Breast | IDC | 4.15e-03 | -1.44e-01 | 0.2022 |
| 55062 | WIPI1 | GSM4909296 | Human | Breast | IDC | 1.38e-03 | -1.69e-01 | 0.1524 |
| 55062 | WIPI1 | GSM4909297 | Human | Breast | IDC | 1.09e-03 | -1.13e-01 | 0.1517 |
| 55062 | WIPI1 | GSM4909298 | Human | Breast | IDC | 3.15e-21 | 5.01e-01 | 0.1551 |
| 55062 | WIPI1 | GSM4909311 | Human | Breast | IDC | 4.49e-09 | -1.47e-01 | 0.1534 |
| 55062 | WIPI1 | GSM4909312 | Human | Breast | IDC | 3.29e-02 | 7.18e-02 | 0.1552 |
| 55062 | WIPI1 | GSM4909319 | Human | Breast | IDC | 4.55e-09 | -1.79e-01 | 0.1563 |
| 55062 | WIPI1 | GSM4909321 | Human | Breast | IDC | 1.99e-04 | -8.02e-02 | 0.1559 |
| 55062 | WIPI1 | brca3 | Human | Breast | Precancer | 5.26e-04 | 2.51e-01 | -0.0263 |
| 55062 | WIPI1 | NCCBC2 | Human | Breast | DCIS | 3.79e-10 | 6.20e-01 | 0.1554 |
| 55062 | WIPI1 | NCCBC5 | Human | Breast | DCIS | 3.88e-04 | -1.62e-01 | 0.2046 |
| 55062 | WIPI1 | DCIS2 | Human | Breast | DCIS | 1.15e-30 | 1.04e-01 | 0.0085 |
| 55062 | WIPI1 | LZE4T | Human | Esophagus | ESCC | 1.27e-07 | 3.80e-01 | 0.0811 |
| 55062 | WIPI1 | LZE5T | Human | Esophagus | ESCC | 2.89e-06 | 6.77e-01 | 0.0514 |
| 55062 | WIPI1 | LZE7T | Human | Esophagus | ESCC | 9.35e-07 | 2.58e-01 | 0.0667 |
| 55062 | WIPI1 | LZE22T | Human | Esophagus | ESCC | 3.46e-02 | 1.62e-01 | 0.068 |
| 55062 | WIPI1 | LZE24T | Human | Esophagus | ESCC | 9.27e-45 | 1.94e+00 | 0.0596 |
| 55062 | WIPI1 | LZE21T | Human | Esophagus | ESCC | 9.53e-06 | 3.89e-01 | 0.0655 |
| 55062 | WIPI1 | P2T-E | Human | Esophagus | ESCC | 3.72e-10 | 8.70e-02 | 0.1177 |
| Page: 1 2 3 4 5 6 |
| Tissue | Expression Dynamics | Abbreviation |
| Breast | 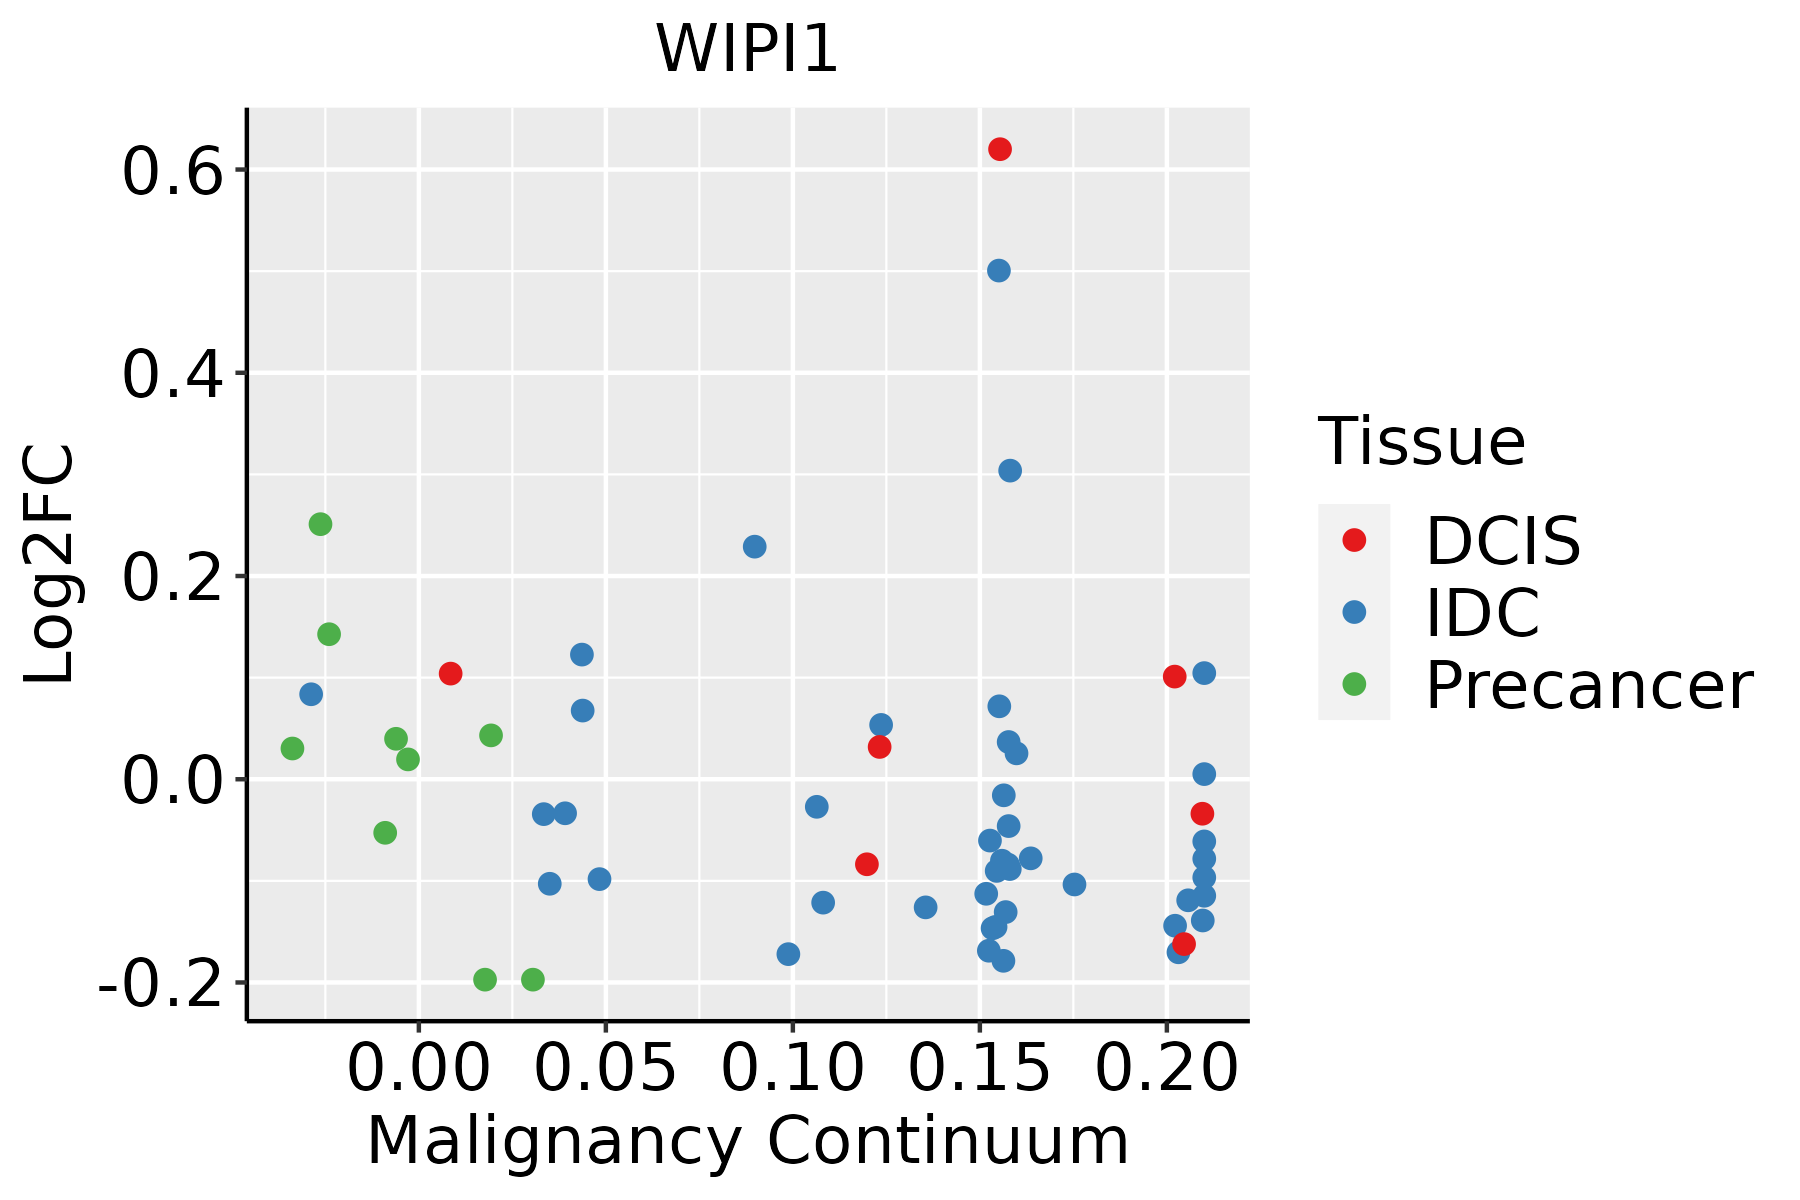 | IDC: Invasive ductal carcinoma |
| DCIS: Ductal carcinoma in situ | ||
| Precancer(BRCA1-mut): Precancerous lesion from BRCA1 mutation carriers | ||
| Esophagus | 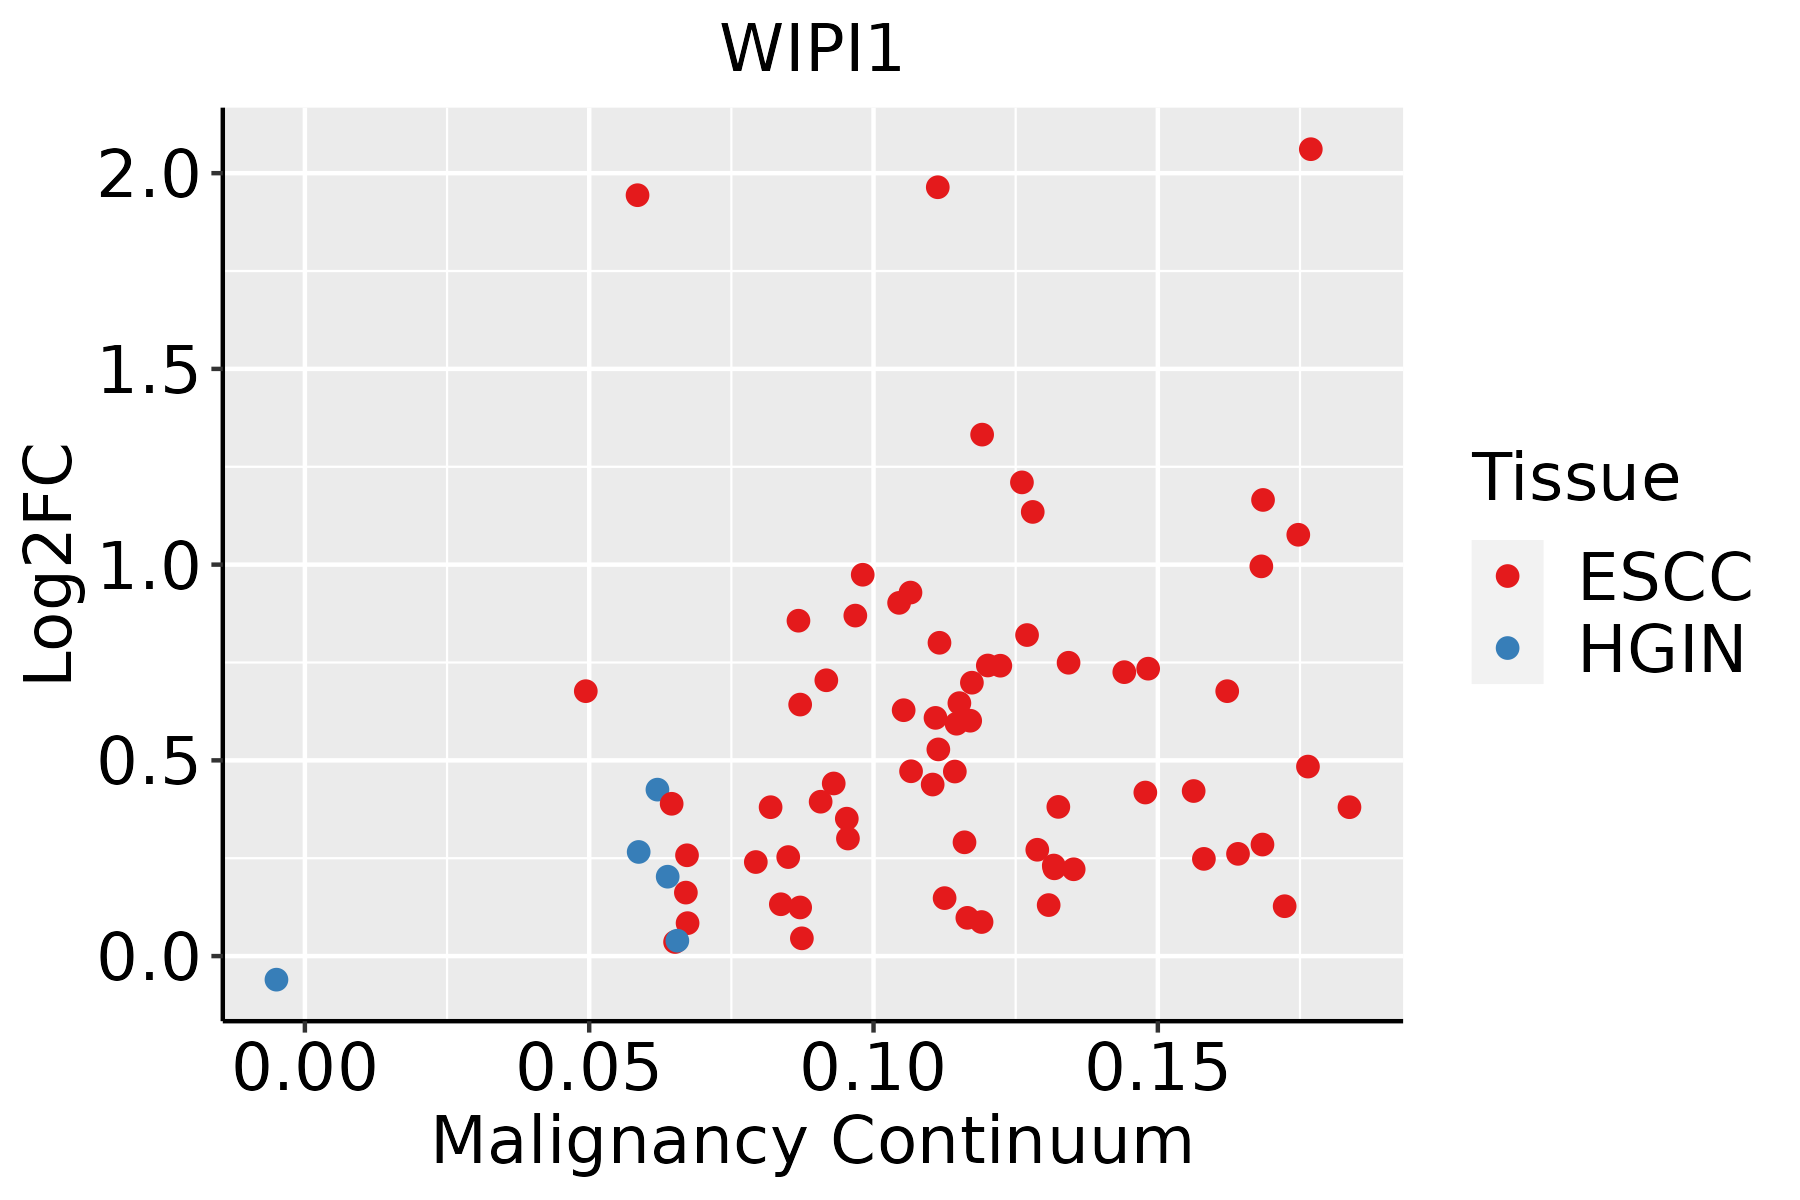 | ESCC: Esophageal squamous cell carcinoma |
| HGIN: High-grade intraepithelial neoplasias | ||
| LGIN: Low-grade intraepithelial neoplasias | ||
| Liver | 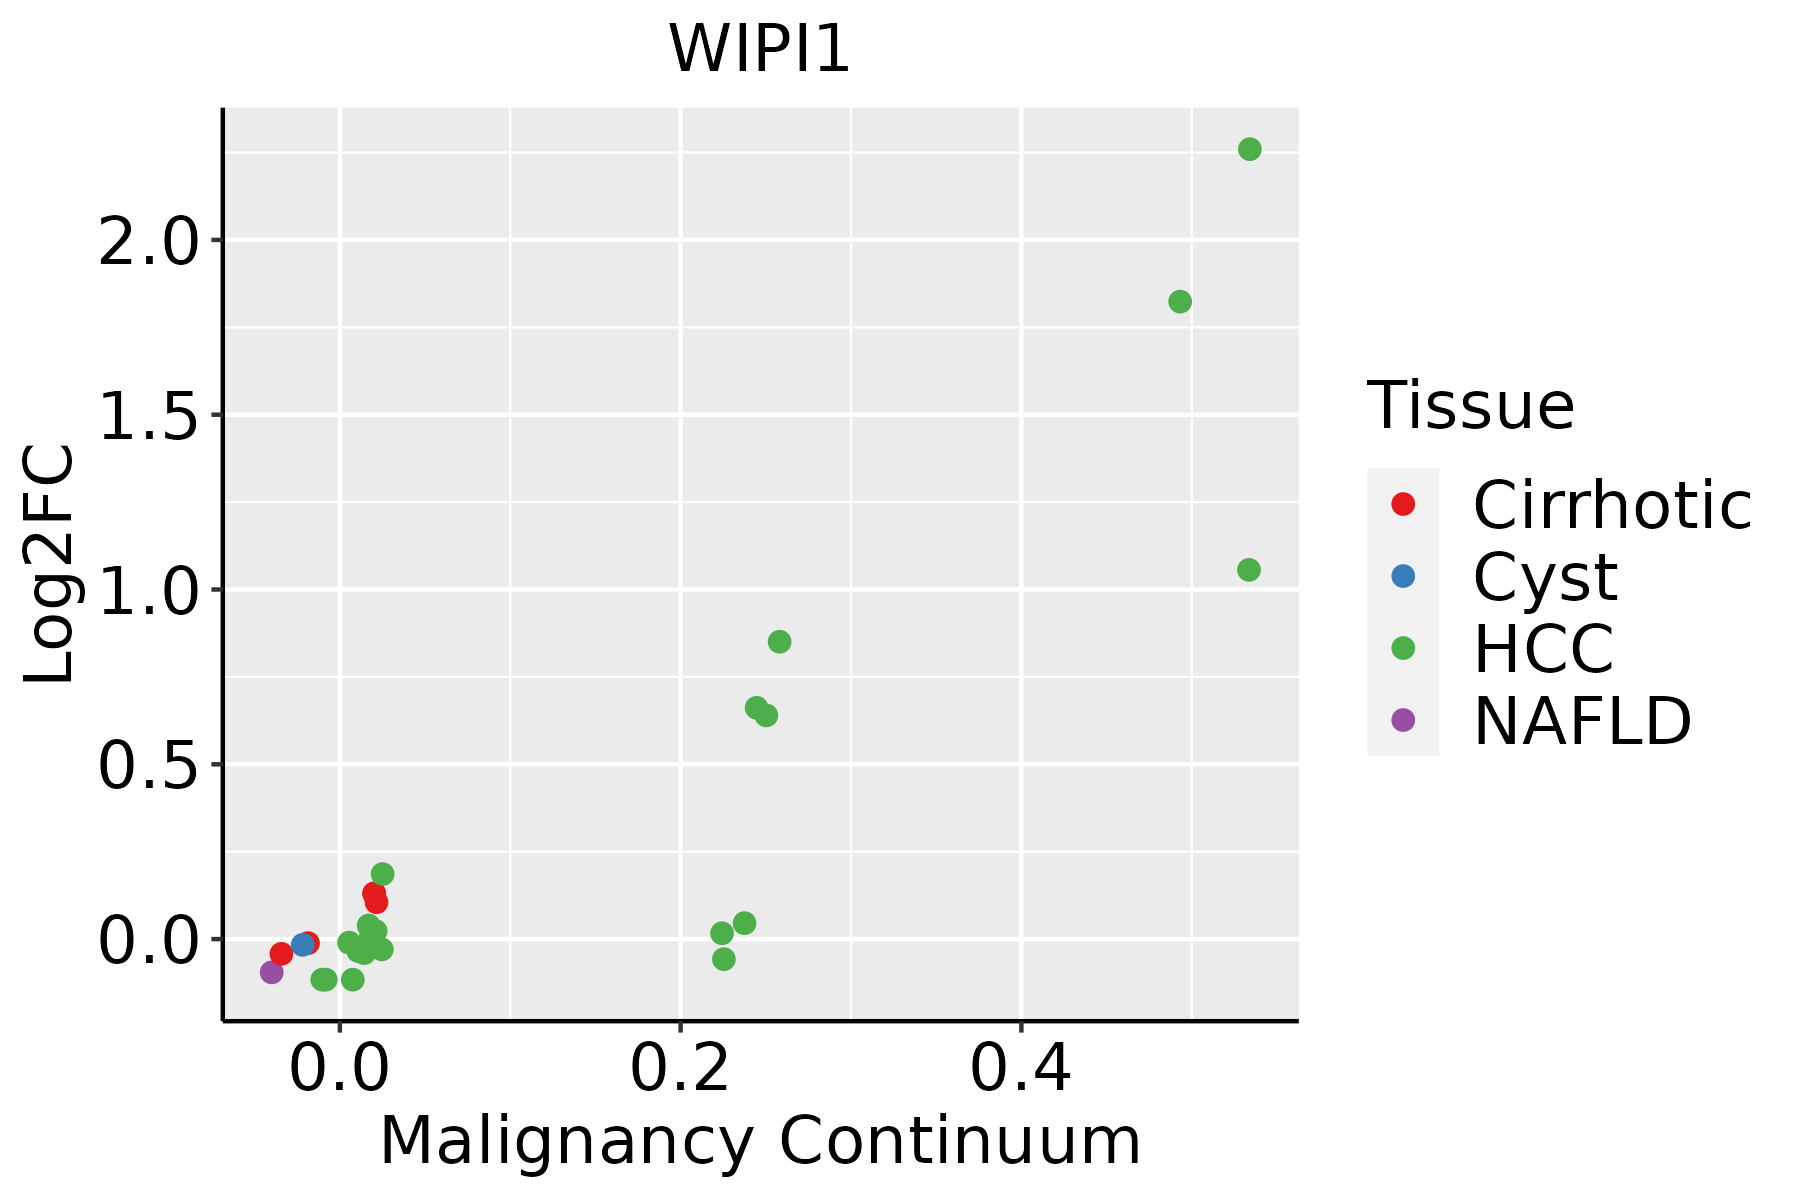 | HCC: Hepatocellular carcinoma |
| NAFLD: Non-alcoholic fatty liver disease | ||
| Oral Cavity |  | EOLP: Erosive Oral lichen planus |
| LP: leukoplakia | ||
| NEOLP: Non-erosive oral lichen planus | ||
| OSCC: Oral squamous cell carcinoma | ||
| Thyroid | 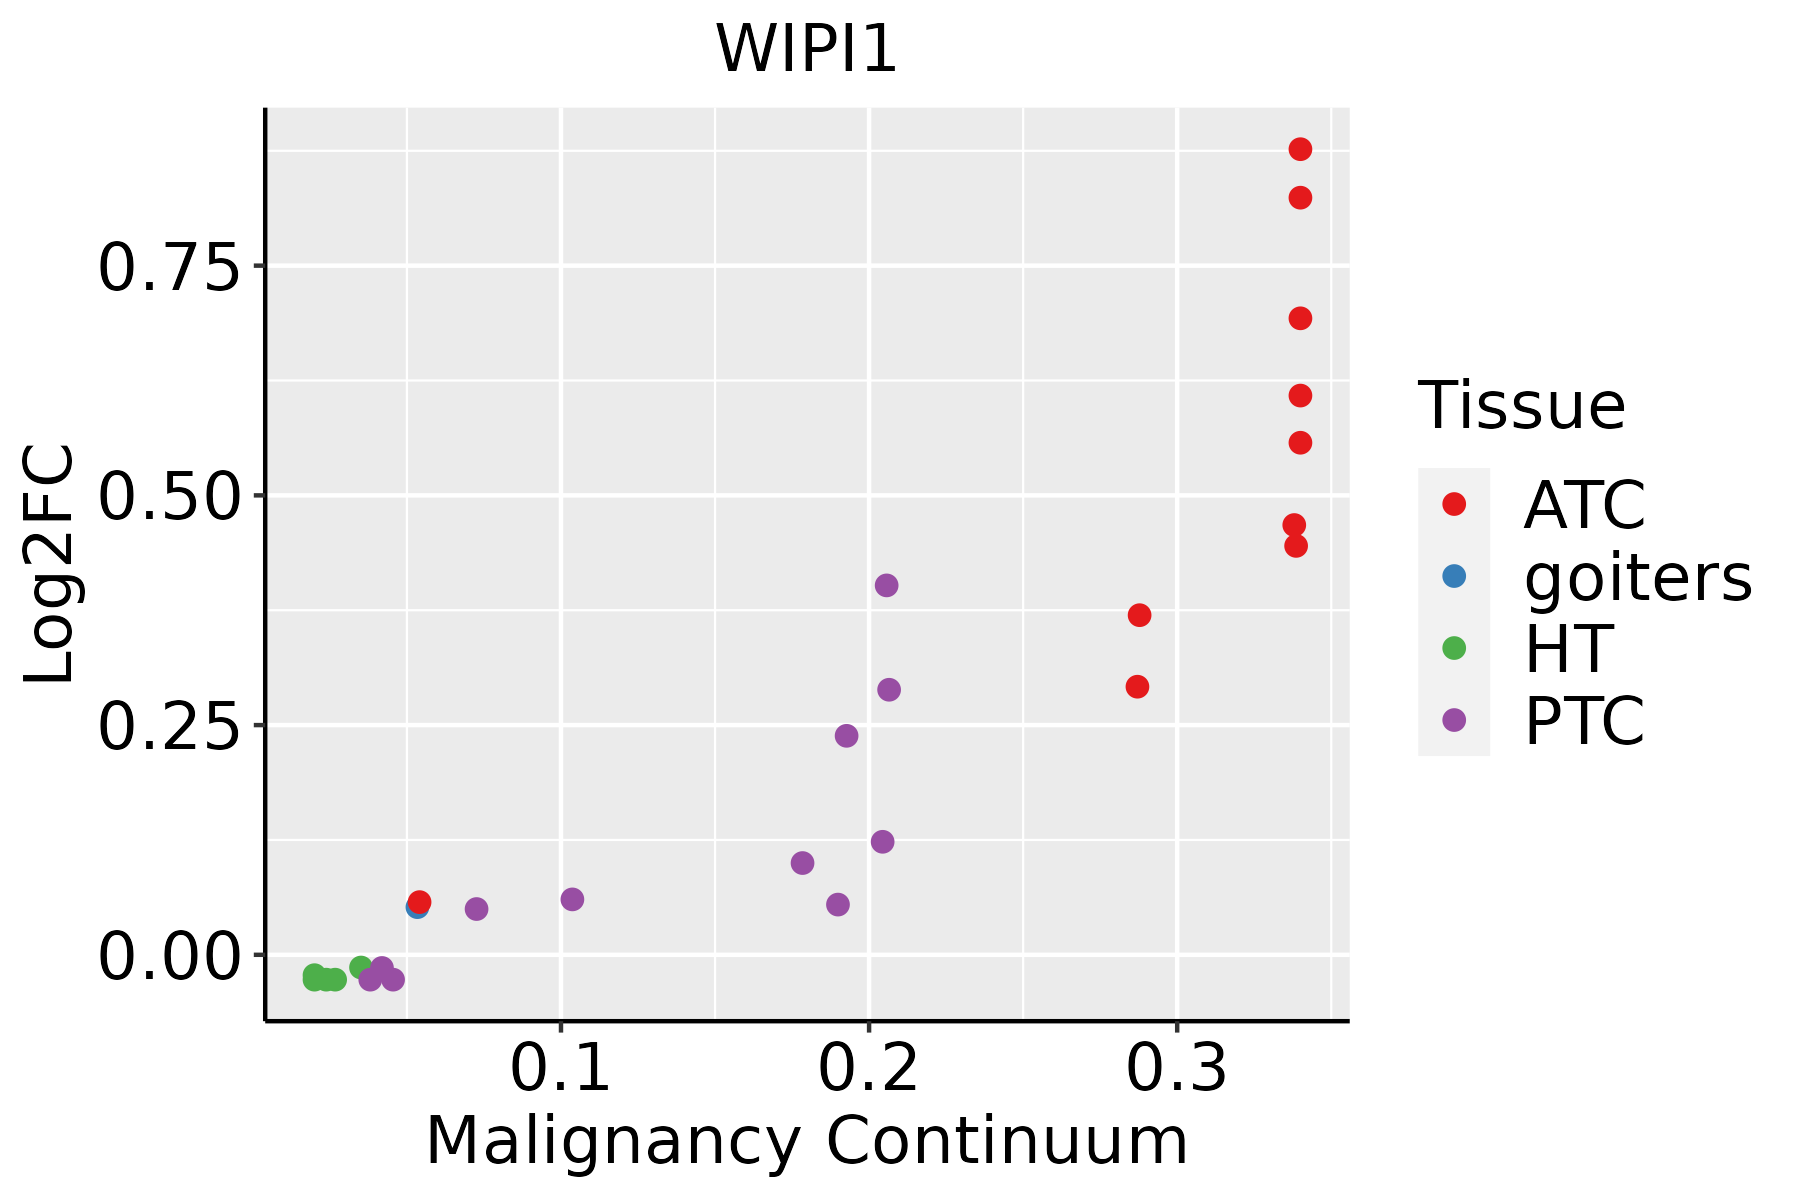 | ATC: Anaplastic thyroid cancer |
| HT: Hashimoto's thyroiditis | ||
| PTC: Papillary thyroid cancer |
| ∗log2FC in expression of this searched gene in stem-like cells from each diseased tissue sample relative to stem-like cells in normal samples in each tissue plotted against the malignancy continuum. Samples are colored based on if they are from different disease stage. |
Top |
Malignant transformation related pathway analysis |
| Find out the enriched GO biological processes and KEGG pathways involved in transition from healthy to precancer to cancer |
| Tissue | Disease Stage | Enriched GO biological Processes |
| Colorectum | AD |  |
| Colorectum | SER |  |
| Colorectum | MSS |  |
| Colorectum | MSI-H |  |
| Colorectum | FAP |  |
| ∗Top 15 enriched GO BP terms are showed in the bar plot of each disease state in each tissue. Each row represents a significant GO biological process which is colored according to the -log10(p.adjust). |
| Page: 1 2 3 4 5 6 7 8 9 |
| GO ID | Tissue | Disease Stage | Description | Gene Ratio | Bg Ratio | pvalue | p.adjust | Count |
| GO:00004226 | Breast | Precancer | autophagy of mitochondrion | 14/1080 | 81/18723 | 2.01e-04 | 3.16e-03 | 14 |
| GO:00617266 | Breast | Precancer | mitochondrion disassembly | 14/1080 | 81/18723 | 2.01e-04 | 3.16e-03 | 14 |
| GO:00316679 | Breast | Precancer | response to nutrient levels | 47/1080 | 474/18723 | 2.09e-04 | 3.27e-03 | 47 |
| GO:00224119 | Breast | Precancer | cellular component disassembly | 44/1080 | 443/18723 | 3.17e-04 | 4.51e-03 | 44 |
| GO:00714969 | Breast | Precancer | cellular response to external stimulus | 33/1080 | 320/18723 | 9.01e-04 | 1.03e-02 | 33 |
| GO:00316688 | Breast | Precancer | cellular response to extracellular stimulus | 27/1080 | 246/18723 | 1.02e-03 | 1.13e-02 | 27 |
| GO:00092677 | Breast | Precancer | cellular response to starvation | 19/1080 | 156/18723 | 1.65e-03 | 1.67e-02 | 19 |
| GO:00425947 | Breast | Precancer | response to starvation | 22/1080 | 197/18723 | 2.30e-03 | 2.15e-02 | 22 |
| GO:19030085 | Breast | Precancer | organelle disassembly | 15/1080 | 114/18723 | 2.31e-03 | 2.15e-02 | 15 |
| GO:00481992 | Breast | Precancer | vesicle targeting, to, from or within Golgi | 5/1080 | 21/18723 | 5.93e-03 | 4.21e-02 | 5 |
| GO:00316697 | Breast | Precancer | cellular response to nutrient levels | 22/1080 | 215/18723 | 6.58e-03 | 4.53e-02 | 22 |
| GO:003166714 | Breast | IDC | response to nutrient levels | 62/1434 | 474/18723 | 2.33e-05 | 5.57e-04 | 62 |
| GO:007149614 | Breast | IDC | cellular response to external stimulus | 45/1434 | 320/18723 | 5.40e-05 | 1.15e-03 | 45 |
| GO:003166814 | Breast | IDC | cellular response to extracellular stimulus | 35/1434 | 246/18723 | 2.79e-04 | 4.26e-03 | 35 |
| GO:000042212 | Breast | IDC | autophagy of mitochondrion | 15/1434 | 81/18723 | 1.13e-03 | 1.23e-02 | 15 |
| GO:006172612 | Breast | IDC | mitochondrion disassembly | 15/1434 | 81/18723 | 1.13e-03 | 1.23e-02 | 15 |
| GO:003166914 | Breast | IDC | cellular response to nutrient levels | 28/1434 | 215/18723 | 4.02e-03 | 3.25e-02 | 28 |
| GO:190300812 | Breast | IDC | organelle disassembly | 17/1434 | 114/18723 | 5.99e-03 | 4.31e-02 | 17 |
| GO:007149623 | Breast | DCIS | cellular response to external stimulus | 45/1390 | 320/18723 | 2.55e-05 | 5.87e-04 | 45 |
| GO:003166723 | Breast | DCIS | response to nutrient levels | 58/1390 | 474/18723 | 1.16e-04 | 2.03e-03 | 58 |
| Page: 1 2 3 4 5 6 7 8 9 10 11 |
| Pathway ID | Tissue | Disease Stage | Description | Gene Ratio | Bg Ratio | pvalue | p.adjust | qvalue | Count |
| hsa0501616 | Breast | Precancer | Huntington disease | 98/684 | 306/8465 | 2.85e-35 | 2.25e-33 | 1.72e-33 | 98 |
| hsa0501016 | Breast | Precancer | Alzheimer disease | 103/684 | 384/8465 | 1.03e-29 | 4.66e-28 | 3.57e-28 | 103 |
| hsa0501416 | Breast | Precancer | Amyotrophic lateral sclerosis | 98/684 | 364/8465 | 2.13e-28 | 8.41e-27 | 6.44e-27 | 98 |
| hsa0502216 | Breast | Precancer | Pathways of neurodegeneration - multiple diseases | 112/684 | 476/8465 | 6.96e-27 | 2.44e-25 | 1.87e-25 | 112 |
| hsa0513118 | Breast | Precancer | Shigellosis | 44/684 | 247/8465 | 3.91e-07 | 6.86e-06 | 5.26e-06 | 44 |
| hsa0501714 | Breast | Precancer | Spinocerebellar ataxia | 29/684 | 143/8465 | 2.79e-06 | 3.83e-05 | 2.94e-05 | 29 |
| hsa0501617 | Breast | Precancer | Huntington disease | 98/684 | 306/8465 | 2.85e-35 | 2.25e-33 | 1.72e-33 | 98 |
| hsa0501017 | Breast | Precancer | Alzheimer disease | 103/684 | 384/8465 | 1.03e-29 | 4.66e-28 | 3.57e-28 | 103 |
| hsa0501417 | Breast | Precancer | Amyotrophic lateral sclerosis | 98/684 | 364/8465 | 2.13e-28 | 8.41e-27 | 6.44e-27 | 98 |
| hsa0502217 | Breast | Precancer | Pathways of neurodegeneration - multiple diseases | 112/684 | 476/8465 | 6.96e-27 | 2.44e-25 | 1.87e-25 | 112 |
| hsa0513119 | Breast | Precancer | Shigellosis | 44/684 | 247/8465 | 3.91e-07 | 6.86e-06 | 5.26e-06 | 44 |
| hsa0501715 | Breast | Precancer | Spinocerebellar ataxia | 29/684 | 143/8465 | 2.79e-06 | 3.83e-05 | 2.94e-05 | 29 |
| hsa0501623 | Breast | IDC | Huntington disease | 103/867 | 306/8465 | 5.14e-30 | 4.17e-28 | 3.12e-28 | 103 |
| hsa0501023 | Breast | IDC | Alzheimer disease | 107/867 | 384/8465 | 1.70e-23 | 7.88e-22 | 5.90e-22 | 107 |
| hsa0501423 | Breast | IDC | Amyotrophic lateral sclerosis | 102/867 | 364/8465 | 1.29e-22 | 5.22e-21 | 3.91e-21 | 102 |
| hsa0502223 | Breast | IDC | Pathways of neurodegeneration - multiple diseases | 116/867 | 476/8465 | 3.63e-20 | 1.18e-18 | 8.82e-19 | 116 |
| hsa0513124 | Breast | IDC | Shigellosis | 47/867 | 247/8465 | 1.78e-05 | 2.00e-04 | 1.49e-04 | 47 |
| hsa0501633 | Breast | IDC | Huntington disease | 103/867 | 306/8465 | 5.14e-30 | 4.17e-28 | 3.12e-28 | 103 |
| hsa0501033 | Breast | IDC | Alzheimer disease | 107/867 | 384/8465 | 1.70e-23 | 7.88e-22 | 5.90e-22 | 107 |
| hsa0501433 | Breast | IDC | Amyotrophic lateral sclerosis | 102/867 | 364/8465 | 1.29e-22 | 5.22e-21 | 3.91e-21 | 102 |
| Page: 1 2 3 4 5 6 |
Top |
Cell-cell communication analysis |
| Identification of potential cell-cell interactions between two cell types and their ligand-receptor pairs for different disease states |
| Ligand | Receptor | LRpair | Pathway | Tissue | Disease Stage |
| Page: 1 |
Top |
Single-cell gene regulatory network inference analysis |
| Find out the significant the regulons (TFs) and the target genes of each regulon across cell types for different disease states |
| TF | Cell Type | Tissue | Disease Stage | Target Gene | RSS | Regulon Activity |
| ∗The dot plots of a searched regulon are shown for all cell subpopulations in each disease state of each tissue based on the regulon specific score inferred using pySCENIC and by calculating the average expression. |
| Page: 1 |
Top |
Somatic mutation of malignant transformation related genes |
| Annotation of somatic variants for genes involved in malignant transformation |
| Hugo Symbol | Variant Class | Variant Classification | dbSNP RS | HGVSc | HGVSp | HGVSp Short | SWISSPROT | BIOTYPE | SIFT | PolyPhen | Tumor Sample Barcode | Tissue | Histology | Sex | Age | Stage | Therapy Types | Drugs | Outcome |
| WIPI1 | SNV | Missense_Mutation | rs771913875 | c.937N>A | p.Gly313Arg | p.G313R | Q5MNZ9 | protein_coding | deleterious(0) | probably_damaging(0.975) | TCGA-AO-A0JD-01 | Breast | breast invasive carcinoma | Female | <65 | III/IV | Chemotherapy | cyclophosphamide | SD |
| WIPI1 | SNV | Missense_Mutation | c.652N>A | p.Asp218Asn | p.D218N | Q5MNZ9 | protein_coding | tolerated(0.26) | benign(0.003) | TCGA-BH-A0BR-01 | Breast | breast invasive carcinoma | Female | <65 | I/II | Unknown | Unknown | SD | |
| WIPI1 | insertion | Frame_Shift_Ins | novel | c.1207_1208insTGAGCTTCAGTCAAAACATCCCAGATAGTCAACCTGAAATCATT | p.Gly403ValfsTer45 | p.G403Vfs*45 | Q5MNZ9 | protein_coding | TCGA-AN-A0FN-01 | Breast | breast invasive carcinoma | Female | <65 | I/II | Unknown | Unknown | SD | ||
| WIPI1 | insertion | Frame_Shift_Ins | novel | c.1193_1194insCACC | p.Tyr399ThrfsTer4 | p.Y399Tfs*4 | Q5MNZ9 | protein_coding | TCGA-B6-A0I9-01 | Breast | breast invasive carcinoma | Female | <65 | III/IV | Unknown | Unknown | PD | ||
| WIPI1 | insertion | Nonsense_Mutation | novel | c.1193-1_1193insCTTGACCCTCACTTACCTGCAGCTCTGGCCGGCAGACCC | p.Gly398delinsAlaTerProSerLeuThrCysSerSerGlyArgGlnThrArg | p.G398delinsA*PSLTCSSGRQTR | Q5MNZ9 | protein_coding | TCGA-B6-A0I9-01 | Breast | breast invasive carcinoma | Female | <65 | III/IV | Unknown | Unknown | PD | ||
| WIPI1 | deletion | Frame_Shift_Del | c.1069delN | p.His357ThrfsTer29 | p.H357Tfs*29 | Q5MNZ9 | protein_coding | TCGA-E9-A1R5-01 | Breast | breast invasive carcinoma | Female | <65 | I/II | Hormone Therapy | tamoxiphen | SD | |||
| WIPI1 | SNV | Missense_Mutation | rs554506311 | c.922N>T | p.Arg308Cys | p.R308C | Q5MNZ9 | protein_coding | deleterious(0.03) | possibly_damaging(0.886) | TCGA-EA-A3HS-01 | Cervix | cervical & endocervical cancer | Female | <65 | I/II | Unknown | Unknown | SD |
| WIPI1 | deletion | Frame_Shift_Del | novel | c.505delN | p.Val169CysfsTer8 | p.V169Cfs*8 | Q5MNZ9 | protein_coding | TCGA-EA-A410-01 | Cervix | cervical & endocervical cancer | Female | <65 | I/II | Unknown | Unknown | SD | ||
| WIPI1 | SNV | Missense_Mutation | rs200972573 | c.1184N>T | p.Thr395Met | p.T395M | Q5MNZ9 | protein_coding | deleterious(0.03) | benign(0.029) | TCGA-A6-6653-01 | Colorectum | colon adenocarcinoma | Male | >=65 | I/II | Unknown | Unknown | SD |
| WIPI1 | SNV | Missense_Mutation | c.224N>A | p.Val75Asp | p.V75D | Q5MNZ9 | protein_coding | deleterious(0) | probably_damaging(0.996) | TCGA-AA-3811-01 | Colorectum | colon adenocarcinoma | Female | >=65 | III/IV | Unknown | Unknown | PD |
| Page: 1 2 3 4 5 |
Top |
Related drugs of malignant transformation related genes |
| Identification of chemicals and drugs interact with genes involved in malignant transfromation |
| (DGIdb 4.0) |
| Entrez ID | Symbol | Category | Interaction Types | Drug Claim Name | Drug Name | PMIDs |
| Page: 1 |

Copyright 2023-Present -The University of Texas Health Science Center at Houston |