
|
|||||
|
 | |
| |
| |
| |
| |
| |
|
Gene: WIPF3 |
Gene summary for WIPF3 |
| Gene information | Species | Human | Gene symbol | WIPF3 | Gene ID | 644150 |
| Gene name | WAS/WASL interacting protein family member 3 | |
| Gene Alias | CR16 | |
| Cytomap | 7p14.3 | |
| Gene Type | protein-coding | GO ID | GO:0000003 | UniProtAcc | A6NGB9 |
Top |
Malignant transformation analysis |
| Identification of the aberrant gene expression in precancerous and cancerous lesions by comparing the gene expression of stem-like cells in diseased tissues with normal stem cells |
| Entrez ID | Symbol | Replicates | Species | Organ | Tissue | Adj P-value | Log2FC | Malignancy |
| 644150 | WIPF3 | LZE7T | Human | Esophagus | ESCC | 3.90e-02 | 1.86e-01 | 0.0667 |
| 644150 | WIPF3 | P2T-E | Human | Esophagus | ESCC | 1.13e-09 | 1.70e-01 | 0.1177 |
| 644150 | WIPF3 | P4T-E | Human | Esophagus | ESCC | 3.78e-04 | 1.13e-01 | 0.1323 |
| 644150 | WIPF3 | P9T-E | Human | Esophagus | ESCC | 2.30e-02 | 9.18e-02 | 0.1131 |
| 644150 | WIPF3 | P10T-E | Human | Esophagus | ESCC | 2.05e-07 | 1.54e-01 | 0.116 |
| 644150 | WIPF3 | P11T-E | Human | Esophagus | ESCC | 9.07e-04 | 1.53e-01 | 0.1426 |
| 644150 | WIPF3 | P16T-E | Human | Esophagus | ESCC | 4.44e-08 | 1.78e-01 | 0.1153 |
| 644150 | WIPF3 | P20T-E | Human | Esophagus | ESCC | 8.62e-07 | 1.56e-01 | 0.1124 |
| 644150 | WIPF3 | P22T-E | Human | Esophagus | ESCC | 4.40e-09 | 1.85e-01 | 0.1236 |
| 644150 | WIPF3 | P26T-E | Human | Esophagus | ESCC | 1.43e-04 | 1.33e-01 | 0.1276 |
| 644150 | WIPF3 | P27T-E | Human | Esophagus | ESCC | 1.66e-02 | 9.40e-02 | 0.1055 |
| 644150 | WIPF3 | P28T-E | Human | Esophagus | ESCC | 2.28e-35 | 7.99e-01 | 0.1149 |
| 644150 | WIPF3 | P30T-E | Human | Esophagus | ESCC | 9.60e-15 | 5.50e-01 | 0.137 |
| 644150 | WIPF3 | P37T-E | Human | Esophagus | ESCC | 1.09e-08 | 1.99e-01 | 0.1371 |
| 644150 | WIPF3 | P48T-E | Human | Esophagus | ESCC | 3.97e-04 | 1.39e-01 | 0.0959 |
| 644150 | WIPF3 | P49T-E | Human | Esophagus | ESCC | 4.64e-06 | 4.54e-01 | 0.1768 |
| 644150 | WIPF3 | P52T-E | Human | Esophagus | ESCC | 9.67e-18 | 3.30e-01 | 0.1555 |
| 644150 | WIPF3 | P56T-E | Human | Esophagus | ESCC | 6.66e-05 | 3.65e-01 | 0.1613 |
| 644150 | WIPF3 | P61T-E | Human | Esophagus | ESCC | 1.48e-02 | 9.45e-02 | 0.099 |
| 644150 | WIPF3 | P74T-E | Human | Esophagus | ESCC | 1.86e-07 | 2.10e-01 | 0.1479 |
| Page: 1 2 |
| Tissue | Expression Dynamics | Abbreviation |
| Esophagus | 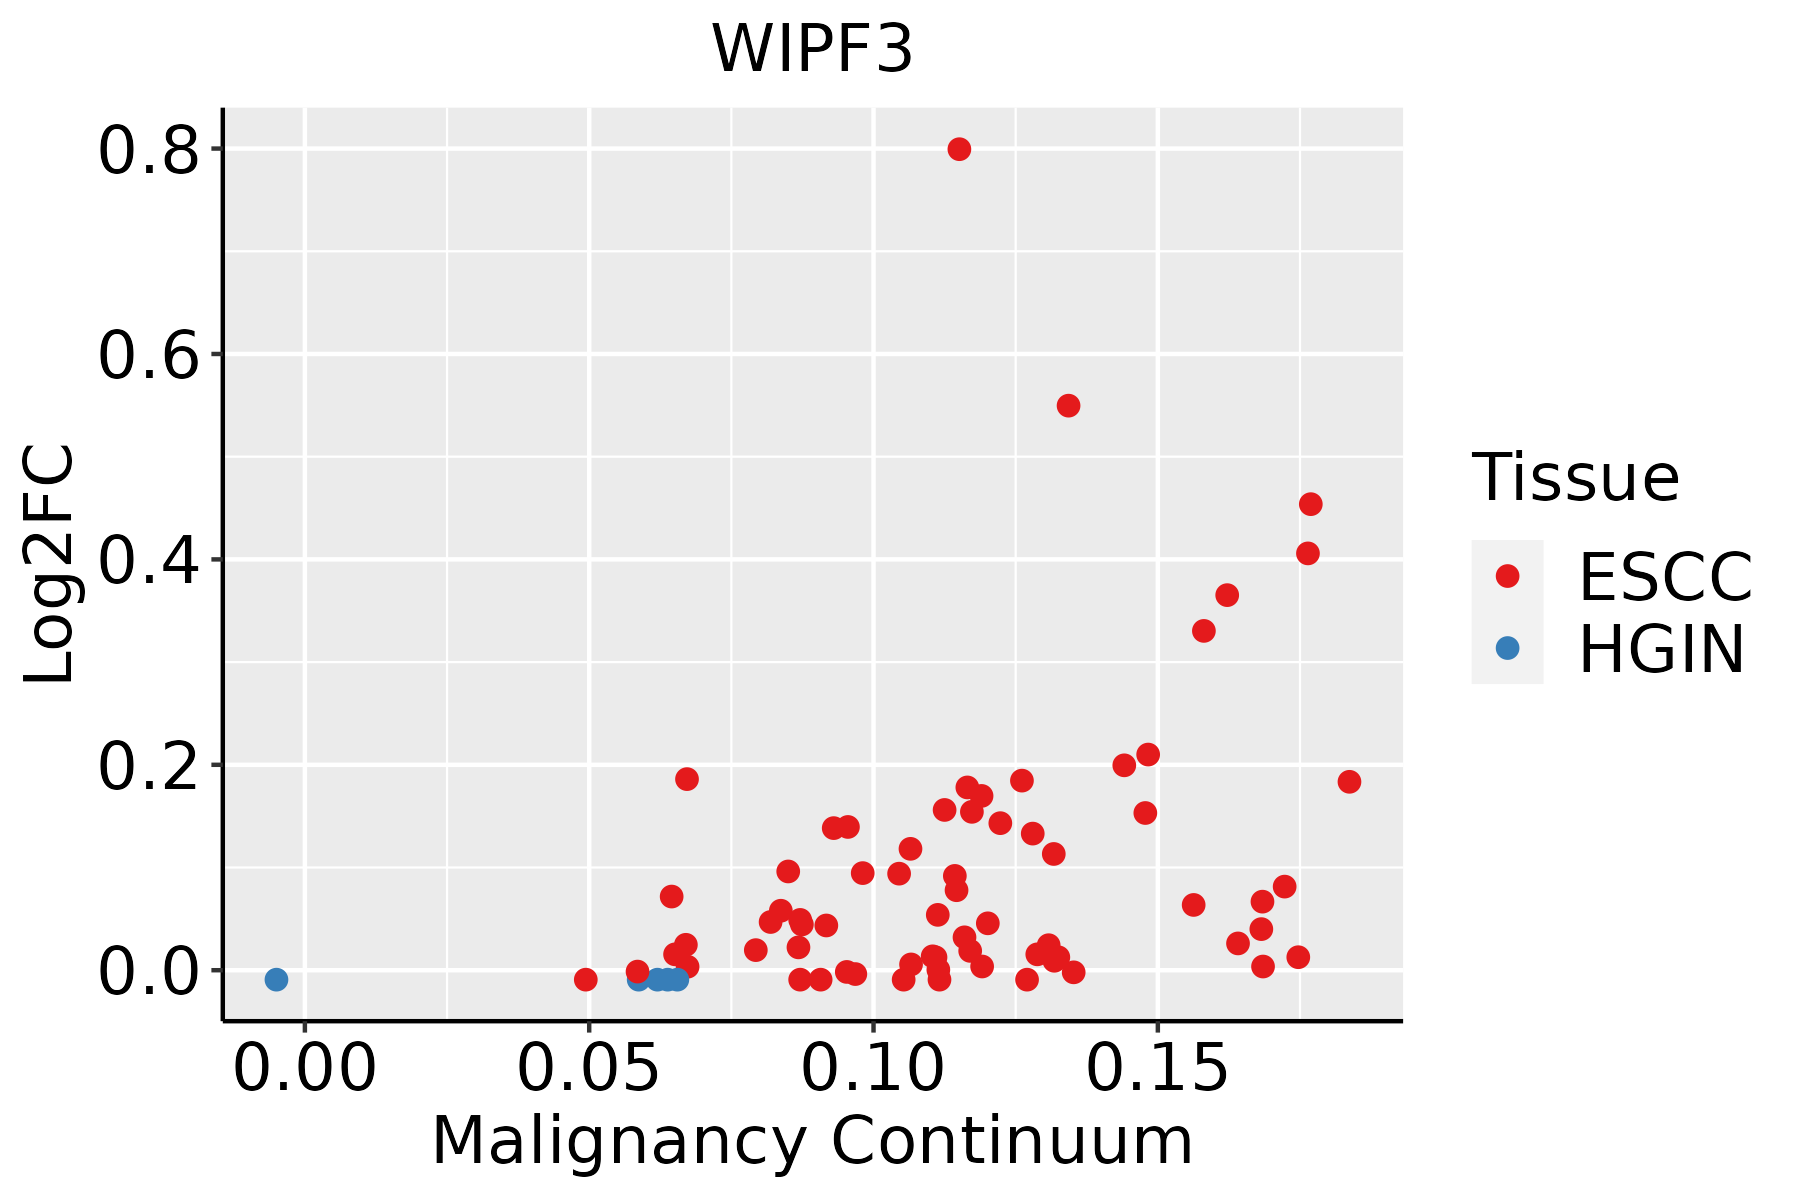 | ESCC: Esophageal squamous cell carcinoma |
| HGIN: High-grade intraepithelial neoplasias | ||
| LGIN: Low-grade intraepithelial neoplasias | ||
| Liver |  | HCC: Hepatocellular carcinoma |
| NAFLD: Non-alcoholic fatty liver disease |
| ∗log2FC in expression of this searched gene in stem-like cells from each diseased tissue sample relative to stem-like cells in normal samples in each tissue plotted against the malignancy continuum. Samples are colored based on if they are from different disease stage. |
Top |
Malignant transformation related pathway analysis |
| Find out the enriched GO biological processes and KEGG pathways involved in transition from healthy to precancer to cancer |
| Tissue | Disease Stage | Enriched GO biological Processes |
| Colorectum | AD |  |
| Colorectum | SER |  |
| Colorectum | MSS |  |
| Colorectum | MSI-H |  |
| Colorectum | FAP |  |
| ∗Top 15 enriched GO BP terms are showed in the bar plot of each disease state in each tissue. Each row represents a significant GO biological process which is colored according to the -log10(p.adjust). |
| Page: 1 2 3 4 5 6 7 8 9 |
| GO ID | Tissue | Disease Stage | Description | Gene Ratio | Bg Ratio | pvalue | p.adjust | Count |
| Page: 1 |
| Pathway ID | Tissue | Disease Stage | Description | Gene Ratio | Bg Ratio | pvalue | p.adjust | qvalue | Count |
| hsa04144210 | Esophagus | ESCC | Endocytosis | 186/4205 | 251/8465 | 9.74e-16 | 4.66e-14 | 2.39e-14 | 186 |
| hsa05130211 | Esophagus | ESCC | Pathogenic Escherichia coli infection | 142/4205 | 197/8465 | 8.21e-11 | 1.06e-09 | 5.42e-10 | 142 |
| hsa0513526 | Esophagus | ESCC | Yersinia infection | 100/4205 | 137/8465 | 1.80e-08 | 1.59e-07 | 8.12e-08 | 100 |
| hsa0414437 | Esophagus | ESCC | Endocytosis | 186/4205 | 251/8465 | 9.74e-16 | 4.66e-14 | 2.39e-14 | 186 |
| hsa05130310 | Esophagus | ESCC | Pathogenic Escherichia coli infection | 142/4205 | 197/8465 | 8.21e-11 | 1.06e-09 | 5.42e-10 | 142 |
| hsa05135111 | Esophagus | ESCC | Yersinia infection | 100/4205 | 137/8465 | 1.80e-08 | 1.59e-07 | 8.12e-08 | 100 |
| hsa0414422 | Liver | HCC | Endocytosis | 178/4020 | 251/8465 | 2.03e-14 | 5.22e-13 | 2.91e-13 | 178 |
| hsa0513042 | Liver | HCC | Pathogenic Escherichia coli infection | 129/4020 | 197/8465 | 2.02e-07 | 2.50e-06 | 1.39e-06 | 129 |
| hsa0513542 | Liver | HCC | Yersinia infection | 92/4020 | 137/8465 | 2.25e-06 | 2.19e-05 | 1.22e-05 | 92 |
| hsa0414432 | Liver | HCC | Endocytosis | 178/4020 | 251/8465 | 2.03e-14 | 5.22e-13 | 2.91e-13 | 178 |
| hsa0513052 | Liver | HCC | Pathogenic Escherichia coli infection | 129/4020 | 197/8465 | 2.02e-07 | 2.50e-06 | 1.39e-06 | 129 |
| hsa0513552 | Liver | HCC | Yersinia infection | 92/4020 | 137/8465 | 2.25e-06 | 2.19e-05 | 1.22e-05 | 92 |
| Page: 1 |
Top |
Cell-cell communication analysis |
| Identification of potential cell-cell interactions between two cell types and their ligand-receptor pairs for different disease states |
| Ligand | Receptor | LRpair | Pathway | Tissue | Disease Stage |
| Page: 1 |
Top |
Single-cell gene regulatory network inference analysis |
| Find out the significant the regulons (TFs) and the target genes of each regulon across cell types for different disease states |
| TF | Cell Type | Tissue | Disease Stage | Target Gene | RSS | Regulon Activity |
| ∗The dot plots of a searched regulon are shown for all cell subpopulations in each disease state of each tissue based on the regulon specific score inferred using pySCENIC and by calculating the average expression. |
| Page: 1 |
Top |
Somatic mutation of malignant transformation related genes |
| Annotation of somatic variants for genes involved in malignant transformation |
| Hugo Symbol | Variant Class | Variant Classification | dbSNP RS | HGVSc | HGVSp | HGVSp Short | SWISSPROT | BIOTYPE | SIFT | PolyPhen | Tumor Sample Barcode | Tissue | Histology | Sex | Age | Stage | Therapy Types | Drugs | Outcome |
| WIPF3 | SNV | Missense_Mutation | novel | c.453G>T | p.Arg151Ser | p.R151S | A6NGB9 | protein_coding | tolerated_low_confidence(0.11) | possibly_damaging(0.624) | TCGA-EK-A2PI-01 | Cervix | cervical & endocervical cancer | Female | <65 | III/IV | Unknown | Unknown | SD |
| WIPF3 | SNV | Missense_Mutation | c.773C>T | p.Pro258Leu | p.P258L | A6NGB9 | protein_coding | deleterious_low_confidence(0.02) | benign(0.001) | TCGA-AA-3710-01 | Colorectum | colon adenocarcinoma | Female | >=65 | I/II | Unknown | Unknown | SD | |
| WIPF3 | SNV | Missense_Mutation | c.926N>A | p.Pro309His | p.P309H | A6NGB9 | protein_coding | deleterious_low_confidence(0) | possibly_damaging(0.615) | TCGA-AA-3864-01 | Colorectum | colon adenocarcinoma | Male | >=65 | I/II | Unknown | Unknown | SD | |
| WIPF3 | SNV | Missense_Mutation | c.782N>T | p.Pro261Leu | p.P261L | A6NGB9 | protein_coding | deleterious_low_confidence(0) | probably_damaging(0.995) | TCGA-AZ-6598-01 | Colorectum | colon adenocarcinoma | Female | >=65 | I/II | Unknown | Unknown | SD | |
| WIPF3 | SNV | Missense_Mutation | c.655G>A | p.Val219Ile | p.V219I | A6NGB9 | protein_coding | tolerated_low_confidence(0.48) | benign(0) | TCGA-AZ-6601-01 | Colorectum | colon adenocarcinoma | Male | >=65 | I/II | Unknown | Unknown | PD | |
| WIPF3 | SNV | Missense_Mutation | rs754655046 | c.143C>T | p.Ala48Val | p.A48V | A6NGB9 | protein_coding | deleterious(0) | benign(0.125) | TCGA-CM-4747-01 | Colorectum | colon adenocarcinoma | Male | <65 | I/II | Chemotherapy | fluorouracil | SD |
| WIPF3 | SNV | Missense_Mutation | c.929N>T | p.Ala310Val | p.A310V | A6NGB9 | protein_coding | tolerated_low_confidence(0.19) | benign(0.001) | TCGA-F4-6703-01 | Colorectum | colon adenocarcinoma | Male | <65 | I/II | Unknown | Unknown | SD | |
| WIPF3 | SNV | Missense_Mutation | c.73N>A | p.Pro25Thr | p.P25T | A6NGB9 | protein_coding | deleterious_low_confidence(0.02) | possibly_damaging(0.521) | TCGA-F4-6808-01 | Colorectum | colon adenocarcinoma | Female | <65 | I/II | Unknown | Unknown | SD | |
| WIPF3 | SNV | Missense_Mutation | rs752160943 | c.128C>T | p.Pro43Leu | p.P43L | A6NGB9 | protein_coding | tolerated_low_confidence(0.19) | benign(0.007) | TCGA-AG-A002-01 | Colorectum | rectum adenocarcinoma | Male | <65 | I/II | Unknown | Unknown | SD |
| WIPF3 | deletion | Frame_Shift_Del | c.970delN | p.Pro325ArgfsTer49 | p.P325Rfs*49 | A6NGB9 | protein_coding | TCGA-A6-5661-01 | Colorectum | colon adenocarcinoma | Female | >=65 | I/II | Unknown | Unknown | SD |
| Page: 1 2 3 4 |
Top |
Related drugs of malignant transformation related genes |
| Identification of chemicals and drugs interact with genes involved in malignant transfromation |
| (DGIdb 4.0) |
| Entrez ID | Symbol | Category | Interaction Types | Drug Claim Name | Drug Name | PMIDs |
| Page: 1 |

Copyright 2023-Present -The University of Texas Health Science Center at Houston |