
|
|||||
|
 | |
| |
| |
| |
| |
| |
|
Gene: WIPF1 |
Gene summary for WIPF1 |
| Gene information | Species | Human | Gene symbol | WIPF1 | Gene ID | 7456 |
| Gene name | WAS/WASL interacting protein family member 1 | |
| Gene Alias | PRPL-2 | |
| Cytomap | 2q31.1 | |
| Gene Type | protein-coding | GO ID | GO:0006928 | UniProtAcc | A0A140VJZ9 |
Top |
Malignant transformation analysis |
| Identification of the aberrant gene expression in precancerous and cancerous lesions by comparing the gene expression of stem-like cells in diseased tissues with normal stem cells |
| Entrez ID | Symbol | Replicates | Species | Organ | Tissue | Adj P-value | Log2FC | Malignancy |
| 7456 | WIPF1 | LZE7T | Human | Esophagus | ESCC | 1.85e-05 | 4.49e-01 | 0.0667 |
| 7456 | WIPF1 | LZE24T | Human | Esophagus | ESCC | 2.82e-14 | 2.97e-01 | 0.0596 |
| 7456 | WIPF1 | LZE6T | Human | Esophagus | ESCC | 4.94e-18 | 7.47e-01 | 0.0845 |
| 7456 | WIPF1 | P2T-E | Human | Esophagus | ESCC | 2.01e-12 | 2.50e-01 | 0.1177 |
| 7456 | WIPF1 | P8T-E | Human | Esophagus | ESCC | 5.44e-08 | 9.12e-02 | 0.0889 |
| 7456 | WIPF1 | P9T-E | Human | Esophagus | ESCC | 3.84e-08 | 2.93e-01 | 0.1131 |
| 7456 | WIPF1 | P10T-E | Human | Esophagus | ESCC | 4.71e-04 | 1.01e-01 | 0.116 |
| 7456 | WIPF1 | P11T-E | Human | Esophagus | ESCC | 3.72e-17 | 8.26e-01 | 0.1426 |
| 7456 | WIPF1 | P12T-E | Human | Esophagus | ESCC | 6.16e-15 | 2.68e-01 | 0.1122 |
| 7456 | WIPF1 | P15T-E | Human | Esophagus | ESCC | 2.72e-07 | 1.84e-01 | 0.1149 |
| 7456 | WIPF1 | P16T-E | Human | Esophagus | ESCC | 1.05e-12 | 1.82e-01 | 0.1153 |
| 7456 | WIPF1 | P19T-E | Human | Esophagus | ESCC | 1.87e-07 | 9.23e-01 | 0.1662 |
| 7456 | WIPF1 | P20T-E | Human | Esophagus | ESCC | 1.46e-14 | 3.06e-01 | 0.1124 |
| 7456 | WIPF1 | P21T-E | Human | Esophagus | ESCC | 1.03e-05 | 1.38e-01 | 0.1617 |
| 7456 | WIPF1 | P22T-E | Human | Esophagus | ESCC | 1.37e-09 | 1.28e-01 | 0.1236 |
| 7456 | WIPF1 | P24T-E | Human | Esophagus | ESCC | 7.84e-19 | 4.47e-01 | 0.1287 |
| 7456 | WIPF1 | P26T-E | Human | Esophagus | ESCC | 3.76e-04 | 3.70e-02 | 0.1276 |
| 7456 | WIPF1 | P28T-E | Human | Esophagus | ESCC | 2.73e-02 | 1.29e-01 | 0.1149 |
| 7456 | WIPF1 | P31T-E | Human | Esophagus | ESCC | 3.39e-07 | 9.90e-02 | 0.1251 |
| 7456 | WIPF1 | P32T-E | Human | Esophagus | ESCC | 1.05e-26 | 5.74e-01 | 0.1666 |
| Page: 1 2 3 4 |
| Tissue | Expression Dynamics | Abbreviation |
| Esophagus |  | ESCC: Esophageal squamous cell carcinoma |
| HGIN: High-grade intraepithelial neoplasias | ||
| LGIN: Low-grade intraepithelial neoplasias | ||
| Oral Cavity | 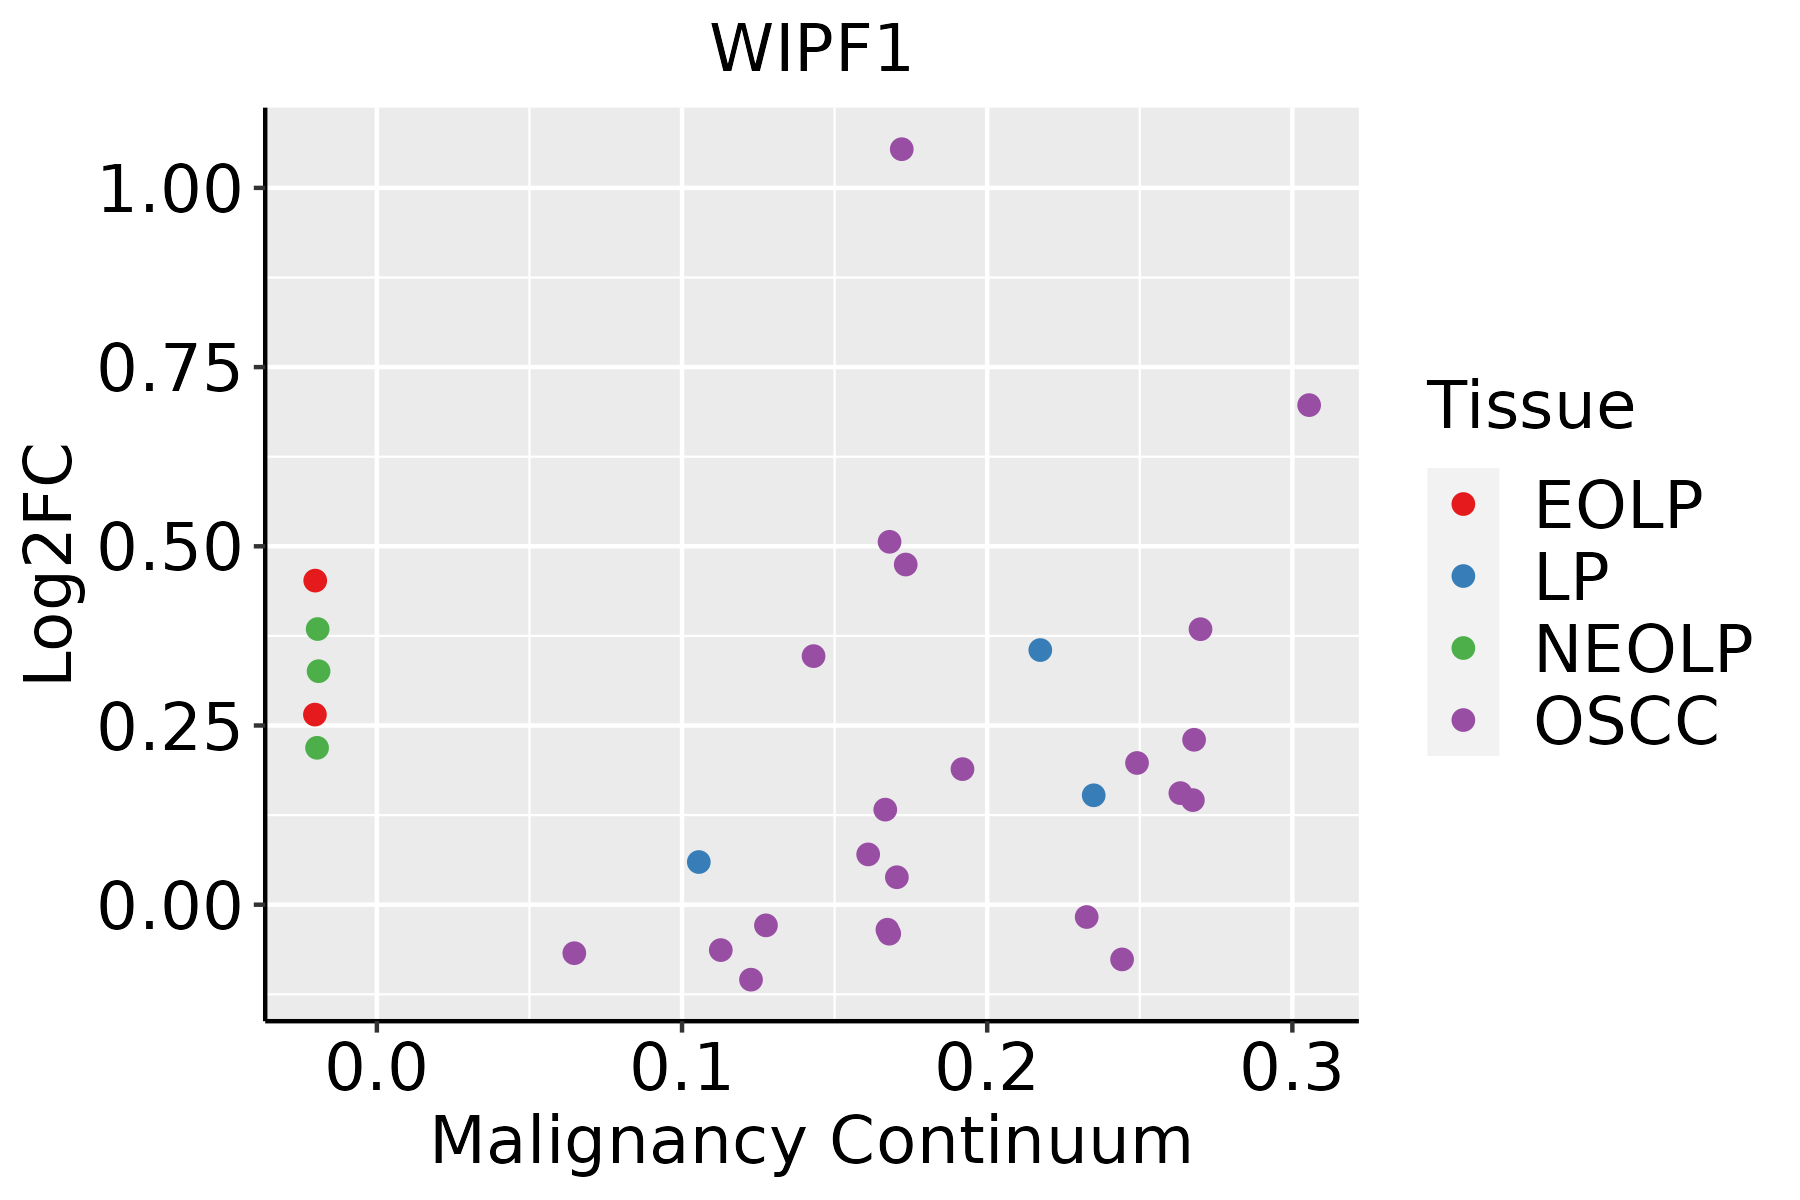 | EOLP: Erosive Oral lichen planus |
| LP: leukoplakia | ||
| NEOLP: Non-erosive oral lichen planus | ||
| OSCC: Oral squamous cell carcinoma | ||
| Thyroid | 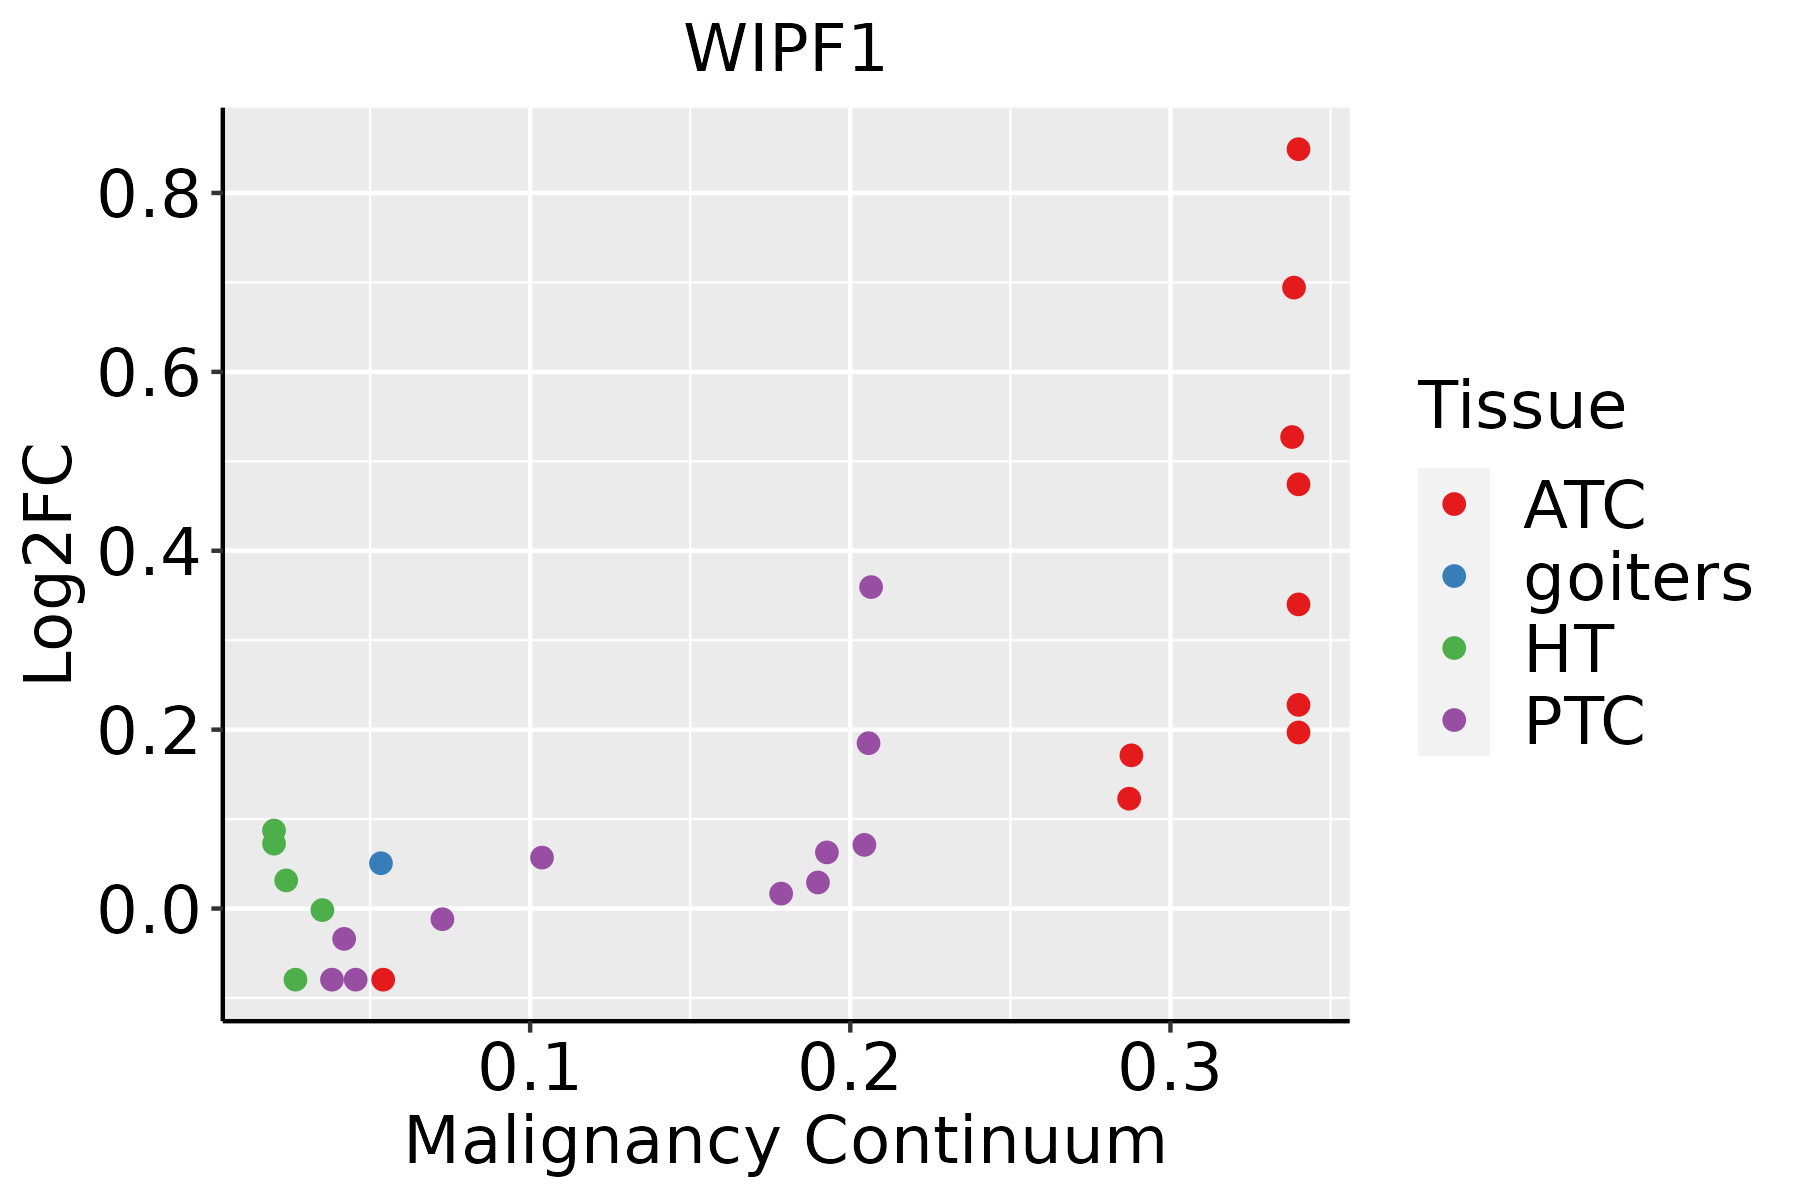 | ATC: Anaplastic thyroid cancer |
| HT: Hashimoto's thyroiditis | ||
| PTC: Papillary thyroid cancer |
| ∗log2FC in expression of this searched gene in stem-like cells from each diseased tissue sample relative to stem-like cells in normal samples in each tissue plotted against the malignancy continuum. Samples are colored based on if they are from different disease stage. |
Top |
Malignant transformation related pathway analysis |
| Find out the enriched GO biological processes and KEGG pathways involved in transition from healthy to precancer to cancer |
| Tissue | Disease Stage | Enriched GO biological Processes |
| Colorectum | AD |  |
| Colorectum | SER |  |
| Colorectum | MSS |  |
| Colorectum | MSI-H |  |
| Colorectum | FAP |  |
| ∗Top 15 enriched GO BP terms are showed in the bar plot of each disease state in each tissue. Each row represents a significant GO biological process which is colored according to the -log10(p.adjust). |
| Page: 1 2 3 4 5 6 7 8 9 |
| GO ID | Tissue | Disease Stage | Description | Gene Ratio | Bg Ratio | pvalue | p.adjust | Count |
| GO:000701527 | Esophagus | ESCC | actin filament organization | 259/8552 | 442/18723 | 2.37e-08 | 4.50e-07 | 259 |
| GO:000815420 | Esophagus | ESCC | actin polymerization or depolymerization | 130/8552 | 218/18723 | 2.19e-05 | 1.88e-04 | 130 |
| GO:000701520 | Oral cavity | OSCC | actin filament organization | 230/7305 | 442/18723 | 1.37e-08 | 2.77e-07 | 230 |
| GO:000815418 | Oral cavity | OSCC | actin polymerization or depolymerization | 117/7305 | 218/18723 | 7.38e-06 | 8.04e-05 | 117 |
| GO:000701526 | Oral cavity | EOLP | actin filament organization | 102/2218 | 442/18723 | 1.61e-11 | 2.48e-09 | 102 |
| GO:000815424 | Oral cavity | EOLP | actin polymerization or depolymerization | 53/2218 | 218/18723 | 2.08e-07 | 6.55e-06 | 53 |
| GO:000701534 | Oral cavity | NEOLP | actin filament organization | 94/2005 | 442/18723 | 4.49e-11 | 5.80e-09 | 94 |
| GO:000815431 | Oral cavity | NEOLP | actin polymerization or depolymerization | 47/2005 | 218/18723 | 2.11e-06 | 4.91e-05 | 47 |
| GO:003004810 | Oral cavity | NEOLP | actin filament-based movement | 24/2005 | 127/18723 | 4.02e-03 | 2.29e-02 | 24 |
| GO:0007015112 | Thyroid | PTC | actin filament organization | 225/5968 | 442/18723 | 3.76e-17 | 3.44e-15 | 225 |
| GO:000815426 | Thyroid | PTC | actin polymerization or depolymerization | 117/5968 | 218/18723 | 1.85e-11 | 7.21e-10 | 117 |
| GO:0007015210 | Thyroid | ATC | actin filament organization | 227/6293 | 442/18723 | 5.96e-15 | 3.85e-13 | 227 |
| GO:0008154111 | Thyroid | ATC | actin polymerization or depolymerization | 119/6293 | 218/18723 | 1.32e-10 | 4.08e-09 | 119 |
| Page: 1 |
| Pathway ID | Tissue | Disease Stage | Description | Gene Ratio | Bg Ratio | pvalue | p.adjust | qvalue | Count |
| hsa04144210 | Esophagus | ESCC | Endocytosis | 186/4205 | 251/8465 | 9.74e-16 | 4.66e-14 | 2.39e-14 | 186 |
| hsa05130211 | Esophagus | ESCC | Pathogenic Escherichia coli infection | 142/4205 | 197/8465 | 8.21e-11 | 1.06e-09 | 5.42e-10 | 142 |
| hsa0513526 | Esophagus | ESCC | Yersinia infection | 100/4205 | 137/8465 | 1.80e-08 | 1.59e-07 | 8.12e-08 | 100 |
| hsa0414437 | Esophagus | ESCC | Endocytosis | 186/4205 | 251/8465 | 9.74e-16 | 4.66e-14 | 2.39e-14 | 186 |
| hsa05130310 | Esophagus | ESCC | Pathogenic Escherichia coli infection | 142/4205 | 197/8465 | 8.21e-11 | 1.06e-09 | 5.42e-10 | 142 |
| hsa05135111 | Esophagus | ESCC | Yersinia infection | 100/4205 | 137/8465 | 1.80e-08 | 1.59e-07 | 8.12e-08 | 100 |
| hsa0513030 | Oral cavity | OSCC | Pathogenic Escherichia coli infection | 129/3704 | 197/8465 | 4.32e-10 | 5.17e-09 | 2.63e-09 | 129 |
| hsa0513520 | Oral cavity | OSCC | Yersinia infection | 94/3704 | 137/8465 | 2.85e-09 | 3.08e-08 | 1.57e-08 | 94 |
| hsa05130114 | Oral cavity | OSCC | Pathogenic Escherichia coli infection | 129/3704 | 197/8465 | 4.32e-10 | 5.17e-09 | 2.63e-09 | 129 |
| hsa05135110 | Oral cavity | OSCC | Yersinia infection | 94/3704 | 137/8465 | 2.85e-09 | 3.08e-08 | 1.57e-08 | 94 |
| hsa0414442 | Oral cavity | EOLP | Endocytosis | 71/1218 | 251/8465 | 5.28e-09 | 8.97e-08 | 5.29e-08 | 71 |
| hsa0513544 | Oral cavity | EOLP | Yersinia infection | 44/1218 | 137/8465 | 8.88e-08 | 1.06e-06 | 6.27e-07 | 44 |
| hsa0513045 | Oral cavity | EOLP | Pathogenic Escherichia coli infection | 54/1218 | 197/8465 | 1.10e-06 | 9.96e-06 | 5.87e-06 | 54 |
| hsa0414452 | Oral cavity | EOLP | Endocytosis | 71/1218 | 251/8465 | 5.28e-09 | 8.97e-08 | 5.29e-08 | 71 |
| hsa0513554 | Oral cavity | EOLP | Yersinia infection | 44/1218 | 137/8465 | 8.88e-08 | 1.06e-06 | 6.27e-07 | 44 |
| hsa0513055 | Oral cavity | EOLP | Pathogenic Escherichia coli infection | 54/1218 | 197/8465 | 1.10e-06 | 9.96e-06 | 5.87e-06 | 54 |
| hsa0513063 | Oral cavity | NEOLP | Pathogenic Escherichia coli infection | 55/1112 | 197/8465 | 2.04e-08 | 4.32e-07 | 2.72e-07 | 55 |
| hsa0414461 | Oral cavity | NEOLP | Endocytosis | 62/1112 | 251/8465 | 3.56e-07 | 4.92e-06 | 3.09e-06 | 62 |
| hsa0513561 | Oral cavity | NEOLP | Yersinia infection | 33/1112 | 137/8465 | 3.20e-04 | 2.00e-03 | 1.26e-03 | 33 |
| hsa0513073 | Oral cavity | NEOLP | Pathogenic Escherichia coli infection | 55/1112 | 197/8465 | 2.04e-08 | 4.32e-07 | 2.72e-07 | 55 |
| Page: 1 2 |
Top |
Cell-cell communication analysis |
| Identification of potential cell-cell interactions between two cell types and their ligand-receptor pairs for different disease states |
| Ligand | Receptor | LRpair | Pathway | Tissue | Disease Stage |
| Page: 1 |
Top |
Single-cell gene regulatory network inference analysis |
| Find out the significant the regulons (TFs) and the target genes of each regulon across cell types for different disease states |
| TF | Cell Type | Tissue | Disease Stage | Target Gene | RSS | Regulon Activity |
| ∗The dot plots of a searched regulon are shown for all cell subpopulations in each disease state of each tissue based on the regulon specific score inferred using pySCENIC and by calculating the average expression. |
| Page: 1 |
Top |
Somatic mutation of malignant transformation related genes |
| Annotation of somatic variants for genes involved in malignant transformation |
| Hugo Symbol | Variant Class | Variant Classification | dbSNP RS | HGVSc | HGVSp | HGVSp Short | SWISSPROT | BIOTYPE | SIFT | PolyPhen | Tumor Sample Barcode | Tissue | Histology | Sex | Age | Stage | Therapy Types | Drugs | Outcome |
| WIPF1 | SNV | Missense_Mutation | rs758556440 | c.746G>A | p.Arg249Gln | p.R249Q | O43516 | protein_coding | deleterious(0.01) | benign(0.015) | TCGA-AC-A2QI-01 | Breast | breast invasive carcinoma | Female | >=65 | III/IV | Chemotherapy | cytoxan | CR |
| WIPF1 | SNV | Missense_Mutation | rs780660555 | c.926N>T | p.Pro309Leu | p.P309L | O43516 | protein_coding | tolerated(0.27) | benign(0.015) | TCGA-BH-A0DT-01 | Breast | breast invasive carcinoma | Female | <65 | I/II | Chemotherapy | taxotere | CR |
| WIPF1 | SNV | Missense_Mutation | c.115N>C | p.Asp39His | p.D39H | O43516 | protein_coding | deleterious(0) | probably_damaging(0.999) | TCGA-E9-A226-01 | Breast | breast invasive carcinoma | Female | <65 | III/IV | Hormone Therapy | tamoxiphen | PD | |
| WIPF1 | insertion | Frame_Shift_Ins | novel | c.780_781insAG | p.Asp261ArgfsTer110 | p.D261Rfs*110 | O43516 | protein_coding | TCGA-AN-A0FN-01 | Breast | breast invasive carcinoma | Female | <65 | I/II | Unknown | Unknown | SD | ||
| WIPF1 | insertion | Nonsense_Mutation | novel | c.778_779insGTACCTCTCAGAGTTGTTATAAGAATTAAA | p.Leu260delinsCysThrSerGlnSerCysTyrLysAsnTerMet | p.L260delinsCTSQSCYKN*M | O43516 | protein_coding | TCGA-AN-A0FN-01 | Breast | breast invasive carcinoma | Female | <65 | I/II | Unknown | Unknown | SD | ||
| WIPF1 | insertion | Frame_Shift_Ins | novel | c.396_397insAT | p.Gly133MetfsTer109 | p.G133Mfs*109 | O43516 | protein_coding | TCGA-BH-A18G-01 | Breast | breast invasive carcinoma | Female | >=65 | I/II | Unknown | Unknown | SD | ||
| WIPF1 | deletion | Frame_Shift_Del | novel | c.392_395delCGGG | p.Pro131GlnfsTer109 | p.P131Qfs*109 | O43516 | protein_coding | TCGA-BH-A18G-01 | Breast | breast invasive carcinoma | Female | >=65 | I/II | Unknown | Unknown | SD | ||
| WIPF1 | SNV | Missense_Mutation | rs770105478 | c.244N>A | p.Gly82Arg | p.G82R | O43516 | protein_coding | tolerated(0.34) | benign(0.336) | TCGA-FU-A3NI-01 | Cervix | cervical & endocervical cancer | Female | <65 | I/II | Unknown | Unknown | SD |
| WIPF1 | SNV | Missense_Mutation | c.925N>G | p.Pro309Ala | p.P309A | O43516 | protein_coding | tolerated(0.11) | benign(0.071) | TCGA-MU-A51Y-01 | Cervix | cervical & endocervical cancer | Female | <65 | I/II | Unknown | Unknown | SD | |
| WIPF1 | SNV | Missense_Mutation | novel | c.541N>A | p.Asp181Asn | p.D181N | O43516 | protein_coding | deleterious(0.01) | benign(0.001) | TCGA-VS-A9U7-01 | Cervix | cervical & endocervical cancer | Female | <65 | I/II | Chemotherapy | cisplatin | CR |
| Page: 1 2 3 4 5 6 7 8 9 10 |
Top |
Related drugs of malignant transformation related genes |
| Identification of chemicals and drugs interact with genes involved in malignant transfromation |
| (DGIdb 4.0) |
| Entrez ID | Symbol | Category | Interaction Types | Drug Claim Name | Drug Name | PMIDs |
| Page: 1 |

Copyright 2023-Present -The University of Texas Health Science Center at Houston |