
|
|||||
|
 | |
| |
| |
| |
| |
| |
|
Gene: WIF1 |
Gene summary for WIF1 |
| Gene information | Species | Human | Gene symbol | WIF1 | Gene ID | 11197 |
| Gene name | WNT inhibitory factor 1 | |
| Gene Alias | WIF-1 | |
| Cytomap | 12q14.3 | |
| Gene Type | protein-coding | GO ID | GO:0007154 | UniProtAcc | Q9Y5W5 |
Top |
Malignant transformation analysis |
| Identification of the aberrant gene expression in precancerous and cancerous lesions by comparing the gene expression of stem-like cells in diseased tissues with normal stem cells |
| Entrez ID | Symbol | Replicates | Species | Organ | Tissue | Adj P-value | Log2FC | Malignancy |
| 11197 | WIF1 | HCC1 | Human | Liver | HCC | 1.76e-16 | 4.71e+00 | 0.5336 |
| 11197 | WIF1 | S014 | Human | Liver | HCC | 2.66e-13 | 7.91e-01 | 0.2254 |
| 11197 | WIF1 | S015 | Human | Liver | HCC | 1.98e-08 | 7.05e-01 | 0.2375 |
| 11197 | WIF1 | S016 | Human | Liver | HCC | 2.99e-15 | 1.17e+00 | 0.2243 |
| 11197 | WIF1 | RNA-P23T2-P23T2-1 | Human | Lung | MIAC | 4.45e-03 | -8.52e-02 | -0.037 |
| 11197 | WIF1 | RNA-P25T1-P25T1-1 | Human | Lung | AIS | 1.30e-03 | -1.00e+00 | -0.2116 |
| 11197 | WIF1 | RNA-P25T1-P25T1-4 | Human | Lung | AIS | 1.42e-02 | -1.01e+00 | -0.2119 |
| 11197 | WIF1 | RNA-P3T-P3T-1 | Human | Lung | IAC | 4.28e-06 | -1.09e+00 | 0.1829 |
| 11197 | WIF1 | RNA-P3T-P3T-2 | Human | Lung | IAC | 1.27e-06 | -1.09e+00 | 0.1835 |
| 11197 | WIF1 | RNA-P3T-P3T-4 | Human | Lung | IAC | 5.72e-07 | -1.09e+00 | 0.1859 |
| 11197 | WIF1 | RNA-P6T2-P6T2-1 | Human | Lung | IAC | 4.84e-19 | -1.06e+00 | -0.0166 |
| 11197 | WIF1 | RNA-P6T2-P6T2-2 | Human | Lung | IAC | 1.38e-18 | -1.05e+00 | -0.0132 |
| 11197 | WIF1 | RNA-P6T2-P6T2-3 | Human | Lung | IAC | 1.45e-19 | -1.06e+00 | -0.013 |
| 11197 | WIF1 | RNA-P6T2-P6T2-4 | Human | Lung | IAC | 7.02e-18 | -1.05e+00 | -0.0121 |
| 11197 | WIF1 | RNA-P7T1-P7T1-2 | Human | Lung | AIS | 1.83e-05 | -6.39e-01 | -0.0876 |
| 11197 | WIF1 | RNA-P7T1-P7T1-4 | Human | Lung | AIS | 5.13e-04 | -5.58e-01 | -0.0809 |
| 11197 | WIF1 | C08 | Human | Oral cavity | OSCC | 4.78e-06 | 6.85e-01 | 0.1919 |
| 11197 | WIF1 | SYSMH4 | Human | Oral cavity | OSCC | 5.86e-10 | 8.16e-01 | 0.1226 |
| 11197 | WIF1 | GSM5252128_BPH327PrGF_Via | Human | Prostate | BPH | 7.89e-27 | 1.16e+00 | -0.1688 |
| 11197 | WIF1 | GSM5252129_BPH327PrSF_Via | Human | Prostate | BPH | 1.55e-09 | 9.91e-01 | -0.1697 |
| Page: 1 2 |
| Tissue | Expression Dynamics | Abbreviation |
| Liver |  | HCC: Hepatocellular carcinoma |
| NAFLD: Non-alcoholic fatty liver disease | ||
| Lung |  | AAH: Atypical adenomatous hyperplasia |
| AIS: Adenocarcinoma in situ | ||
| IAC: Invasive lung adenocarcinoma | ||
| MIA: Minimally invasive adenocarcinoma | ||
| Oral Cavity | 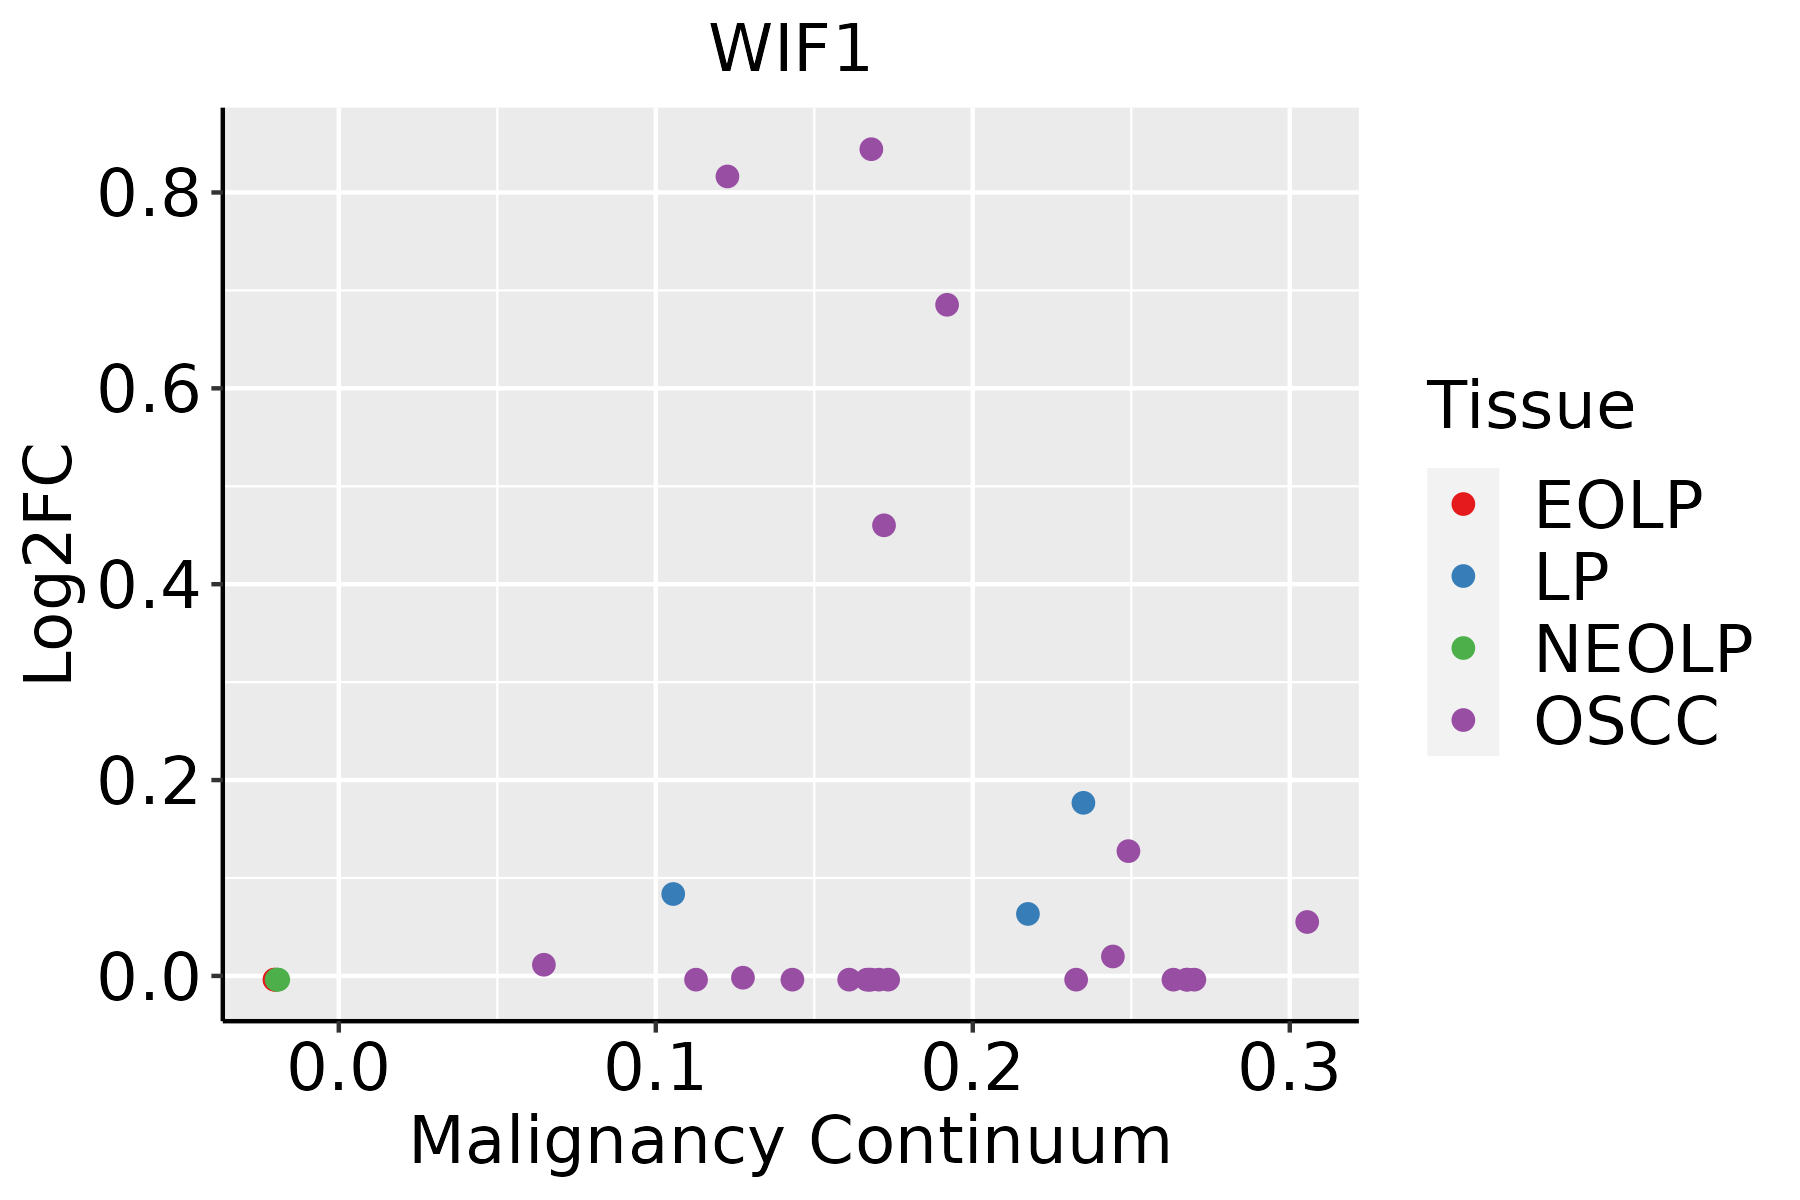 | EOLP: Erosive Oral lichen planus |
| LP: leukoplakia | ||
| NEOLP: Non-erosive oral lichen planus | ||
| OSCC: Oral squamous cell carcinoma | ||
| Prostate | 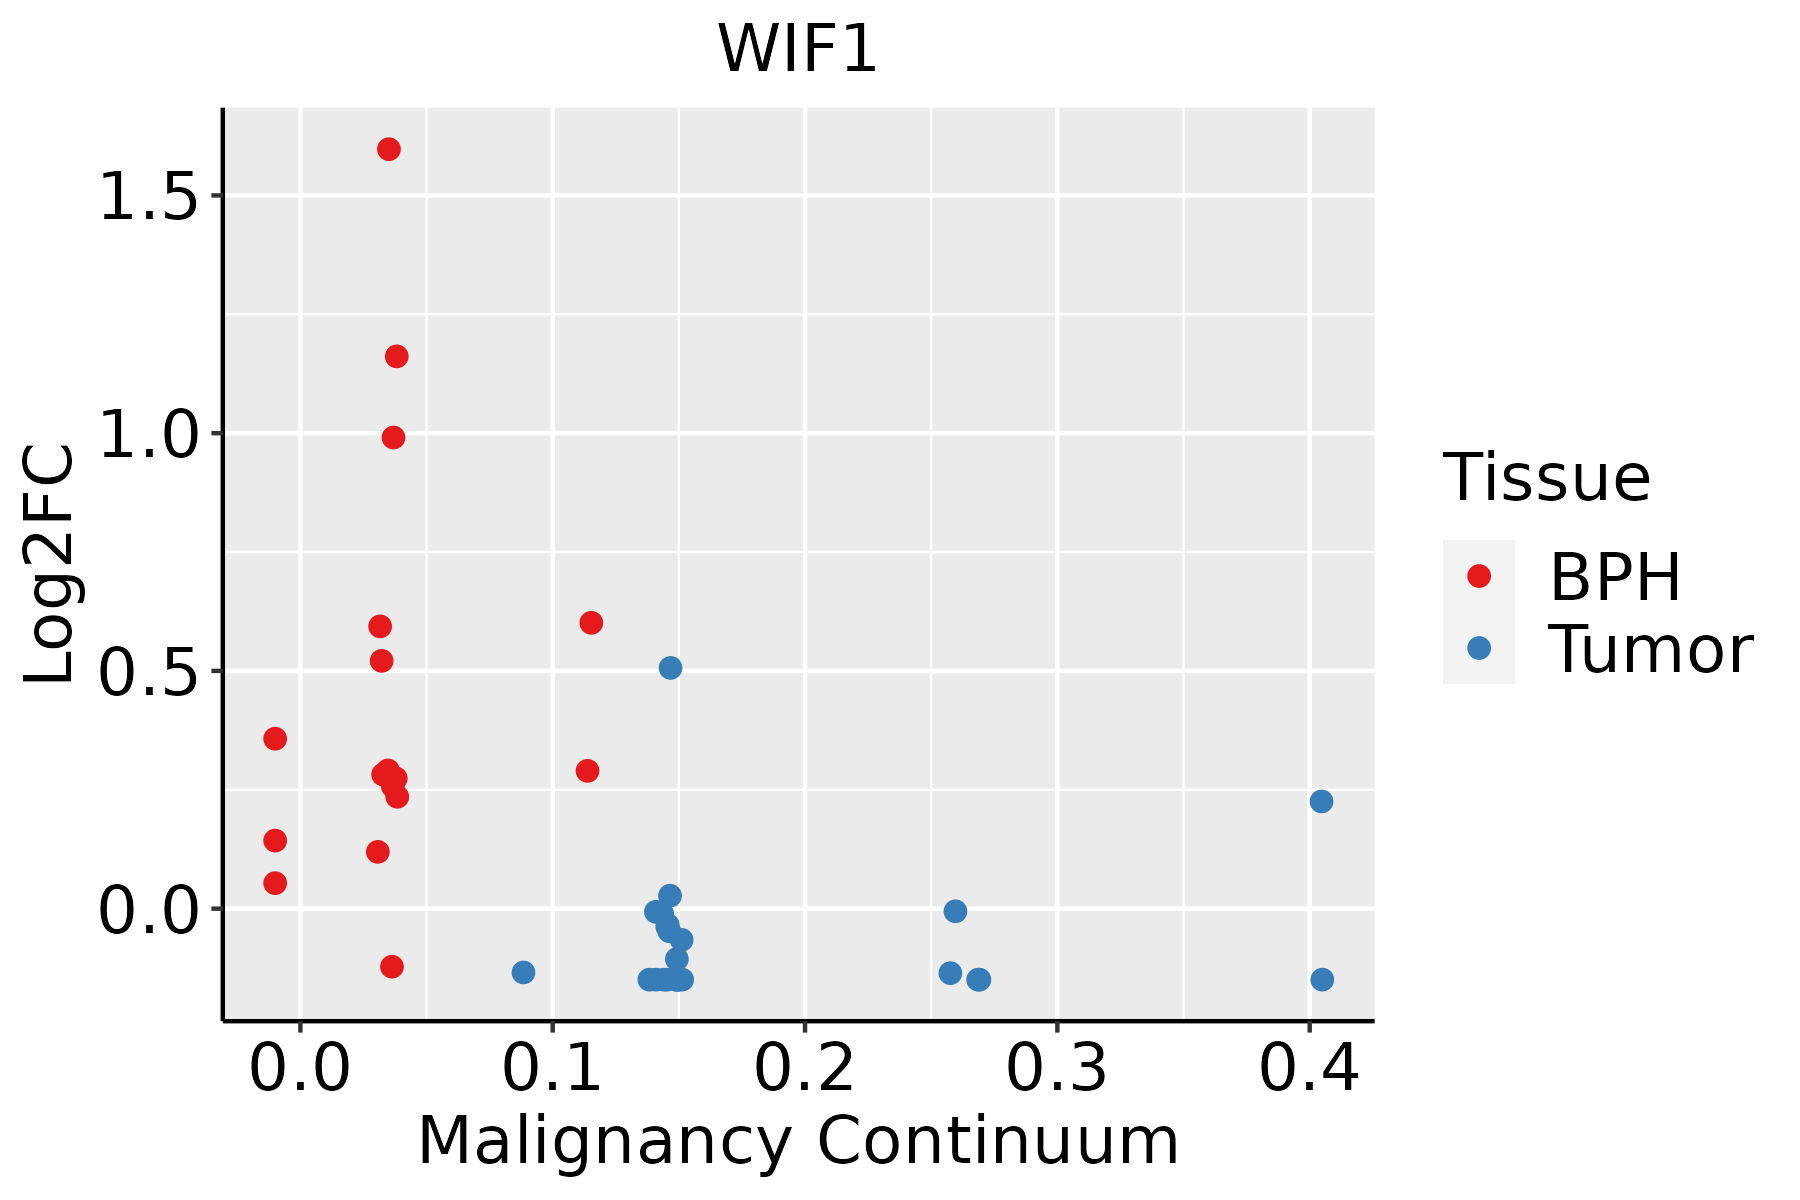 | BPH: Benign Prostatic Hyperplasia |
| ∗log2FC in expression of this searched gene in stem-like cells from each diseased tissue sample relative to stem-like cells in normal samples in each tissue plotted against the malignancy continuum. Samples are colored based on if they are from different disease stage. |
Top |
Malignant transformation related pathway analysis |
| Find out the enriched GO biological processes and KEGG pathways involved in transition from healthy to precancer to cancer |
| Tissue | Disease Stage | Enriched GO biological Processes |
| Colorectum | AD |  |
| Colorectum | SER |  |
| Colorectum | MSS |  |
| Colorectum | MSI-H |  |
| Colorectum | FAP |  |
| ∗Top 15 enriched GO BP terms are showed in the bar plot of each disease state in each tissue. Each row represents a significant GO biological process which is colored according to the -log10(p.adjust). |
| Page: 1 2 3 4 5 6 7 8 9 |
| GO ID | Tissue | Disease Stage | Description | Gene Ratio | Bg Ratio | pvalue | p.adjust | Count |
| GO:019873821 | Liver | HCC | cell-cell signaling by wnt | 247/7958 | 446/18723 | 2.11e-08 | 4.96e-07 | 247 |
| GO:001605521 | Liver | HCC | Wnt signaling pathway | 245/7958 | 444/18723 | 3.68e-08 | 8.09e-07 | 245 |
| GO:003011121 | Liver | HCC | regulation of Wnt signaling pathway | 180/7958 | 328/18723 | 3.62e-06 | 4.72e-05 | 180 |
| GO:00454441 | Liver | HCC | fat cell differentiation | 120/7958 | 229/18723 | 1.52e-03 | 8.05e-03 | 120 |
| GO:00160556 | Lung | IAC | Wnt signaling pathway | 95/2061 | 444/18723 | 1.13e-10 | 2.80e-08 | 95 |
| GO:01987386 | Lung | IAC | cell-cell signaling by wnt | 95/2061 | 446/18723 | 1.46e-10 | 3.48e-08 | 95 |
| GO:00301116 | Lung | IAC | regulation of Wnt signaling pathway | 74/2061 | 328/18723 | 1.14e-09 | 2.05e-07 | 74 |
| GO:00456002 | Lung | IAC | positive regulation of fat cell differentiation | 17/2061 | 66/18723 | 6.14e-04 | 8.46e-03 | 17 |
| GO:00454443 | Lung | IAC | fat cell differentiation | 42/2061 | 229/18723 | 6.19e-04 | 8.50e-03 | 42 |
| GO:00301783 | Lung | IAC | negative regulation of Wnt signaling pathway | 32/2061 | 170/18723 | 1.68e-03 | 1.76e-02 | 32 |
| GO:001605512 | Lung | AIS | Wnt signaling pathway | 91/1849 | 444/18723 | 9.38e-12 | 5.47e-09 | 91 |
| GO:019873812 | Lung | AIS | cell-cell signaling by wnt | 91/1849 | 446/18723 | 1.22e-11 | 6.13e-09 | 91 |
| GO:003011112 | Lung | AIS | regulation of Wnt signaling pathway | 70/1849 | 328/18723 | 3.81e-10 | 8.87e-08 | 70 |
| GO:003017811 | Lung | AIS | negative regulation of Wnt signaling pathway | 32/1849 | 170/18723 | 2.64e-04 | 5.05e-03 | 32 |
| GO:004544411 | Lung | AIS | fat cell differentiation | 37/1849 | 229/18723 | 1.88e-03 | 2.08e-02 | 37 |
| GO:00456001 | Lung | AIS | positive regulation of fat cell differentiation | 14/1849 | 66/18723 | 4.51e-03 | 3.99e-02 | 14 |
| GO:003011122 | Lung | MIAC | regulation of Wnt signaling pathway | 41/967 | 328/18723 | 1.51e-07 | 3.69e-05 | 41 |
| GO:001605531 | Lung | MIAC | Wnt signaling pathway | 50/967 | 444/18723 | 1.88e-07 | 4.02e-05 | 50 |
| GO:019873831 | Lung | MIAC | cell-cell signaling by wnt | 50/967 | 446/18723 | 2.16e-07 | 4.11e-05 | 50 |
| GO:00301782 | Lung | MIAC | negative regulation of Wnt signaling pathway | 19/967 | 170/18723 | 1.28e-03 | 2.38e-02 | 19 |
| Page: 1 2 |
| Pathway ID | Tissue | Disease Stage | Description | Gene Ratio | Bg Ratio | pvalue | p.adjust | qvalue | Count |
| hsa043108 | Lung | IAC | Wnt signaling pathway | 40/1053 | 171/8465 | 4.56e-05 | 7.06e-04 | 4.69e-04 | 40 |
| hsa0431011 | Lung | IAC | Wnt signaling pathway | 40/1053 | 171/8465 | 4.56e-05 | 7.06e-04 | 4.69e-04 | 40 |
| hsa0431021 | Lung | AIS | Wnt signaling pathway | 39/961 | 171/8465 | 1.29e-05 | 3.32e-04 | 2.12e-04 | 39 |
| hsa0431031 | Lung | AIS | Wnt signaling pathway | 39/961 | 171/8465 | 1.29e-05 | 3.32e-04 | 2.12e-04 | 39 |
| hsa0431041 | Lung | MIAC | Wnt signaling pathway | 21/507 | 171/8465 | 1.30e-03 | 1.40e-02 | 1.01e-02 | 21 |
| hsa0431051 | Lung | MIAC | Wnt signaling pathway | 21/507 | 171/8465 | 1.30e-03 | 1.40e-02 | 1.01e-02 | 21 |
| hsa0431014 | Prostate | BPH | Wnt signaling pathway | 50/1718 | 171/8465 | 3.11e-03 | 1.15e-02 | 7.14e-03 | 50 |
| hsa0431015 | Prostate | BPH | Wnt signaling pathway | 50/1718 | 171/8465 | 3.11e-03 | 1.15e-02 | 7.14e-03 | 50 |
| hsa0431023 | Prostate | Tumor | Wnt signaling pathway | 50/1791 | 171/8465 | 7.32e-03 | 2.37e-02 | 1.47e-02 | 50 |
| hsa0431033 | Prostate | Tumor | Wnt signaling pathway | 50/1791 | 171/8465 | 7.32e-03 | 2.37e-02 | 1.47e-02 | 50 |
| Page: 1 |
Top |
Cell-cell communication analysis |
| Identification of potential cell-cell interactions between two cell types and their ligand-receptor pairs for different disease states |
| Ligand | Receptor | LRpair | Pathway | Tissue | Disease Stage |
| Page: 1 |
Top |
Single-cell gene regulatory network inference analysis |
| Find out the significant the regulons (TFs) and the target genes of each regulon across cell types for different disease states |
| TF | Cell Type | Tissue | Disease Stage | Target Gene | RSS | Regulon Activity |
| ∗The dot plots of a searched regulon are shown for all cell subpopulations in each disease state of each tissue based on the regulon specific score inferred using pySCENIC and by calculating the average expression. |
| Page: 1 |
Top |
Somatic mutation of malignant transformation related genes |
| Annotation of somatic variants for genes involved in malignant transformation |
| Hugo Symbol | Variant Class | Variant Classification | dbSNP RS | HGVSc | HGVSp | HGVSp Short | SWISSPROT | BIOTYPE | SIFT | PolyPhen | Tumor Sample Barcode | Tissue | Histology | Sex | Age | Stage | Therapy Types | Drugs | Outcome |
| WIF1 | SNV | Missense_Mutation | c.154G>A | p.Glu52Lys | p.E52K | Q9Y5W5 | protein_coding | tolerated(0.33) | probably_damaging(0.988) | TCGA-A2-A04X-01 | Breast | breast invasive carcinoma | Female | <65 | I/II | Chemotherapy | adriamycin | SD | |
| WIF1 | SNV | Missense_Mutation | c.693N>G | p.Ile231Met | p.I231M | Q9Y5W5 | protein_coding | deleterious(0.03) | benign(0.329) | TCGA-A2-A0CU-01 | Breast | breast invasive carcinoma | Female | >=65 | I/II | Hormone Therapy | tamoxiphen | SD | |
| WIF1 | SNV | Missense_Mutation | c.227N>C | p.Arg76Thr | p.R76T | Q9Y5W5 | protein_coding | tolerated(0.07) | probably_damaging(0.99) | TCGA-A2-A0CU-01 | Breast | breast invasive carcinoma | Female | >=65 | I/II | Hormone Therapy | tamoxiphen | SD | |
| WIF1 | SNV | Missense_Mutation | novel | c.955N>C | p.Thr319Pro | p.T319P | Q9Y5W5 | protein_coding | deleterious(0.02) | benign(0.193) | TCGA-A2-A1FW-01 | Breast | breast invasive carcinoma | Female | <65 | III/IV | Chemotherapy | cytoxan | SD |
| WIF1 | SNV | Missense_Mutation | c.309N>G | p.Phe103Leu | p.F103L | Q9Y5W5 | protein_coding | deleterious(0) | probably_damaging(0.988) | TCGA-AC-A23H-01 | Breast | breast invasive carcinoma | Female | >=65 | I/II | Unknown | Unknown | PD | |
| WIF1 | SNV | Missense_Mutation | novel | c.955A>C | p.Thr319Pro | p.T319P | Q9Y5W5 | protein_coding | deleterious(0.02) | benign(0.193) | TCGA-C8-A12X-01 | Breast | breast invasive carcinoma | Female | <65 | I/II | Unknown | Unknown | SD |
| WIF1 | insertion | Nonsense_Mutation | novel | c.1094_1095insTGGATCCTTATAGT | p.Lys365AsnfsTer5 | p.K365Nfs*5 | Q9Y5W5 | protein_coding | TCGA-BH-A0BD-01 | Breast | breast invasive carcinoma | Female | <65 | I/II | Chemotherapy | doxorubicin | SD | ||
| WIF1 | insertion | Frame_Shift_Ins | novel | c.1092_1093insCAAAAGGATA | p.Lys365GlnfsTer13 | p.K365Qfs*13 | Q9Y5W5 | protein_coding | TCGA-BH-A0BD-01 | Breast | breast invasive carcinoma | Female | <65 | I/II | Chemotherapy | doxorubicin | SD | ||
| WIF1 | deletion | Frame_Shift_Del | novel | c.1030delN | p.Ser344AlafsTer6 | p.S344Afs*6 | Q9Y5W5 | protein_coding | TCGA-EW-A2FV-01 | Breast | breast invasive carcinoma | Female | <65 | III/IV | Chemotherapy | docetaxel | SD | ||
| WIF1 | SNV | Missense_Mutation | novel | c.241N>T | p.Pro81Ser | p.P81S | Q9Y5W5 | protein_coding | deleterious(0) | probably_damaging(0.997) | TCGA-2W-A8YY-01 | Cervix | cervical & endocervical cancer | Female | <65 | I/II | Chemotherapy | cisplatin | CR |
| Page: 1 2 3 4 5 6 7 |
Top |
Related drugs of malignant transformation related genes |
| Identification of chemicals and drugs interact with genes involved in malignant transfromation |
| (DGIdb 4.0) |
| Entrez ID | Symbol | Category | Interaction Types | Drug Claim Name | Drug Name | PMIDs |
| 11197 | WIF1 | DRUGGABLE GENOME, CLINICALLY ACTIONABLE, CELL SURFACE | Platinum compounds | 24980784 |
| Page: 1 |

Copyright 2023-Present -The University of Texas Health Science Center at Houston |