
|
|||||
|
 | |
| |
| |
| |
| |
| |
|
Gene: WHAMM |
Gene summary for WHAMM |
| Gene information | Species | Human | Gene symbol | WHAMM | Gene ID | 123720 |
| Gene name | WASP homolog associated with actin, golgi membranes and microtubules | |
| Gene Alias | WHAMM1 | |
| Cytomap | 15q25.2 | |
| Gene Type | protein-coding | GO ID | GO:0006810 | UniProtAcc | Q8TF30 |
Top |
Malignant transformation analysis |
| Identification of the aberrant gene expression in precancerous and cancerous lesions by comparing the gene expression of stem-like cells in diseased tissues with normal stem cells |
| Entrez ID | Symbol | Replicates | Species | Organ | Tissue | Adj P-value | Log2FC | Malignancy |
| 123720 | WHAMM | LZE20T | Human | Esophagus | ESCC | 3.77e-07 | 2.34e-01 | 0.0662 |
| 123720 | WHAMM | LZE24T | Human | Esophagus | ESCC | 2.89e-12 | 3.15e-01 | 0.0596 |
| 123720 | WHAMM | P1T-E | Human | Esophagus | ESCC | 1.07e-16 | 5.27e-01 | 0.0875 |
| 123720 | WHAMM | P2T-E | Human | Esophagus | ESCC | 9.79e-20 | 4.06e-01 | 0.1177 |
| 123720 | WHAMM | P4T-E | Human | Esophagus | ESCC | 4.60e-29 | 6.29e-01 | 0.1323 |
| 123720 | WHAMM | P5T-E | Human | Esophagus | ESCC | 1.28e-09 | 1.55e-01 | 0.1327 |
| 123720 | WHAMM | P8T-E | Human | Esophagus | ESCC | 1.27e-16 | 3.23e-01 | 0.0889 |
| 123720 | WHAMM | P9T-E | Human | Esophagus | ESCC | 7.05e-16 | 3.72e-01 | 0.1131 |
| 123720 | WHAMM | P10T-E | Human | Esophagus | ESCC | 1.50e-12 | 2.70e-01 | 0.116 |
| 123720 | WHAMM | P11T-E | Human | Esophagus | ESCC | 1.96e-14 | 4.57e-01 | 0.1426 |
| 123720 | WHAMM | P12T-E | Human | Esophagus | ESCC | 1.02e-24 | 4.90e-01 | 0.1122 |
| 123720 | WHAMM | P15T-E | Human | Esophagus | ESCC | 1.98e-25 | 5.17e-01 | 0.1149 |
| 123720 | WHAMM | P16T-E | Human | Esophagus | ESCC | 4.58e-22 | 4.50e-01 | 0.1153 |
| 123720 | WHAMM | P19T-E | Human | Esophagus | ESCC | 1.01e-03 | 2.25e-01 | 0.1662 |
| 123720 | WHAMM | P20T-E | Human | Esophagus | ESCC | 2.96e-16 | 4.01e-01 | 0.1124 |
| 123720 | WHAMM | P21T-E | Human | Esophagus | ESCC | 3.41e-07 | 1.89e-01 | 0.1617 |
| 123720 | WHAMM | P22T-E | Human | Esophagus | ESCC | 6.86e-27 | 3.21e-01 | 0.1236 |
| 123720 | WHAMM | P23T-E | Human | Esophagus | ESCC | 8.79e-25 | 6.81e-01 | 0.108 |
| 123720 | WHAMM | P24T-E | Human | Esophagus | ESCC | 1.36e-13 | 1.53e-01 | 0.1287 |
| 123720 | WHAMM | P26T-E | Human | Esophagus | ESCC | 9.94e-22 | 4.45e-01 | 0.1276 |
| Page: 1 2 3 4 5 |
| Tissue | Expression Dynamics | Abbreviation |
| Esophagus |  | ESCC: Esophageal squamous cell carcinoma |
| HGIN: High-grade intraepithelial neoplasias | ||
| LGIN: Low-grade intraepithelial neoplasias | ||
| Liver |  | HCC: Hepatocellular carcinoma |
| NAFLD: Non-alcoholic fatty liver disease | ||
| Oral Cavity | 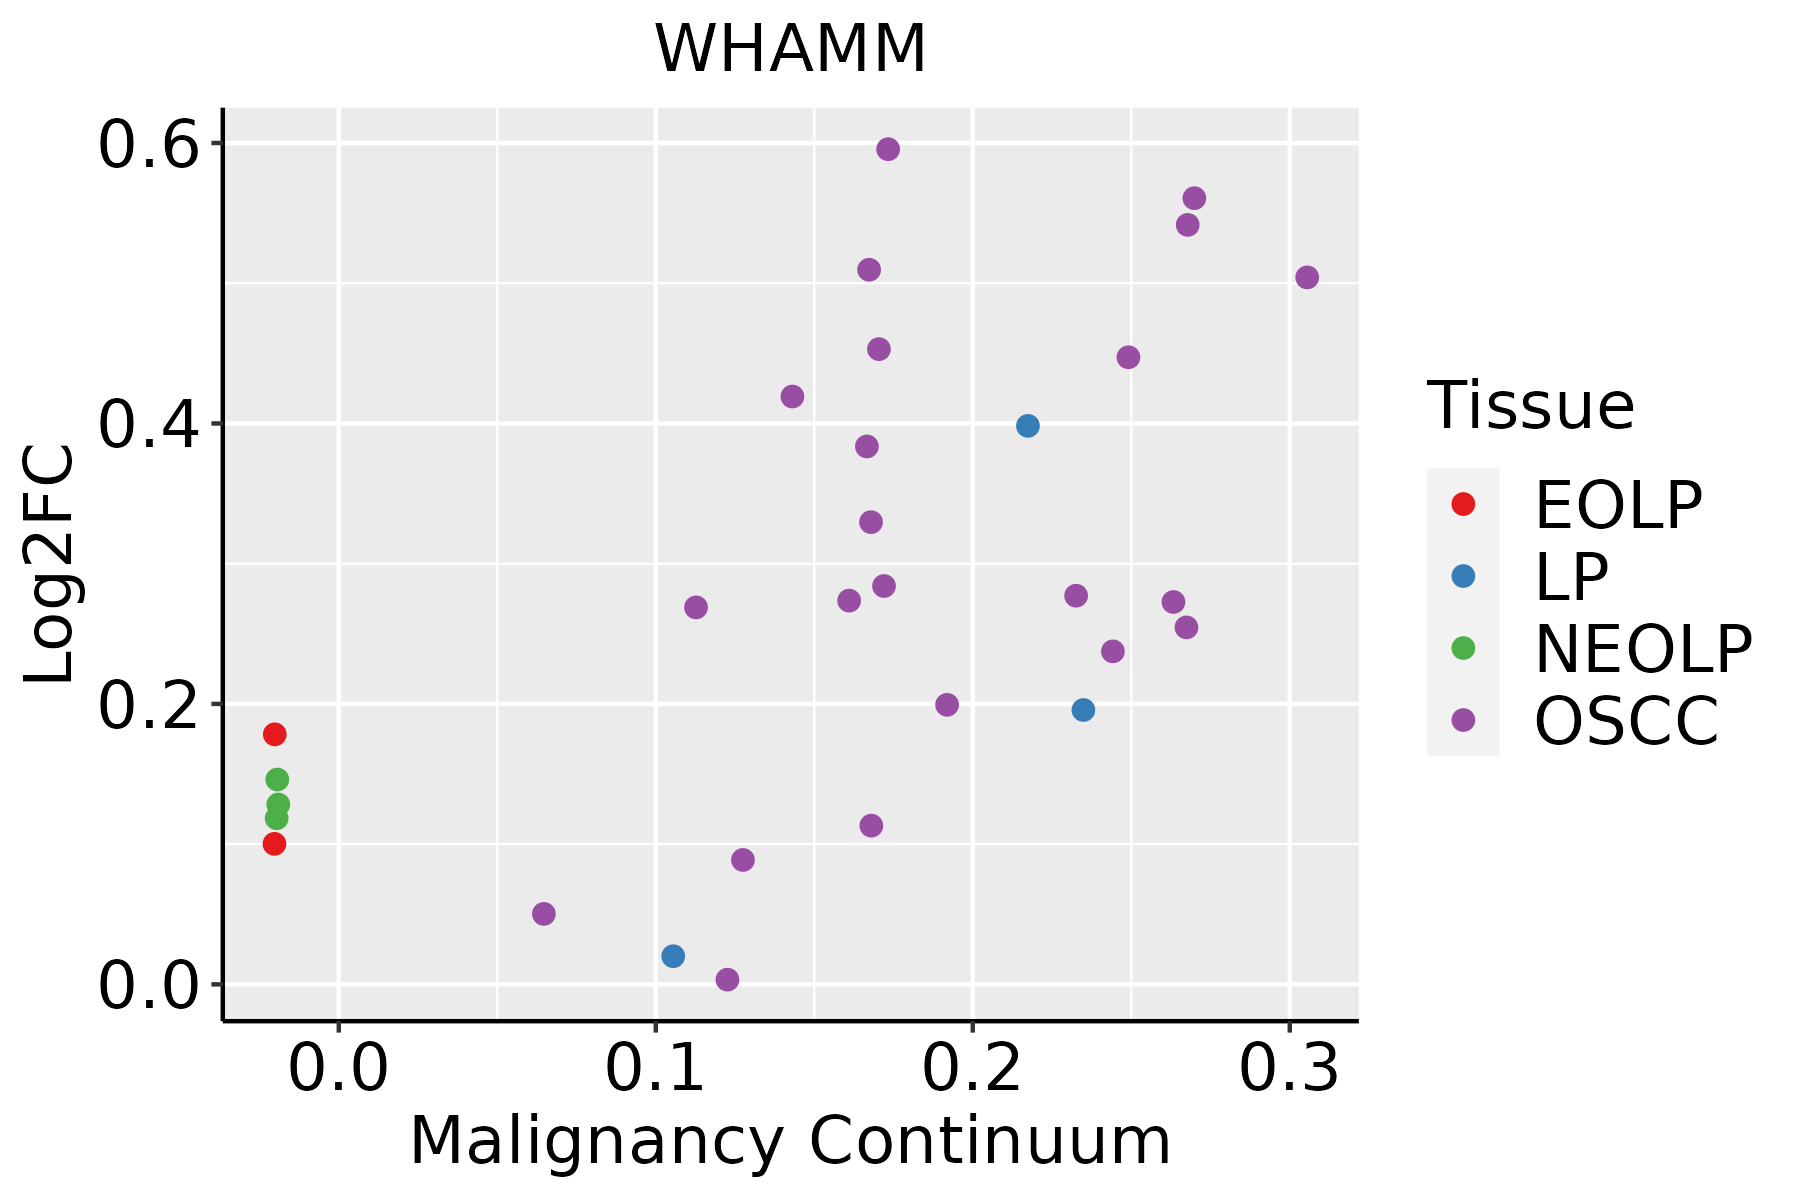 | EOLP: Erosive Oral lichen planus |
| LP: leukoplakia | ||
| NEOLP: Non-erosive oral lichen planus | ||
| OSCC: Oral squamous cell carcinoma | ||
| Thyroid | 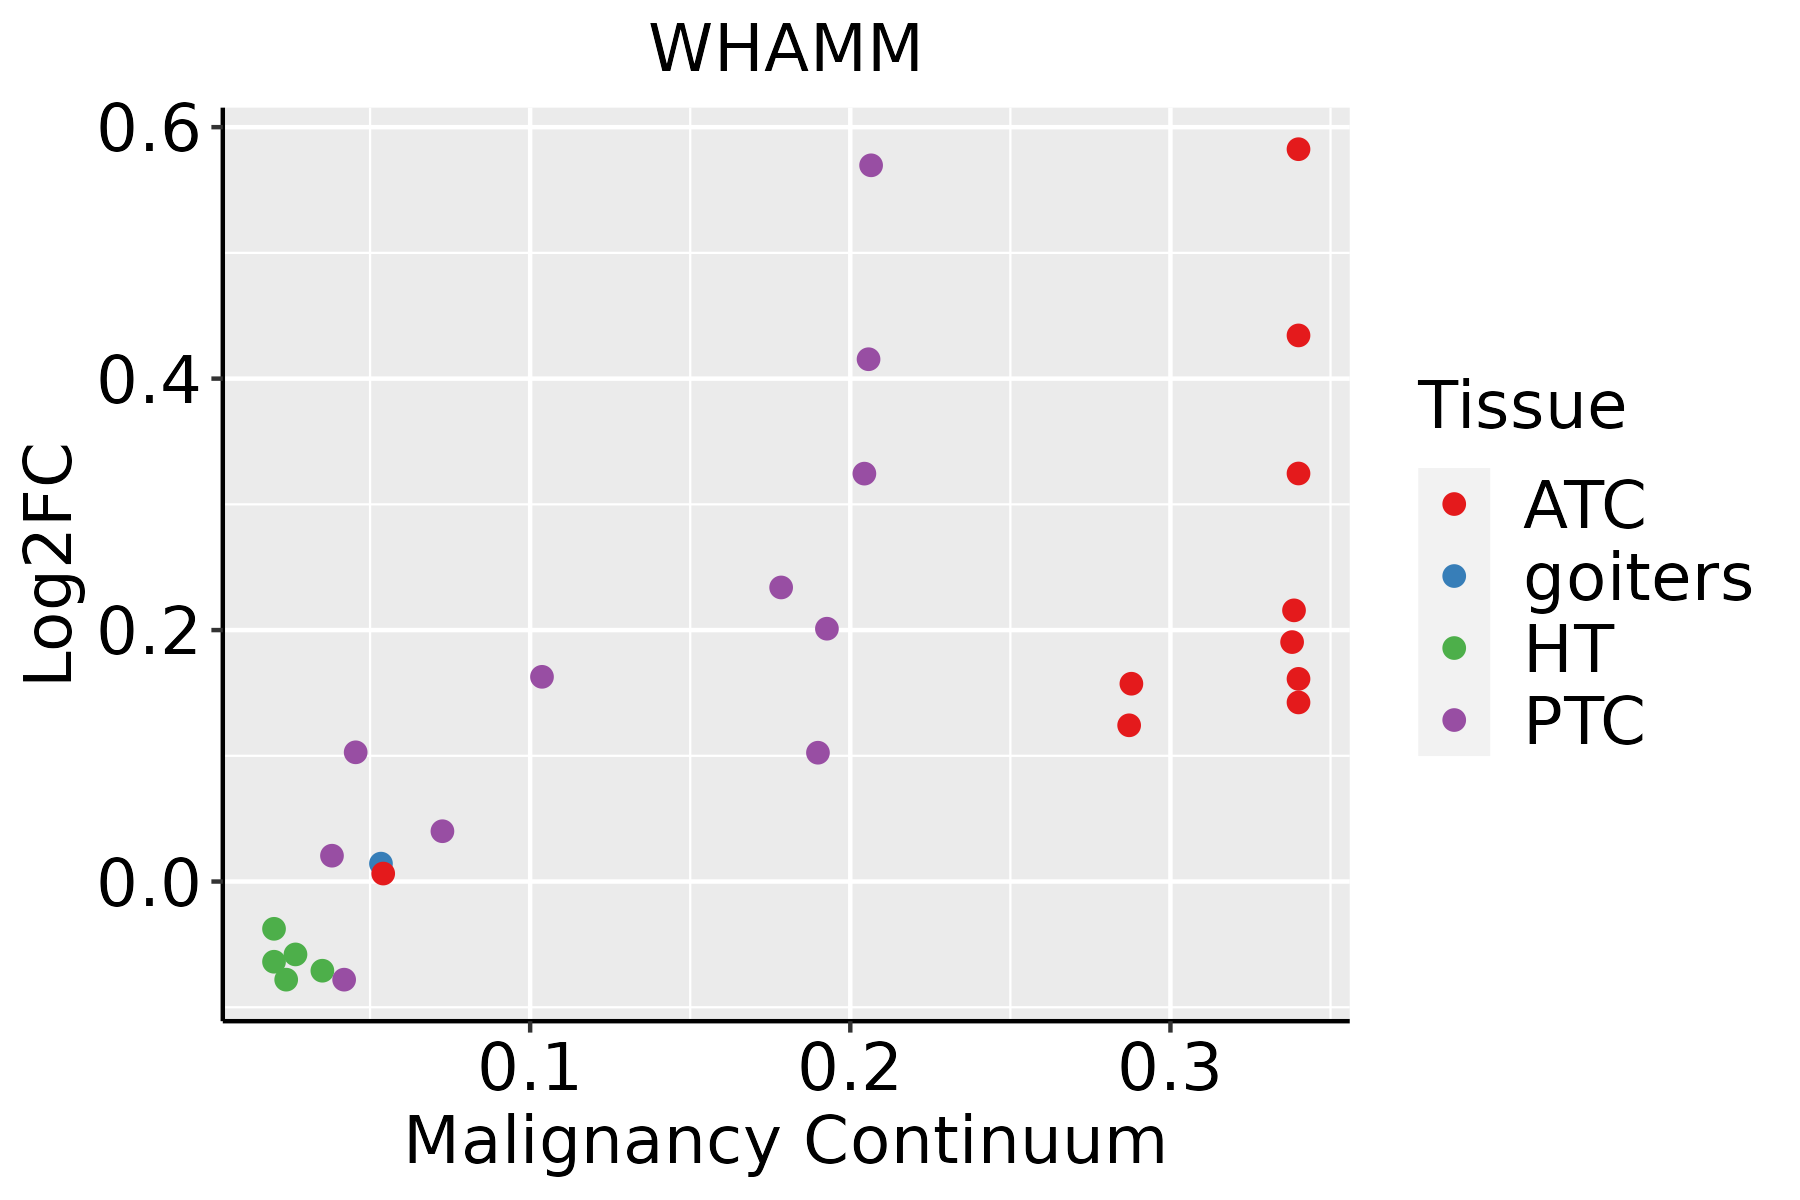 | ATC: Anaplastic thyroid cancer |
| HT: Hashimoto's thyroiditis | ||
| PTC: Papillary thyroid cancer |
| ∗log2FC in expression of this searched gene in stem-like cells from each diseased tissue sample relative to stem-like cells in normal samples in each tissue plotted against the malignancy continuum. Samples are colored based on if they are from different disease stage. |
Top |
Malignant transformation related pathway analysis |
| Find out the enriched GO biological processes and KEGG pathways involved in transition from healthy to precancer to cancer |
| Tissue | Disease Stage | Enriched GO biological Processes |
| Colorectum | AD |  |
| Colorectum | SER |  |
| Colorectum | MSS |  |
| Colorectum | MSI-H |  |
| Colorectum | FAP |  |
| ∗Top 15 enriched GO BP terms are showed in the bar plot of each disease state in each tissue. Each row represents a significant GO biological process which is colored according to the -log10(p.adjust). |
| Page: 1 2 3 4 5 6 7 8 9 |
| GO ID | Tissue | Disease Stage | Description | Gene Ratio | Bg Ratio | pvalue | p.adjust | Count |
| GO:004819318 | Esophagus | ESCC | Golgi vesicle transport | 231/8552 | 296/18723 | 1.82e-30 | 9.63e-28 | 231 |
| GO:0043254111 | Esophagus | ESCC | regulation of protein-containing complex assembly | 278/8552 | 428/18723 | 3.81e-16 | 2.77e-14 | 278 |
| GO:000688815 | Esophagus | ESCC | endoplasmic reticulum to Golgi vesicle-mediated transport | 102/8552 | 130/18723 | 1.73e-14 | 9.22e-13 | 102 |
| GO:0031334111 | Esophagus | ESCC | positive regulation of protein-containing complex assembly | 166/8552 | 237/18723 | 2.06e-14 | 1.07e-12 | 166 |
| GO:1902905111 | Esophagus | ESCC | positive regulation of supramolecular fiber organization | 142/8552 | 209/18723 | 5.51e-11 | 1.76e-09 | 142 |
| GO:1902903111 | Esophagus | ESCC | regulation of supramolecular fiber organization | 237/8552 | 383/18723 | 9.06e-11 | 2.75e-09 | 237 |
| GO:0150115110 | Esophagus | ESCC | cell-substrate junction organization | 77/8552 | 101/18723 | 3.46e-10 | 9.57e-09 | 77 |
| GO:000704418 | Esophagus | ESCC | cell-substrate junction assembly | 73/8552 | 95/18723 | 5.27e-10 | 1.35e-08 | 73 |
| GO:005149520 | Esophagus | ESCC | positive regulation of cytoskeleton organization | 147/8552 | 226/18723 | 2.93e-09 | 6.38e-08 | 147 |
| GO:003158919 | Esophagus | ESCC | cell-substrate adhesion | 221/8552 | 363/18723 | 3.06e-09 | 6.62e-08 | 221 |
| GO:0051258111 | Esophagus | ESCC | protein polymerization | 183/8552 | 297/18723 | 1.94e-08 | 3.75e-07 | 183 |
| GO:000701527 | Esophagus | ESCC | actin filament organization | 259/8552 | 442/18723 | 2.37e-08 | 4.50e-07 | 259 |
| GO:0032273111 | Esophagus | ESCC | positive regulation of protein polymerization | 95/8552 | 138/18723 | 2.97e-08 | 5.57e-07 | 95 |
| GO:004804116 | Esophagus | ESCC | focal adhesion assembly | 65/8552 | 87/18723 | 3.28e-08 | 6.08e-07 | 65 |
| GO:003253520 | Esophagus | ESCC | regulation of cellular component size | 227/8552 | 383/18723 | 4.77e-08 | 8.60e-07 | 227 |
| GO:0032970111 | Esophagus | ESCC | regulation of actin filament-based process | 231/8552 | 397/18723 | 2.91e-07 | 4.20e-06 | 231 |
| GO:0032956111 | Esophagus | ESCC | regulation of actin cytoskeleton organization | 210/8552 | 358/18723 | 4.40e-07 | 6.00e-06 | 210 |
| GO:0032271111 | Esophagus | ESCC | regulation of protein polymerization | 143/8552 | 233/18723 | 9.21e-07 | 1.17e-05 | 143 |
| GO:011005327 | Esophagus | ESCC | regulation of actin filament organization | 166/8552 | 278/18723 | 1.54e-06 | 1.85e-05 | 166 |
| GO:000716018 | Esophagus | ESCC | cell-matrix adhesion | 141/8552 | 233/18723 | 3.33e-06 | 3.71e-05 | 141 |
| Page: 1 2 3 4 5 6 7 8 9 10 11 12 |
| Pathway ID | Tissue | Disease Stage | Description | Gene Ratio | Bg Ratio | pvalue | p.adjust | qvalue | Count |
| hsa04530211 | Esophagus | ESCC | Tight junction | 105/4205 | 169/8465 | 6.73e-04 | 2.23e-03 | 1.14e-03 | 105 |
| hsa04530310 | Esophagus | ESCC | Tight junction | 105/4205 | 169/8465 | 6.73e-04 | 2.23e-03 | 1.14e-03 | 105 |
| hsa0453042 | Liver | HCC | Tight junction | 110/4020 | 169/8465 | 2.45e-06 | 2.28e-05 | 1.27e-05 | 110 |
| hsa0453052 | Liver | HCC | Tight junction | 110/4020 | 169/8465 | 2.45e-06 | 2.28e-05 | 1.27e-05 | 110 |
| hsa0453030 | Oral cavity | OSCC | Tight junction | 102/3704 | 169/8465 | 8.68e-06 | 3.93e-05 | 2.00e-05 | 102 |
| hsa04530114 | Oral cavity | OSCC | Tight junction | 102/3704 | 169/8465 | 8.68e-06 | 3.93e-05 | 2.00e-05 | 102 |
| hsa04530210 | Oral cavity | EOLP | Tight junction | 39/1218 | 169/8465 | 1.52e-03 | 5.34e-03 | 3.15e-03 | 39 |
| hsa0453038 | Oral cavity | EOLP | Tight junction | 39/1218 | 169/8465 | 1.52e-03 | 5.34e-03 | 3.15e-03 | 39 |
| hsa0453045 | Oral cavity | NEOLP | Tight junction | 39/1112 | 169/8465 | 2.50e-04 | 1.62e-03 | 1.02e-03 | 39 |
| hsa0453055 | Oral cavity | NEOLP | Tight junction | 39/1112 | 169/8465 | 2.50e-04 | 1.62e-03 | 1.02e-03 | 39 |
| Page: 1 |
Top |
Cell-cell communication analysis |
| Identification of potential cell-cell interactions between two cell types and their ligand-receptor pairs for different disease states |
| Ligand | Receptor | LRpair | Pathway | Tissue | Disease Stage |
| Page: 1 |
Top |
Single-cell gene regulatory network inference analysis |
| Find out the significant the regulons (TFs) and the target genes of each regulon across cell types for different disease states |
| TF | Cell Type | Tissue | Disease Stage | Target Gene | RSS | Regulon Activity |
| ∗The dot plots of a searched regulon are shown for all cell subpopulations in each disease state of each tissue based on the regulon specific score inferred using pySCENIC and by calculating the average expression. |
| Page: 1 |
Top |
Somatic mutation of malignant transformation related genes |
| Annotation of somatic variants for genes involved in malignant transformation |
| Hugo Symbol | Variant Class | Variant Classification | dbSNP RS | HGVSc | HGVSp | HGVSp Short | SWISSPROT | BIOTYPE | SIFT | PolyPhen | Tumor Sample Barcode | Tissue | Histology | Sex | Age | Stage | Therapy Types | Drugs | Outcome |
| WHAMM | SNV | Missense_Mutation | novel | c.1342N>C | p.Val448Leu | p.V448L | Q8TF30 | protein_coding | tolerated(0.53) | benign(0.003) | TCGA-A2-A3XY-01 | Breast | breast invasive carcinoma | Female | <65 | I/II | Chemotherapy | adriamycin | PD |
| WHAMM | SNV | Missense_Mutation | novel | c.1760A>C | p.His587Pro | p.H587P | Q8TF30 | protein_coding | tolerated(0.28) | possibly_damaging(0.656) | TCGA-A8-A0A6-01 | Breast | breast invasive carcinoma | Female | <65 | III/IV | Chemotherapy | epirubicin | CR |
| WHAMM | SNV | Missense_Mutation | novel | c.886C>G | p.Gln296Glu | p.Q296E | Q8TF30 | protein_coding | deleterious(0) | probably_damaging(0.991) | TCGA-AC-A6IX-01 | Breast | breast invasive carcinoma | Female | <65 | III/IV | Unknown | Unknown | SD |
| WHAMM | SNV | Missense_Mutation | novel | c.1587N>C | p.Glu529Asp | p.E529D | Q8TF30 | protein_coding | deleterious(0.03) | probably_damaging(0.996) | TCGA-BH-A0BA-01 | Breast | breast invasive carcinoma | Female | <65 | III/IV | Chemotherapy | cytoxan | SD |
| WHAMM | SNV | Missense_Mutation | novel | c.1587N>C | p.Glu529Asp | p.E529D | Q8TF30 | protein_coding | deleterious(0.03) | probably_damaging(0.996) | TCGA-BH-A0GY-01 | Breast | breast invasive carcinoma | Female | >=65 | I/II | Chemotherapy | cyotxan | SD |
| WHAMM | SNV | Missense_Mutation | rs758570876 | c.2215N>G | p.Ile739Val | p.I739V | Q8TF30 | protein_coding | tolerated(1) | benign(0) | TCGA-E2-A1L7-01 | Breast | breast invasive carcinoma | Female | <65 | III/IV | Chemotherapy | cyclophosphamide | PD |
| WHAMM | insertion | Frame_Shift_Ins | novel | c.1585_1586insC | p.Glu529AlafsTer18 | p.E529Afs*18 | Q8TF30 | protein_coding | TCGA-BH-A0BA-01 | Breast | breast invasive carcinoma | Female | <65 | III/IV | Chemotherapy | cytoxan | SD | ||
| WHAMM | insertion | Frame_Shift_Ins | novel | c.1585_1586insC | p.Glu529AlafsTer18 | p.E529Afs*18 | Q8TF30 | protein_coding | TCGA-BH-A0GY-01 | Breast | breast invasive carcinoma | Female | >=65 | I/II | Chemotherapy | cyotxan | SD | ||
| WHAMM | deletion | Frame_Shift_Del | novel | c.1718delN | p.Gln573ArgfsTer13 | p.Q573Rfs*13 | Q8TF30 | protein_coding | TCGA-D8-A27V-01 | Breast | breast invasive carcinoma | Female | <65 | I/II | Hormone Therapy | tamoxiphen | SD | ||
| WHAMM | SNV | Missense_Mutation | rs190194464 | c.700N>A | p.Val234Met | p.V234M | Q8TF30 | protein_coding | tolerated(0.53) | benign(0.034) | TCGA-2W-A8YY-01 | Cervix | cervical & endocervical cancer | Female | <65 | I/II | Chemotherapy | cisplatin | CR |
| Page: 1 2 3 4 5 6 |
Top |
Related drugs of malignant transformation related genes |
| Identification of chemicals and drugs interact with genes involved in malignant transfromation |
| (DGIdb 4.0) |
| Entrez ID | Symbol | Category | Interaction Types | Drug Claim Name | Drug Name | PMIDs |
| Page: 1 |

Copyright 2023-Present -The University of Texas Health Science Center at Houston |