
|
|||||
|
 | |
| |
| |
| |
| |
| |
|
Gene: WFS1 |
Gene summary for WFS1 |
| Gene information | Species | Human | Gene symbol | WFS1 | Gene ID | 7466 |
| Gene name | wolframin ER transmembrane glycoprotein | |
| Gene Alias | CTRCT41 | |
| Cytomap | 4p16.1 | |
| Gene Type | protein-coding | GO ID | GO:0000122 | UniProtAcc | A0A0S2Z4V6 |
Top |
Malignant transformation analysis |
| Identification of the aberrant gene expression in precancerous and cancerous lesions by comparing the gene expression of stem-like cells in diseased tissues with normal stem cells |
| Entrez ID | Symbol | Replicates | Species | Organ | Tissue | Adj P-value | Log2FC | Malignancy |
| 7466 | WFS1 | HCC1_Meng | Human | Liver | HCC | 6.07e-23 | 4.68e-02 | 0.0246 |
| 7466 | WFS1 | HCC2_Meng | Human | Liver | HCC | 1.55e-18 | 1.78e-01 | 0.0107 |
| 7466 | WFS1 | HCC1 | Human | Liver | HCC | 1.66e-11 | 3.93e+00 | 0.5336 |
| 7466 | WFS1 | HCC2 | Human | Liver | HCC | 4.52e-16 | 3.72e+00 | 0.5341 |
| 7466 | WFS1 | S014 | Human | Liver | HCC | 1.96e-14 | 4.64e-01 | 0.2254 |
| 7466 | WFS1 | S015 | Human | Liver | HCC | 1.21e-14 | 5.59e-01 | 0.2375 |
| 7466 | WFS1 | S016 | Human | Liver | HCC | 3.62e-18 | 4.88e-01 | 0.2243 |
| 7466 | WFS1 | S027 | Human | Liver | HCC | 1.19e-04 | 3.47e-01 | 0.2446 |
| 7466 | WFS1 | S028 | Human | Liver | HCC | 1.28e-12 | 4.05e-01 | 0.2503 |
| 7466 | WFS1 | S029 | Human | Liver | HCC | 1.02e-09 | 4.03e-01 | 0.2581 |
| 7466 | WFS1 | C04 | Human | Oral cavity | OSCC | 6.21e-03 | 2.05e-01 | 0.2633 |
| 7466 | WFS1 | C21 | Human | Oral cavity | OSCC | 3.59e-15 | 3.58e-01 | 0.2678 |
| 7466 | WFS1 | C30 | Human | Oral cavity | OSCC | 4.77e-19 | 5.97e-01 | 0.3055 |
| 7466 | WFS1 | C51 | Human | Oral cavity | OSCC | 2.17e-16 | 5.30e-01 | 0.2674 |
| 7466 | WFS1 | C06 | Human | Oral cavity | OSCC | 1.27e-02 | 3.33e-01 | 0.2699 |
| 7466 | WFS1 | C08 | Human | Oral cavity | OSCC | 3.35e-03 | 1.17e-01 | 0.1919 |
| 7466 | WFS1 | C09 | Human | Oral cavity | OSCC | 9.69e-23 | 6.63e-01 | 0.1431 |
| 7466 | WFS1 | LP15 | Human | Oral cavity | LP | 9.93e-03 | 4.01e-01 | 0.2174 |
| 7466 | WFS1 | SYSMH1 | Human | Oral cavity | OSCC | 4.67e-03 | 7.32e-02 | 0.1127 |
| 7466 | WFS1 | SYSMH2 | Human | Oral cavity | OSCC | 1.16e-02 | 8.06e-02 | 0.2326 |
| Page: 1 2 |
| Tissue | Expression Dynamics | Abbreviation |
| Liver | 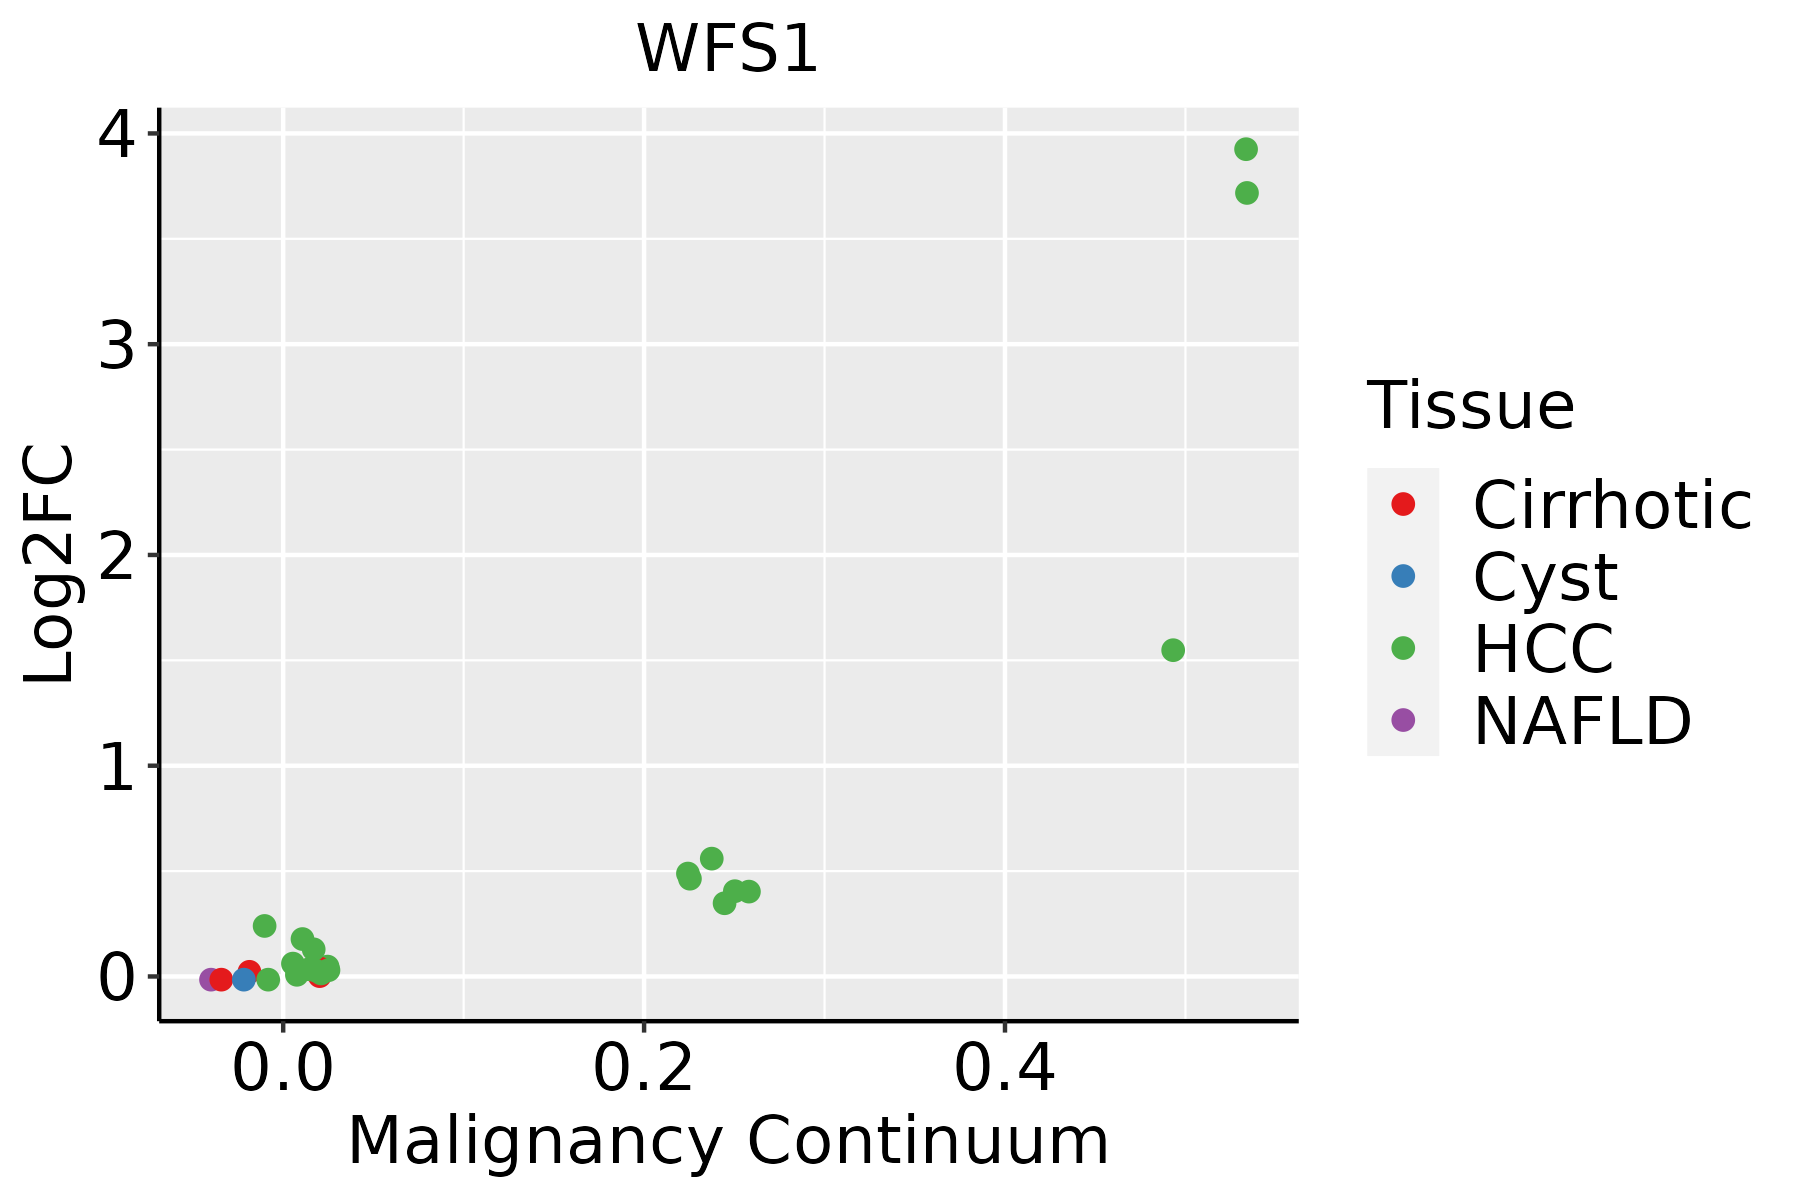 | HCC: Hepatocellular carcinoma |
| NAFLD: Non-alcoholic fatty liver disease | ||
| Oral Cavity | 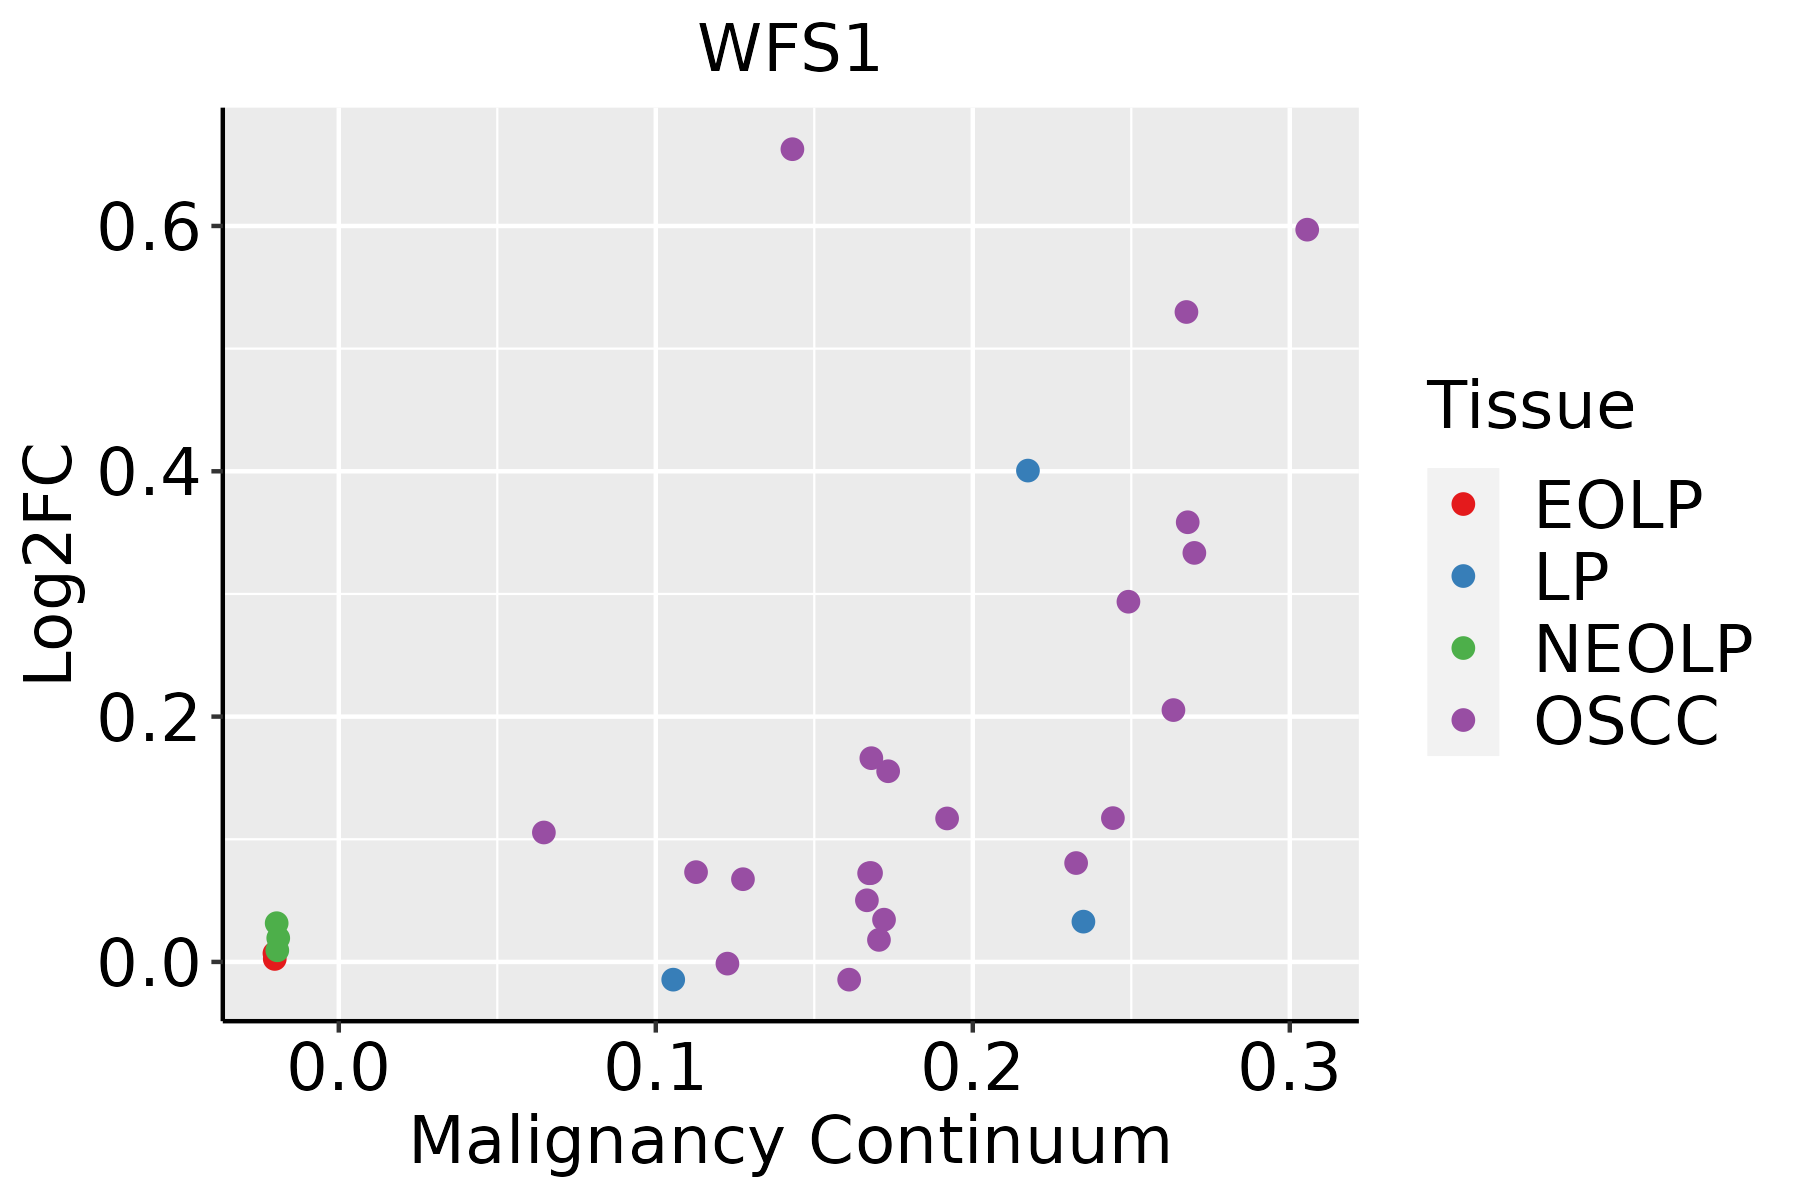 | EOLP: Erosive Oral lichen planus |
| LP: leukoplakia | ||
| NEOLP: Non-erosive oral lichen planus | ||
| OSCC: Oral squamous cell carcinoma |
| ∗log2FC in expression of this searched gene in stem-like cells from each diseased tissue sample relative to stem-like cells in normal samples in each tissue plotted against the malignancy continuum. Samples are colored based on if they are from different disease stage. |
Top |
Malignant transformation related pathway analysis |
| Find out the enriched GO biological processes and KEGG pathways involved in transition from healthy to precancer to cancer |
| Tissue | Disease Stage | Enriched GO biological Processes |
| Colorectum | AD |  |
| Colorectum | SER |  |
| Colorectum | MSS |  |
| Colorectum | MSI-H |  |
| Colorectum | FAP |  |
| ∗Top 15 enriched GO BP terms are showed in the bar plot of each disease state in each tissue. Each row represents a significant GO biological process which is colored according to the -log10(p.adjust). |
| Page: 1 2 3 4 5 6 7 8 9 |
| GO ID | Tissue | Disease Stage | Description | Gene Ratio | Bg Ratio | pvalue | p.adjust | Count |
| GO:001049822 | Liver | HCC | proteasomal protein catabolic process | 351/7958 | 490/18723 | 6.92e-40 | 1.46e-36 | 351 |
| GO:004316122 | Liver | HCC | proteasome-mediated ubiquitin-dependent protein catabolic process | 299/7958 | 412/18723 | 7.82e-36 | 8.27e-33 | 299 |
| GO:003497612 | Liver | HCC | response to endoplasmic reticulum stress | 189/7958 | 256/18723 | 1.43e-24 | 4.06e-22 | 189 |
| GO:003164722 | Liver | HCC | regulation of protein stability | 211/7958 | 298/18723 | 2.29e-23 | 5.01e-21 | 211 |
| GO:000645712 | Liver | HCC | protein folding | 160/7958 | 212/18723 | 1.07e-22 | 1.88e-20 | 160 |
| GO:003596612 | Liver | HCC | response to topologically incorrect protein | 123/7958 | 159/18723 | 2.60e-19 | 3.44e-17 | 123 |
| GO:005082122 | Liver | HCC | protein stabilization | 139/7958 | 191/18723 | 1.61e-17 | 1.71e-15 | 139 |
| GO:003650311 | Liver | HCC | ERAD pathway | 88/7958 | 107/18723 | 2.87e-17 | 2.85e-15 | 88 |
| GO:190332022 | Liver | HCC | regulation of protein modification by small protein conjugation or removal | 167/7958 | 242/18723 | 4.99e-17 | 4.72e-15 | 167 |
| GO:200123322 | Liver | HCC | regulation of apoptotic signaling pathway | 226/7958 | 356/18723 | 7.26e-16 | 5.68e-14 | 226 |
| GO:00304331 | Liver | HCC | ubiquitin-dependent ERAD pathway | 72/7958 | 85/18723 | 9.78e-16 | 7.47e-14 | 72 |
| GO:000698612 | Liver | HCC | response to unfolded protein | 103/7958 | 137/18723 | 6.50e-15 | 4.48e-13 | 103 |
| GO:003596712 | Liver | HCC | cellular response to topologically incorrect protein | 89/7958 | 116/18723 | 5.61e-14 | 3.39e-12 | 89 |
| GO:003139622 | Liver | HCC | regulation of protein ubiquitination | 142/7958 | 210/18723 | 1.39e-13 | 7.81e-12 | 142 |
| GO:009719322 | Liver | HCC | intrinsic apoptotic signaling pathway | 184/7958 | 288/18723 | 1.50e-13 | 8.32e-12 | 184 |
| GO:200123412 | Liver | HCC | negative regulation of apoptotic signaling pathway | 145/7958 | 224/18723 | 1.33e-11 | 5.36e-10 | 145 |
| GO:003462012 | Liver | HCC | cellular response to unfolded protein | 71/7958 | 96/18723 | 3.70e-10 | 1.22e-08 | 71 |
| GO:200124212 | Liver | HCC | regulation of intrinsic apoptotic signaling pathway | 109/7958 | 164/18723 | 4.52e-10 | 1.45e-08 | 109 |
| GO:19033221 | Liver | HCC | positive regulation of protein modification by small protein conjugation or removal | 94/7958 | 138/18723 | 9.87e-10 | 3.01e-08 | 94 |
| GO:190589712 | Liver | HCC | regulation of response to endoplasmic reticulum stress | 62/7958 | 82/18723 | 1.06e-09 | 3.23e-08 | 62 |
| Page: 1 2 3 4 5 6 7 |
| Pathway ID | Tissue | Disease Stage | Description | Gene Ratio | Bg Ratio | pvalue | p.adjust | qvalue | Count |
| hsa0414122 | Liver | HCC | Protein processing in endoplasmic reticulum | 146/4020 | 174/8465 | 7.34e-24 | 2.46e-21 | 1.37e-21 | 146 |
| hsa0414132 | Liver | HCC | Protein processing in endoplasmic reticulum | 146/4020 | 174/8465 | 7.34e-24 | 2.46e-21 | 1.37e-21 | 146 |
| hsa0414130 | Oral cavity | OSCC | Protein processing in endoplasmic reticulum | 143/3704 | 174/8465 | 6.82e-26 | 2.28e-23 | 1.16e-23 | 143 |
| hsa04141113 | Oral cavity | OSCC | Protein processing in endoplasmic reticulum | 143/3704 | 174/8465 | 6.82e-26 | 2.28e-23 | 1.16e-23 | 143 |
| hsa04141210 | Oral cavity | LP | Protein processing in endoplasmic reticulum | 113/2418 | 174/8465 | 8.74e-24 | 5.82e-22 | 3.76e-22 | 113 |
| hsa0414138 | Oral cavity | LP | Protein processing in endoplasmic reticulum | 113/2418 | 174/8465 | 8.74e-24 | 5.82e-22 | 3.76e-22 | 113 |
| Page: 1 |
Top |
Cell-cell communication analysis |
| Identification of potential cell-cell interactions between two cell types and their ligand-receptor pairs for different disease states |
| Ligand | Receptor | LRpair | Pathway | Tissue | Disease Stage |
| Page: 1 |
Top |
Single-cell gene regulatory network inference analysis |
| Find out the significant the regulons (TFs) and the target genes of each regulon across cell types for different disease states |
| TF | Cell Type | Tissue | Disease Stage | Target Gene | RSS | Regulon Activity |
| ∗The dot plots of a searched regulon are shown for all cell subpopulations in each disease state of each tissue based on the regulon specific score inferred using pySCENIC and by calculating the average expression. |
| Page: 1 |
Top |
Somatic mutation of malignant transformation related genes |
| Annotation of somatic variants for genes involved in malignant transformation |
| Hugo Symbol | Variant Class | Variant Classification | dbSNP RS | HGVSc | HGVSp | HGVSp Short | SWISSPROT | BIOTYPE | SIFT | PolyPhen | Tumor Sample Barcode | Tissue | Histology | Sex | Age | Stage | Therapy Types | Drugs | Outcome |
| WFS1 | SNV | Missense_Mutation | novel | c.341N>T | p.Ala114Val | p.A114V | O76024 | protein_coding | deleterious(0) | probably_damaging(0.992) | TCGA-AC-A3EH-01 | Breast | breast invasive carcinoma | Female | >=65 | III/IV | Unknown | Unknown | SD |
| WFS1 | SNV | Missense_Mutation | rs752775825 | c.2581N>A | p.Val861Met | p.V861M | O76024 | protein_coding | deleterious(0.01) | probably_damaging(0.992) | TCGA-AC-A5XU-01 | Breast | breast invasive carcinoma | Female | >=65 | I/II | Hormone Therapy | letrozole | SD |
| WFS1 | SNV | Missense_Mutation | rs727503749 | c.1261N>G | p.Ile421Val | p.I421V | O76024 | protein_coding | tolerated(1) | benign(0) | TCGA-D8-A1XK-01 | Breast | breast invasive carcinoma | Female | <65 | I/II | Chemotherapy | doxorubicine+cyclophosphamide | SD |
| WFS1 | SNV | Missense_Mutation | novel | c.346G>A | p.Asp116Asn | p.D116N | O76024 | protein_coding | deleterious(0.04) | benign(0.11) | TCGA-2W-A8YY-01 | Cervix | cervical & endocervical cancer | Female | <65 | I/II | Chemotherapy | cisplatin | CR |
| WFS1 | SNV | Missense_Mutation | rs369795224 | c.977C>T | p.Ala326Val | p.A326V | O76024 | protein_coding | tolerated(0.05) | possibly_damaging(0.768) | TCGA-2W-A8YY-01 | Cervix | cervical & endocervical cancer | Female | <65 | I/II | Chemotherapy | cisplatin | CR |
| WFS1 | SNV | Missense_Mutation | novel | c.954N>G | p.Ile318Met | p.I318M | O76024 | protein_coding | tolerated(0.34) | benign(0.178) | TCGA-JW-A5VL-01 | Cervix | cervical & endocervical cancer | Female | <65 | I/II | Unknown | Unknown | SD |
| WFS1 | SNV | Missense_Mutation | rs373146435 | c.1180G>A | p.Glu394Lys | p.E394K | O76024 | protein_coding | deleterious(0.01) | probably_damaging(0.993) | TCGA-MY-A5BD-01 | Cervix | cervical & endocervical cancer | Female | <65 | I/II | Chemotherapy | cisplatin | CR |
| WFS1 | SNV | Missense_Mutation | c.184N>A | p.Glu62Lys | p.E62K | O76024 | protein_coding | tolerated(0.74) | benign(0) | TCGA-UC-A7PF-01 | Cervix | cervical & endocervical cancer | Female | <65 | I/II | Unknown | Unknown | SD | |
| WFS1 | SNV | Missense_Mutation | rs145639028 | c.376N>A | p.Ala126Thr | p.A126T | O76024 | protein_coding | deleterious(0) | probably_damaging(0.95) | TCGA-AA-3509-01 | Colorectum | colon adenocarcinoma | Female | <65 | I/II | Unknown | Unknown | SD |
| WFS1 | SNV | Missense_Mutation | novel | c.1634N>G | p.Val545Gly | p.V545G | O76024 | protein_coding | deleterious(0) | probably_damaging(0.95) | TCGA-AA-3715-01 | Colorectum | colon adenocarcinoma | Male | >=65 | I/II | Unknown | Unknown | PD |
| Page: 1 2 3 4 5 6 7 8 9 |
Top |
Related drugs of malignant transformation related genes |
| Identification of chemicals and drugs interact with genes involved in malignant transfromation |
| (DGIdb 4.0) |
| Entrez ID | Symbol | Category | Interaction Types | Drug Claim Name | Drug Name | PMIDs |
| Page: 1 |

Copyright 2023-Present -The University of Texas Health Science Center at Houston |