
|
|||||
|
 | |
| |
| |
| |
| |
| |
|
Gene: WFDC5 |
Gene summary for WFDC5 |
| Gene information | Species | Human | Gene symbol | WFDC5 | Gene ID | 149708 |
| Gene name | WAP four-disulfide core domain 5 | |
| Gene Alias | PRG5 | |
| Cytomap | 20q13.12 | |
| Gene Type | protein-coding | GO ID | GO:0002376 | UniProtAcc | Q8TCV5 |
Top |
Malignant transformation analysis |
| Identification of the aberrant gene expression in precancerous and cancerous lesions by comparing the gene expression of stem-like cells in diseased tissues with normal stem cells |
| Entrez ID | Symbol | Replicates | Species | Organ | Tissue | Adj P-value | Log2FC | Malignancy |
| 149708 | WFDC5 | P10T-E | Human | Esophagus | ESCC | 6.26e-36 | 1.11e+00 | 0.116 |
| 149708 | WFDC5 | P11T-E | Human | Esophagus | ESCC | 7.59e-04 | 3.30e-01 | 0.1426 |
| 149708 | WFDC5 | P12T-E | Human | Esophagus | ESCC | 9.31e-05 | 1.93e-01 | 0.1122 |
| 149708 | WFDC5 | P15T-E | Human | Esophagus | ESCC | 3.66e-02 | 6.98e-02 | 0.1149 |
| 149708 | WFDC5 | P21T-E | Human | Esophagus | ESCC | 1.41e-12 | 3.97e-01 | 0.1617 |
| 149708 | WFDC5 | P26T-E | Human | Esophagus | ESCC | 6.23e-29 | 4.99e-01 | 0.1276 |
| 149708 | WFDC5 | P28T-E | Human | Esophagus | ESCC | 3.62e-04 | 1.11e-01 | 0.1149 |
| 149708 | WFDC5 | P37T-E | Human | Esophagus | ESCC | 4.74e-08 | 3.94e-01 | 0.1371 |
| 149708 | WFDC5 | P44T-E | Human | Esophagus | ESCC | 1.46e-03 | 1.68e-01 | 0.1096 |
| 149708 | WFDC5 | P52T-E | Human | Esophagus | ESCC | 7.43e-03 | 1.35e-01 | 0.1555 |
| 149708 | WFDC5 | P54T-E | Human | Esophagus | ESCC | 1.78e-05 | 1.45e-01 | 0.0975 |
| 149708 | WFDC5 | P74T-E | Human | Esophagus | ESCC | 5.20e-10 | 3.61e-01 | 0.1479 |
| 149708 | WFDC5 | P91T-E | Human | Esophagus | ESCC | 7.88e-13 | 8.88e-01 | 0.1828 |
| 149708 | WFDC5 | P4_S8_cSCC | Human | Skin | cSCC | 1.67e-02 | 1.68e-01 | -0.3095 |
| 149708 | WFDC5 | cSCC_p1 | Human | Skin | cSCC | 1.68e-14 | 4.36e-01 | -0.1916 |
| 149708 | WFDC5 | cSCC_p10 | Human | Skin | cSCC | 5.90e-04 | 2.32e-01 | -0.2095 |
| 149708 | WFDC5 | cSCC_p11 | Human | Skin | cSCC | 4.40e-29 | 6.09e-01 | -0.2102 |
| 149708 | WFDC5 | cSCC_p4 | Human | Skin | cSCC | 6.81e-11 | 3.60e-01 | -0.2022 |
| 149708 | WFDC5 | cSCC_p6 | Human | Skin | cSCC | 4.86e-03 | 2.06e-01 | -0.1989 |
| 149708 | WFDC5 | cSCC_p7 | Human | Skin | cSCC | 2.71e-12 | 5.32e-01 | -0.2332 |
| Page: 1 2 |
| Tissue | Expression Dynamics | Abbreviation |
| Esophagus | 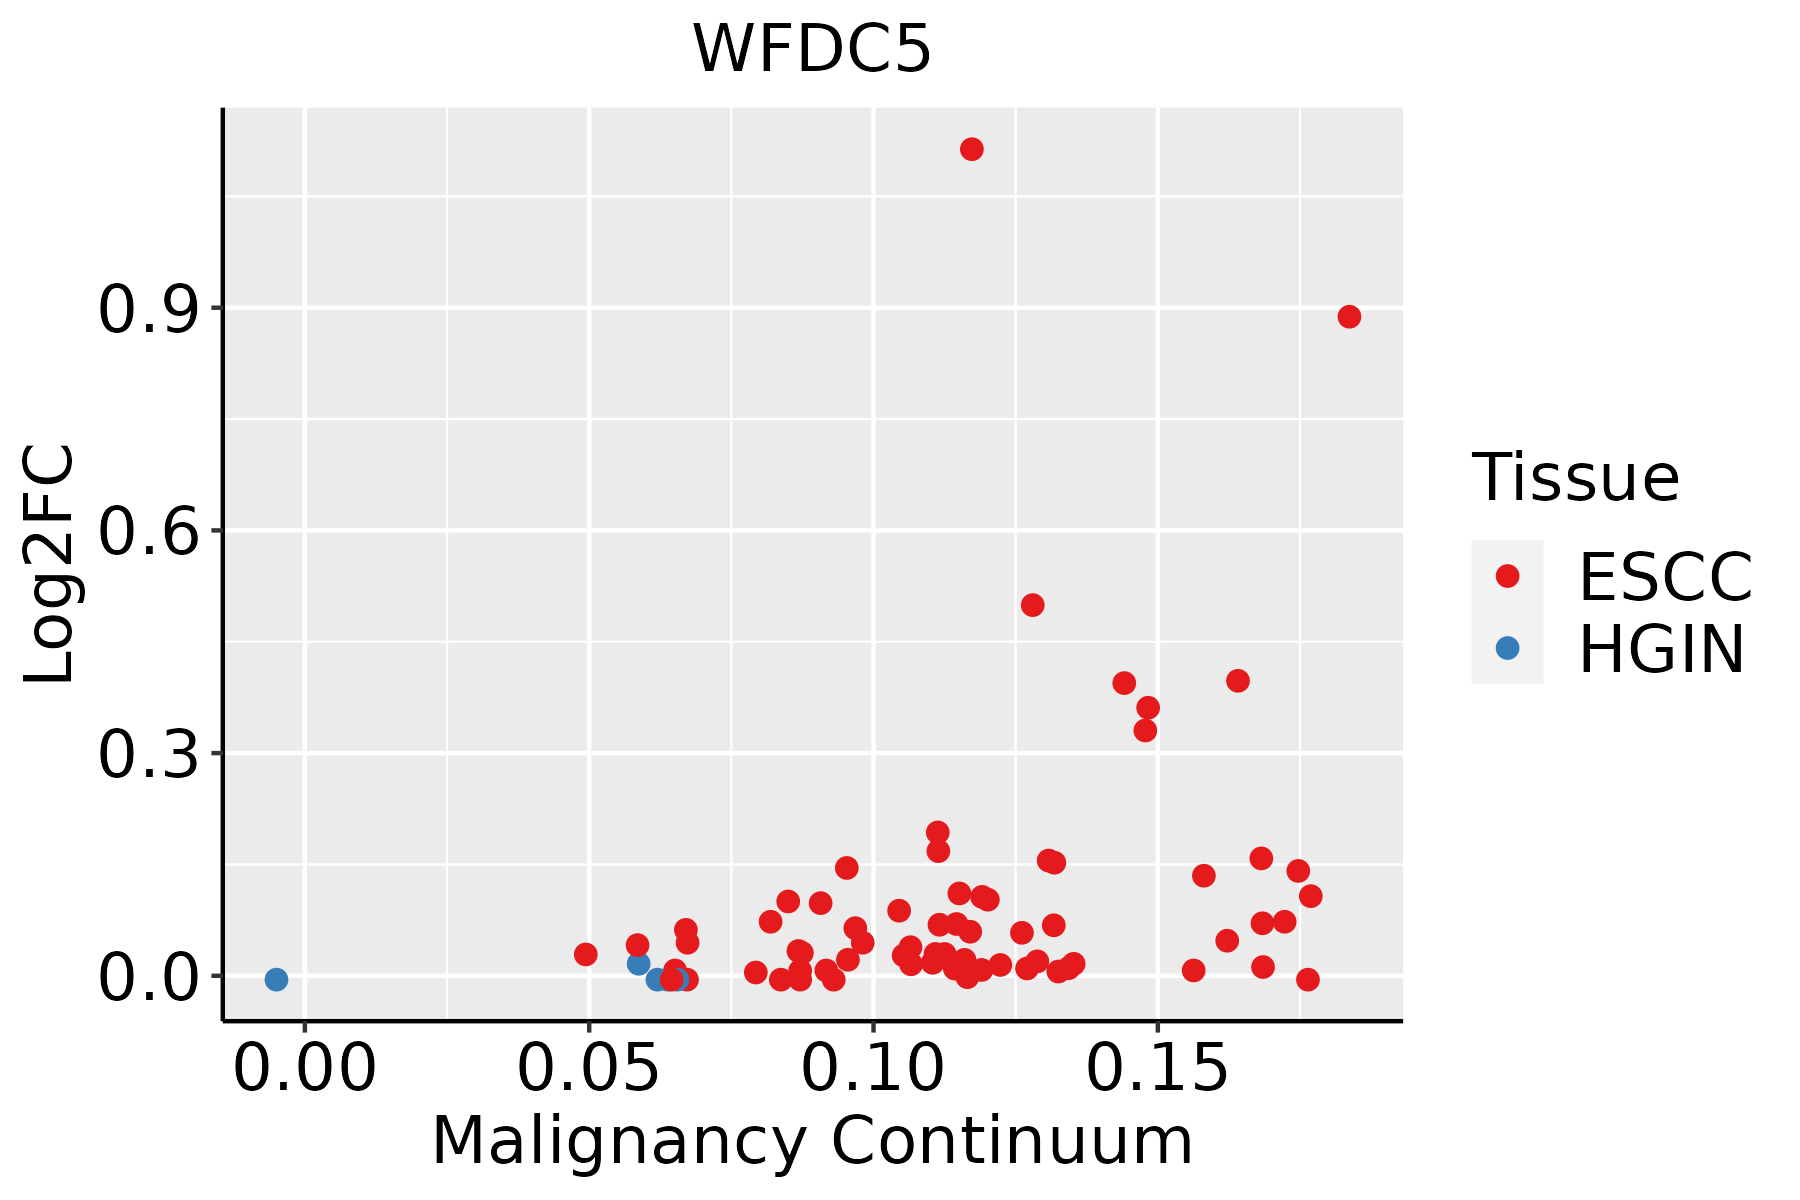 | ESCC: Esophageal squamous cell carcinoma |
| HGIN: High-grade intraepithelial neoplasias | ||
| LGIN: Low-grade intraepithelial neoplasias | ||
| Skin | 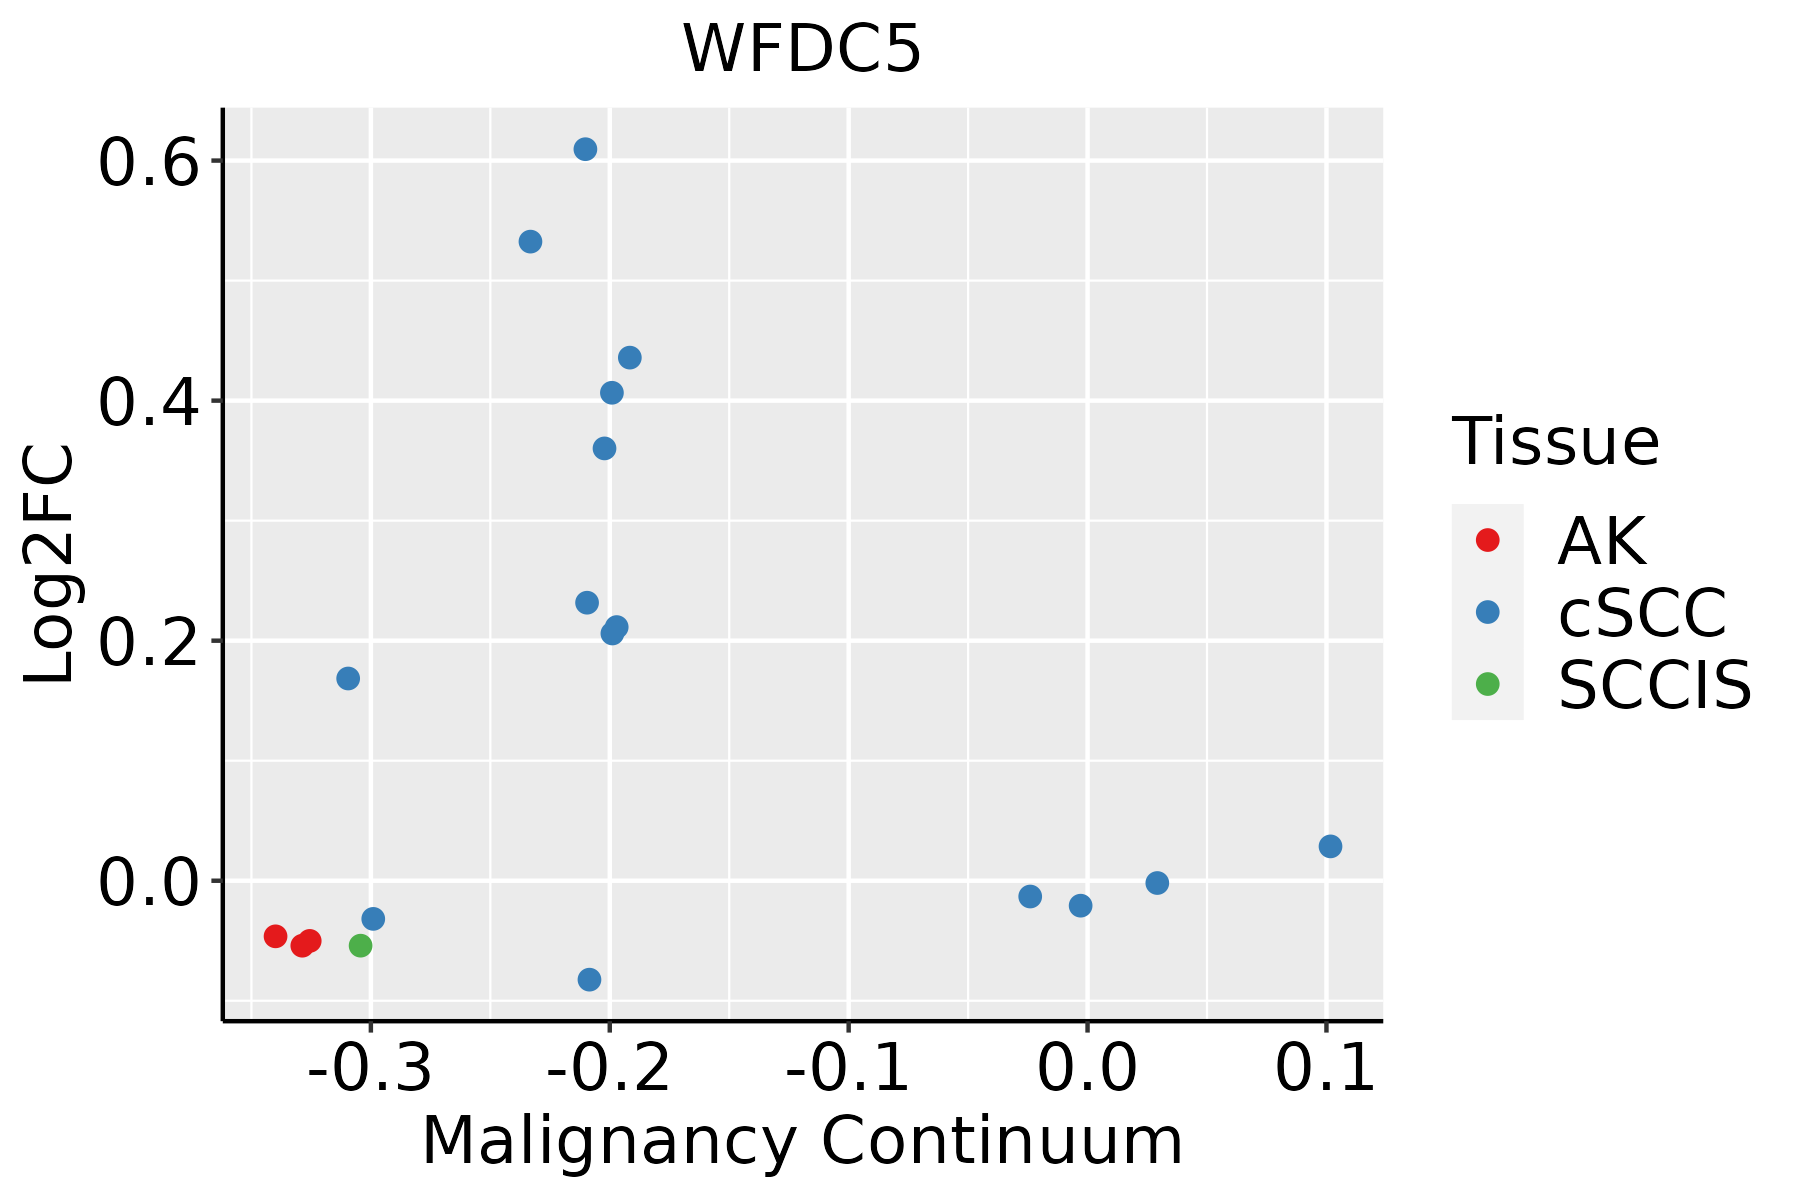 | AK: Actinic keratosis |
| cSCC: Cutaneous squamous cell carcinoma | ||
| SCCIS:squamous cell carcinoma in situ |
| ∗log2FC in expression of this searched gene in stem-like cells from each diseased tissue sample relative to stem-like cells in normal samples in each tissue plotted against the malignancy continuum. Samples are colored based on if they are from different disease stage. |
Top |
Malignant transformation related pathway analysis |
| Find out the enriched GO biological processes and KEGG pathways involved in transition from healthy to precancer to cancer |
| Tissue | Disease Stage | Enriched GO biological Processes |
| Colorectum | AD |  |
| Colorectum | SER |  |
| Colorectum | MSS |  |
| Colorectum | MSI-H |  |
| Colorectum | FAP |  |
| ∗Top 15 enriched GO BP terms are showed in the bar plot of each disease state in each tissue. Each row represents a significant GO biological process which is colored according to the -log10(p.adjust). |
| Page: 1 2 3 4 5 6 7 8 9 |
| GO ID | Tissue | Disease Stage | Description | Gene Ratio | Bg Ratio | pvalue | p.adjust | Count |
| GO:0052547111 | Esophagus | ESCC | regulation of peptidase activity | 275/8552 | 461/18723 | 7.54e-10 | 1.88e-08 | 275 |
| GO:0052548111 | Esophagus | ESCC | regulation of endopeptidase activity | 253/8552 | 432/18723 | 3.68e-08 | 6.78e-07 | 253 |
| GO:0045861111 | Esophagus | ESCC | negative regulation of proteolysis | 195/8552 | 351/18723 | 1.13e-04 | 7.85e-04 | 195 |
| GO:0051346110 | Esophagus | ESCC | negative regulation of hydrolase activity | 208/8552 | 379/18723 | 1.76e-04 | 1.14e-03 | 208 |
| GO:001046620 | Esophagus | ESCC | negative regulation of peptidase activity | 140/8552 | 262/18723 | 6.73e-03 | 2.46e-02 | 140 |
| GO:001095119 | Esophagus | ESCC | negative regulation of endopeptidase activity | 135/8552 | 252/18723 | 6.86e-03 | 2.51e-02 | 135 |
| GO:005254728 | Skin | cSCC | regulation of peptidase activity | 177/4864 | 461/18723 | 2.21e-09 | 8.02e-08 | 177 |
| GO:005254828 | Skin | cSCC | regulation of endopeptidase activity | 165/4864 | 432/18723 | 1.18e-08 | 3.63e-07 | 165 |
| GO:004586128 | Skin | cSCC | negative regulation of proteolysis | 128/4864 | 351/18723 | 7.95e-06 | 1.09e-04 | 128 |
| GO:005134627 | Skin | cSCC | negative regulation of hydrolase activity | 130/4864 | 379/18723 | 1.74e-04 | 1.49e-03 | 130 |
| GO:001095125 | Skin | cSCC | negative regulation of endopeptidase activity | 89/4864 | 252/18723 | 6.05e-04 | 4.38e-03 | 89 |
| GO:001046626 | Skin | cSCC | negative regulation of peptidase activity | 91/4864 | 262/18723 | 9.73e-04 | 6.58e-03 | 91 |
| Page: 1 |
| Pathway ID | Tissue | Disease Stage | Description | Gene Ratio | Bg Ratio | pvalue | p.adjust | qvalue | Count |
| Page: 1 |
Top |
Cell-cell communication analysis |
| Identification of potential cell-cell interactions between two cell types and their ligand-receptor pairs for different disease states |
| Ligand | Receptor | LRpair | Pathway | Tissue | Disease Stage |
| Page: 1 |
Top |
Single-cell gene regulatory network inference analysis |
| Find out the significant the regulons (TFs) and the target genes of each regulon across cell types for different disease states |
| TF | Cell Type | Tissue | Disease Stage | Target Gene | RSS | Regulon Activity |
| ∗The dot plots of a searched regulon are shown for all cell subpopulations in each disease state of each tissue based on the regulon specific score inferred using pySCENIC and by calculating the average expression. |
| Page: 1 |
Top |
Somatic mutation of malignant transformation related genes |
| Annotation of somatic variants for genes involved in malignant transformation |
| Hugo Symbol | Variant Class | Variant Classification | dbSNP RS | HGVSc | HGVSp | HGVSp Short | SWISSPROT | BIOTYPE | SIFT | PolyPhen | Tumor Sample Barcode | Tissue | Histology | Sex | Age | Stage | Therapy Types | Drugs | Outcome |
| WFDC5 | SNV | Missense_Mutation | rs551709664 | c.92N>T | p.Ser31Leu | p.S31L | Q8TCV5 | protein_coding | tolerated(0.66) | benign(0.034) | TCGA-A8-A079-01 | Breast | breast invasive carcinoma | Female | >=65 | III/IV | Chemotherapy | 5-fluorouracil | SD |
| WFDC5 | SNV | Missense_Mutation | c.167N>T | p.Pro56Leu | p.P56L | Q8TCV5 | protein_coding | deleterious(0) | probably_damaging(0.999) | TCGA-AO-A0JE-01 | Breast | breast invasive carcinoma | Female | <65 | III/IV | Chemotherapy | doxorubicin | SD | |
| WFDC5 | SNV | Missense_Mutation | c.62C>T | p.Ala21Val | p.A21V | Q8TCV5 | protein_coding | tolerated(0.21) | benign(0.091) | TCGA-D8-A1XQ-01 | Breast | breast invasive carcinoma | Female | >=65 | I/II | Unknown | Unknown | SD | |
| WFDC5 | SNV | Missense_Mutation | rs551709664 | c.92N>T | p.Ser31Leu | p.S31L | Q8TCV5 | protein_coding | tolerated(0.66) | benign(0.034) | TCGA-2W-A8YY-01 | Cervix | cervical & endocervical cancer | Female | <65 | I/II | Chemotherapy | cisplatin | CR |
| WFDC5 | SNV | Missense_Mutation | rs756806925 | c.352N>T | p.Arg118Trp | p.R118W | Q8TCV5 | protein_coding | deleterious(0.01) | probably_damaging(0.994) | TCGA-AA-3715-01 | Colorectum | colon adenocarcinoma | Male | >=65 | I/II | Unknown | Unknown | PD |
| WFDC5 | SNV | Missense_Mutation | c.359N>A | p.Pro120His | p.P120H | Q8TCV5 | protein_coding | deleterious(0) | probably_damaging(1) | TCGA-AD-5900-01 | Colorectum | colon adenocarcinoma | Male | >=65 | I/II | Unknown | Unknown | SD | |
| WFDC5 | SNV | Missense_Mutation | c.295N>A | p.Asp99Asn | p.D99N | Q8TCV5 | protein_coding | deleterious(0) | probably_damaging(0.999) | TCGA-CM-6164-01 | Colorectum | colon adenocarcinoma | Female | <65 | I/II | Unknown | Unknown | SD | |
| WFDC5 | SNV | Missense_Mutation | rs139507452 | c.344N>A | p.Arg115Gln | p.R115Q | Q8TCV5 | protein_coding | deleterious(0.03) | probably_damaging(0.973) | TCGA-AP-A056-01 | Endometrium | uterine corpus endometrioid carcinoma | Female | <65 | I/II | Unknown | Unknown | SD |
| WFDC5 | SNV | Missense_Mutation | c.359N>T | p.Pro120Leu | p.P120L | Q8TCV5 | protein_coding | deleterious(0) | probably_damaging(0.999) | TCGA-AP-A1DK-01 | Endometrium | uterine corpus endometrioid carcinoma | Female | <65 | I/II | Unknown | Unknown | SD | |
| WFDC5 | SNV | Missense_Mutation | novel | c.343C>T | p.Arg115Trp | p.R115W | Q8TCV5 | protein_coding | deleterious(0) | probably_damaging(0.994) | TCGA-AX-A1CE-01 | Endometrium | uterine corpus endometrioid carcinoma | Female | <65 | I/II | Unspecific | Paclitaxel | SD |
| Page: 1 2 |
Top |
Related drugs of malignant transformation related genes |
| Identification of chemicals and drugs interact with genes involved in malignant transfromation |
| (DGIdb 4.0) |
| Entrez ID | Symbol | Category | Interaction Types | Drug Claim Name | Drug Name | PMIDs |
| Page: 1 |

Copyright 2023-Present -The University of Texas Health Science Center at Houston |