
|
|||||
|
 | |
| |
| |
| |
| |
| |
|
Gene: WFDC2 |
Gene summary for WFDC2 |
| Gene information | Species | Human | Gene symbol | WFDC2 | Gene ID | 10406 |
| Gene name | WAP four-disulfide core domain 2 | |
| Gene Alias | EDDM4 | |
| Cytomap | 20q13.12 | |
| Gene Type | protein-coding | GO ID | GO:0000003 | UniProtAcc | Q14508 |
Top |
Malignant transformation analysis |
| Identification of the aberrant gene expression in precancerous and cancerous lesions by comparing the gene expression of stem-like cells in diseased tissues with normal stem cells |
| Entrez ID | Symbol | Replicates | Species | Organ | Tissue | Adj P-value | Log2FC | Malignancy |
| 10406 | WFDC2 | GSM4909281 | Human | Breast | IDC | 1.34e-23 | -8.87e-01 | 0.21 |
| 10406 | WFDC2 | GSM4909282 | Human | Breast | IDC | 3.30e-10 | -2.97e-02 | -0.0288 |
| 10406 | WFDC2 | GSM4909285 | Human | Breast | IDC | 1.35e-22 | -8.11e-01 | 0.21 |
| 10406 | WFDC2 | GSM4909286 | Human | Breast | IDC | 1.85e-34 | -1.14e+00 | 0.1081 |
| 10406 | WFDC2 | GSM4909287 | Human | Breast | IDC | 8.62e-17 | -7.87e-01 | 0.2057 |
| 10406 | WFDC2 | GSM4909288 | Human | Breast | IDC | 8.64e-10 | -1.10e+00 | 0.0988 |
| 10406 | WFDC2 | GSM4909290 | Human | Breast | IDC | 1.80e-45 | -1.39e+00 | 0.2096 |
| 10406 | WFDC2 | GSM4909291 | Human | Breast | IDC | 7.91e-38 | -1.38e+00 | 0.1753 |
| 10406 | WFDC2 | GSM4909292 | Human | Breast | IDC | 1.66e-03 | -1.12e+00 | 0.1236 |
| 10406 | WFDC2 | GSM4909293 | Human | Breast | IDC | 7.79e-19 | -8.44e-01 | 0.1581 |
| 10406 | WFDC2 | GSM4909294 | Human | Breast | IDC | 1.83e-39 | -1.19e+00 | 0.2022 |
| 10406 | WFDC2 | GSM4909295 | Human | Breast | IDC | 3.71e-06 | -7.26e-01 | 0.0898 |
| 10406 | WFDC2 | GSM4909296 | Human | Breast | IDC | 3.90e-48 | -1.29e+00 | 0.1524 |
| 10406 | WFDC2 | GSM4909297 | Human | Breast | IDC | 6.20e-05 | -5.67e-01 | 0.1517 |
| 10406 | WFDC2 | GSM4909298 | Human | Breast | IDC | 2.05e-18 | -4.02e-01 | 0.1551 |
| 10406 | WFDC2 | GSM4909299 | Human | Breast | IDC | 1.67e-11 | 1.12e-01 | 0.035 |
| 10406 | WFDC2 | GSM4909300 | Human | Breast | IDC | 2.05e-02 | -3.95e-02 | 0.0334 |
| 10406 | WFDC2 | GSM4909301 | Human | Breast | IDC | 3.79e-04 | -2.47e-01 | 0.1577 |
| 10406 | WFDC2 | GSM4909302 | Human | Breast | IDC | 2.41e-11 | -4.89e-01 | 0.1545 |
| 10406 | WFDC2 | GSM4909304 | Human | Breast | IDC | 8.41e-55 | -1.35e+00 | 0.1636 |
| Page: 1 2 3 4 5 6 7 8 9 10 11 12 13 |
| Tissue | Expression Dynamics | Abbreviation |
| Breast | 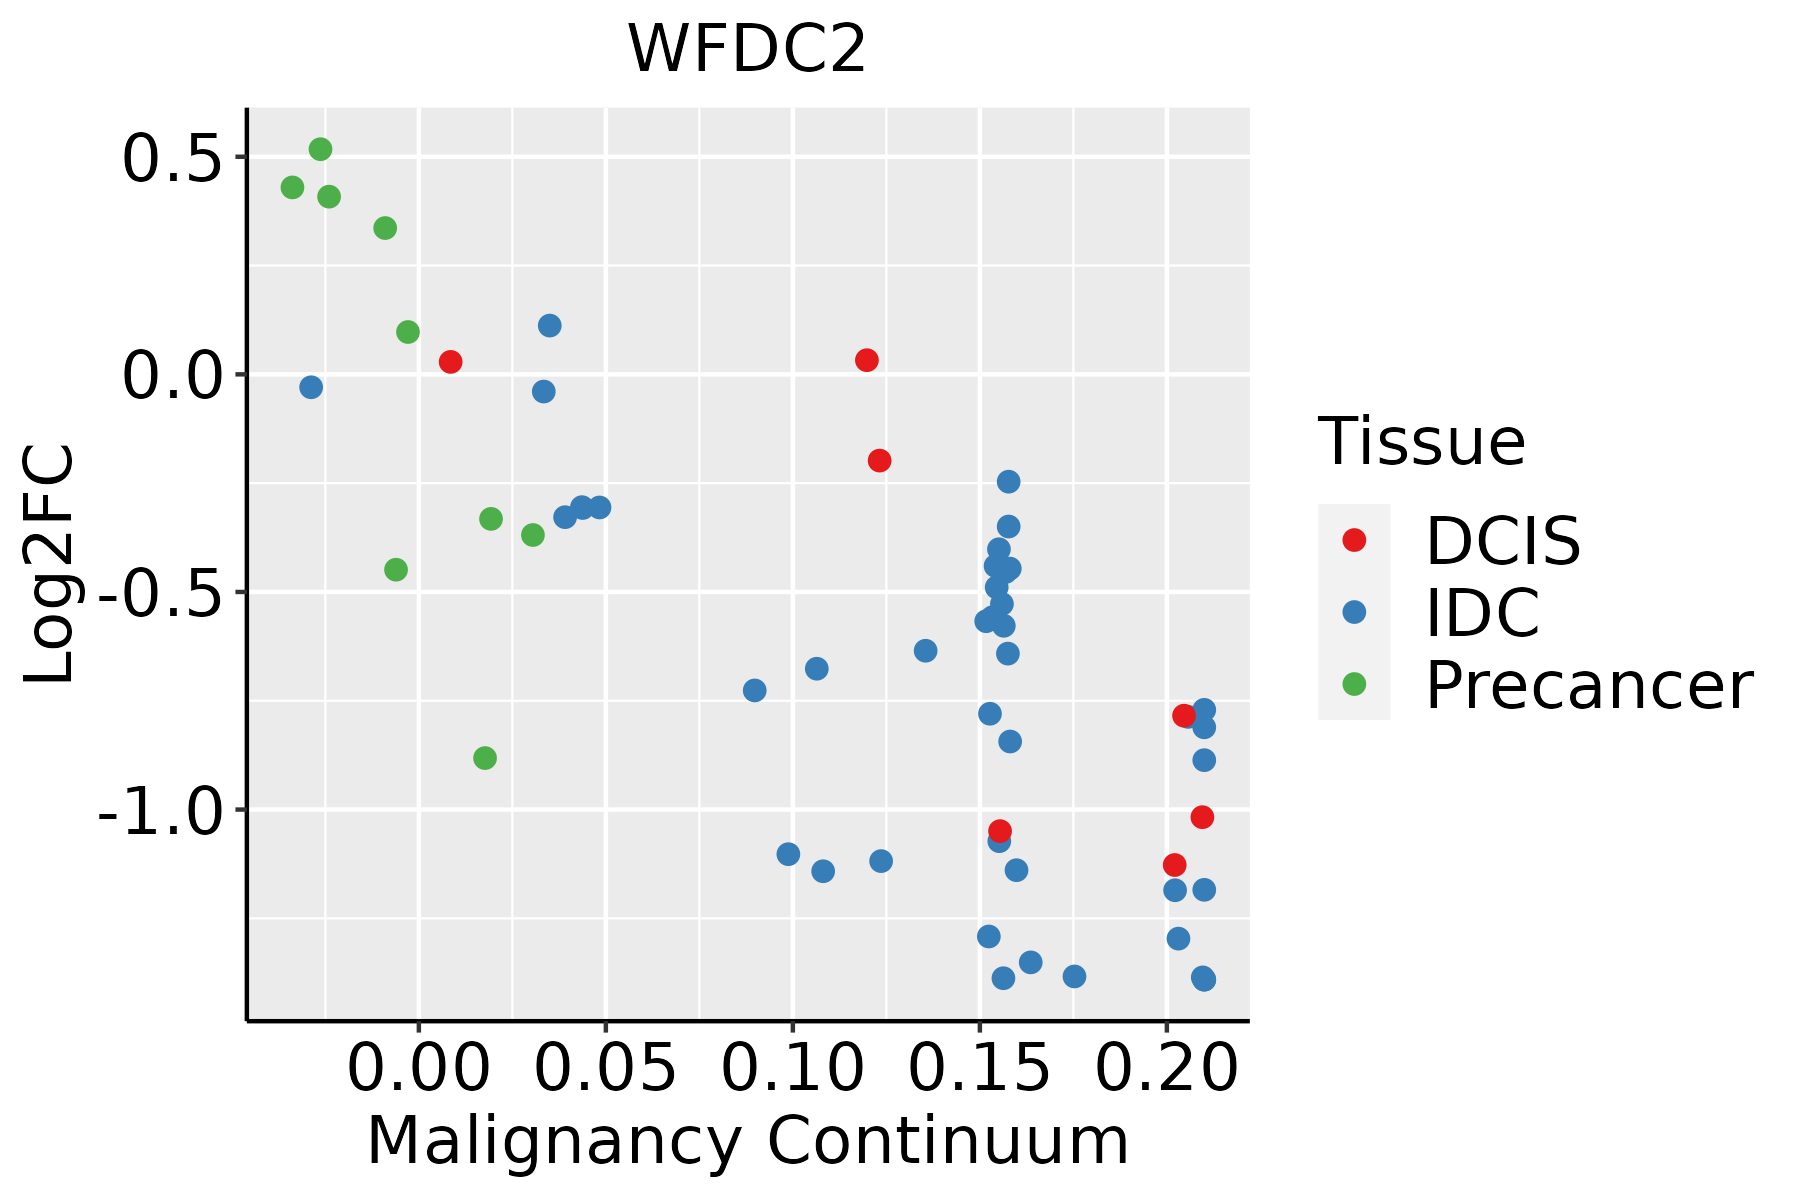 | IDC: Invasive ductal carcinoma |
| DCIS: Ductal carcinoma in situ | ||
| Precancer(BRCA1-mut): Precancerous lesion from BRCA1 mutation carriers | ||
| Cervix | 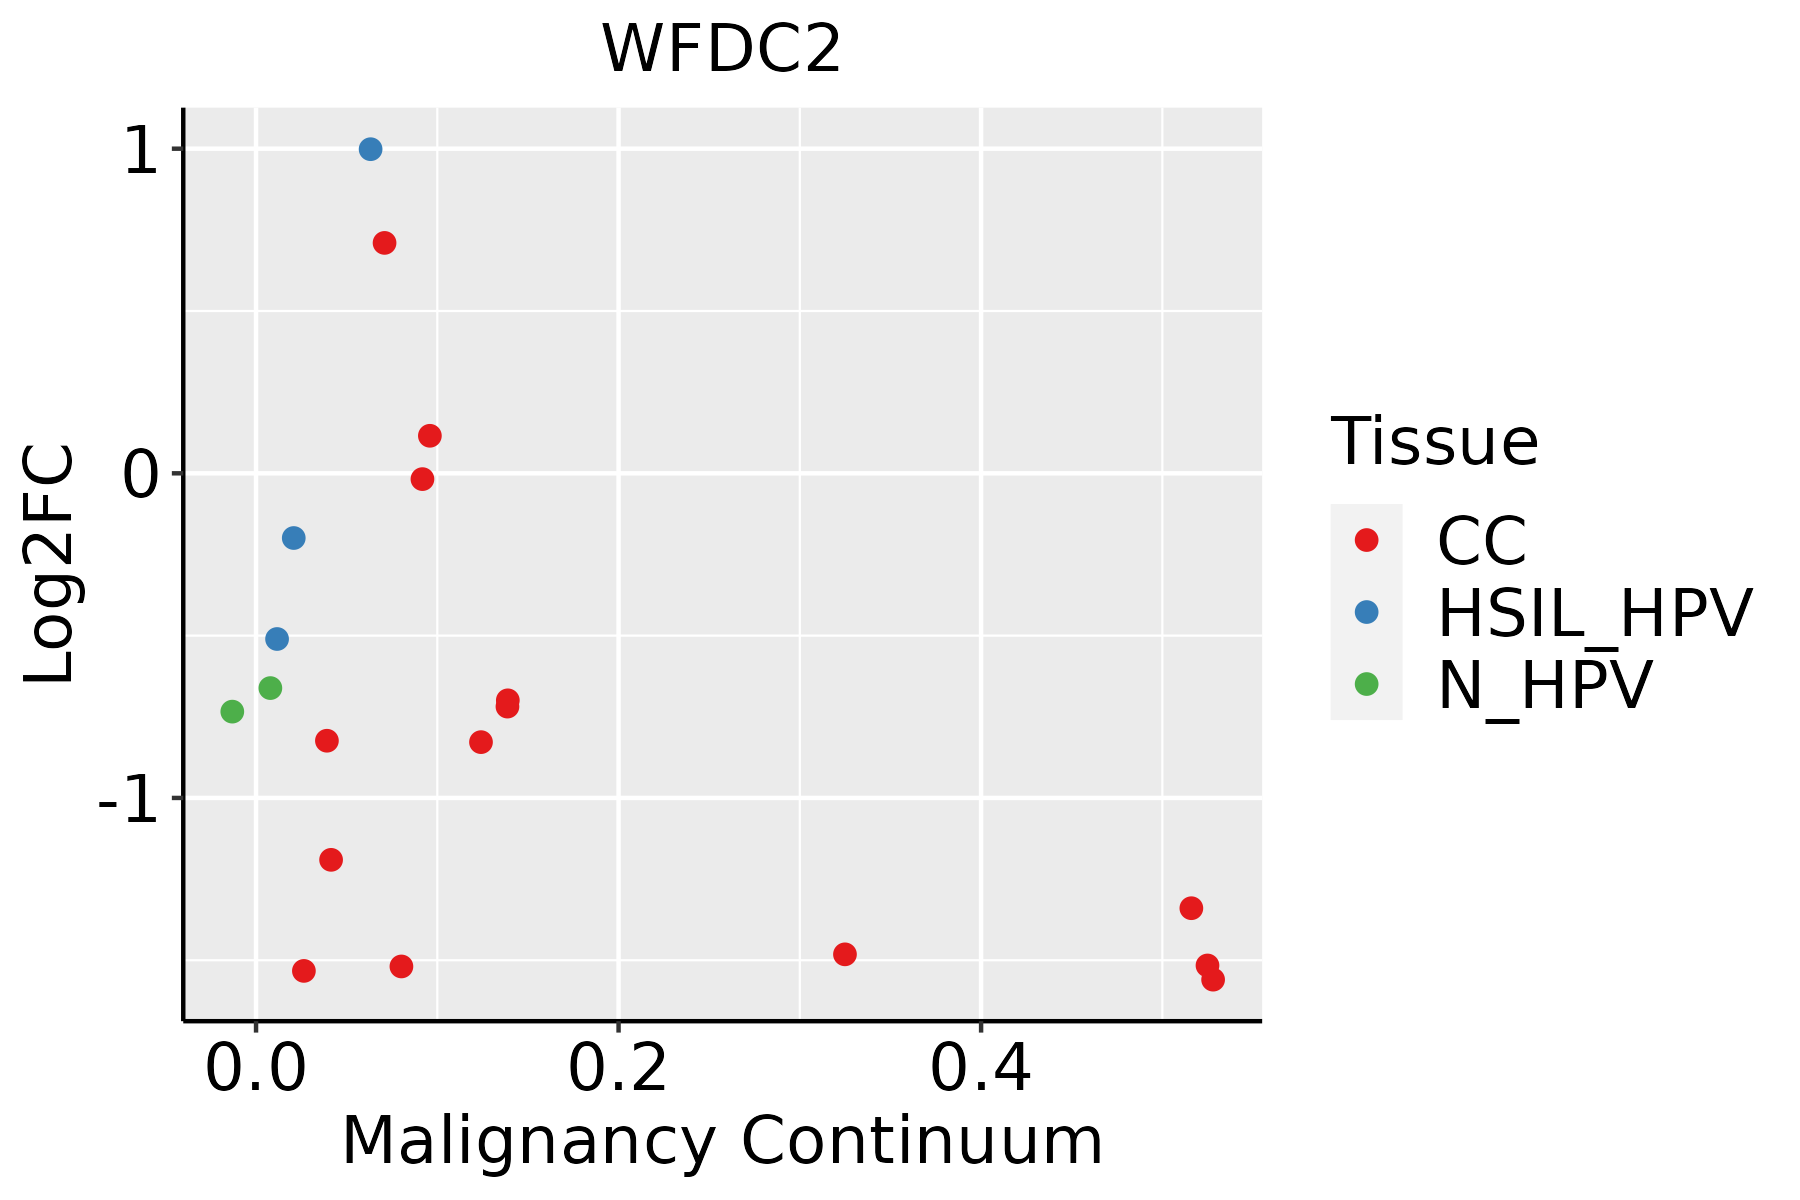 | CC: Cervix cancer |
| HSIL_HPV: HPV-infected high-grade squamous intraepithelial lesions | ||
| N_HPV: HPV-infected normal cervix | ||
| Colorectum (GSE201348) |  | FAP: Familial adenomatous polyposis |
| CRC: Colorectal cancer | ||
| Colorectum (HTA11) |  | AD: Adenomas |
| SER: Sessile serrated lesions | ||
| MSI-H: Microsatellite-high colorectal cancer | ||
| MSS: Microsatellite stable colorectal cancer | ||
| Endometrium | 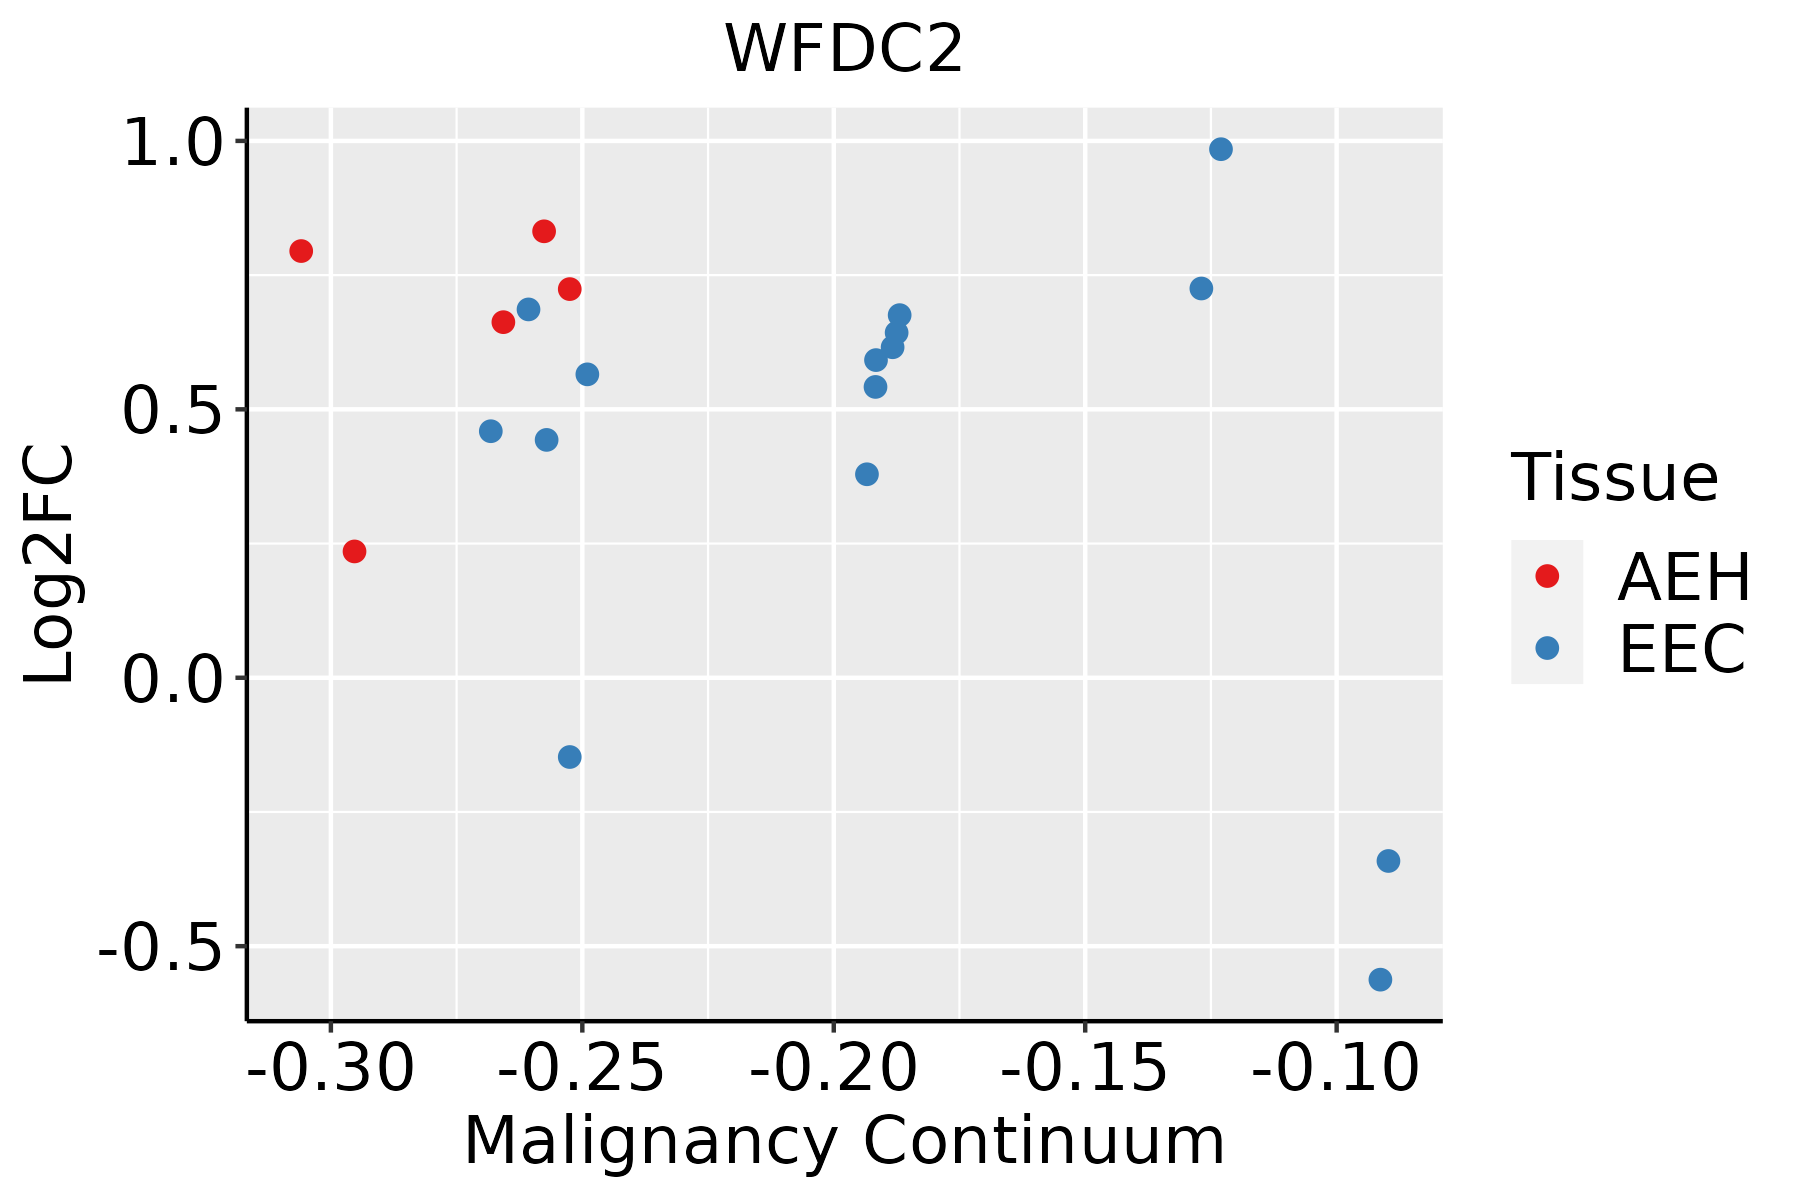 | AEH: Atypical endometrial hyperplasia |
| EEC: Endometrioid Cancer | ||
| Esophagus | 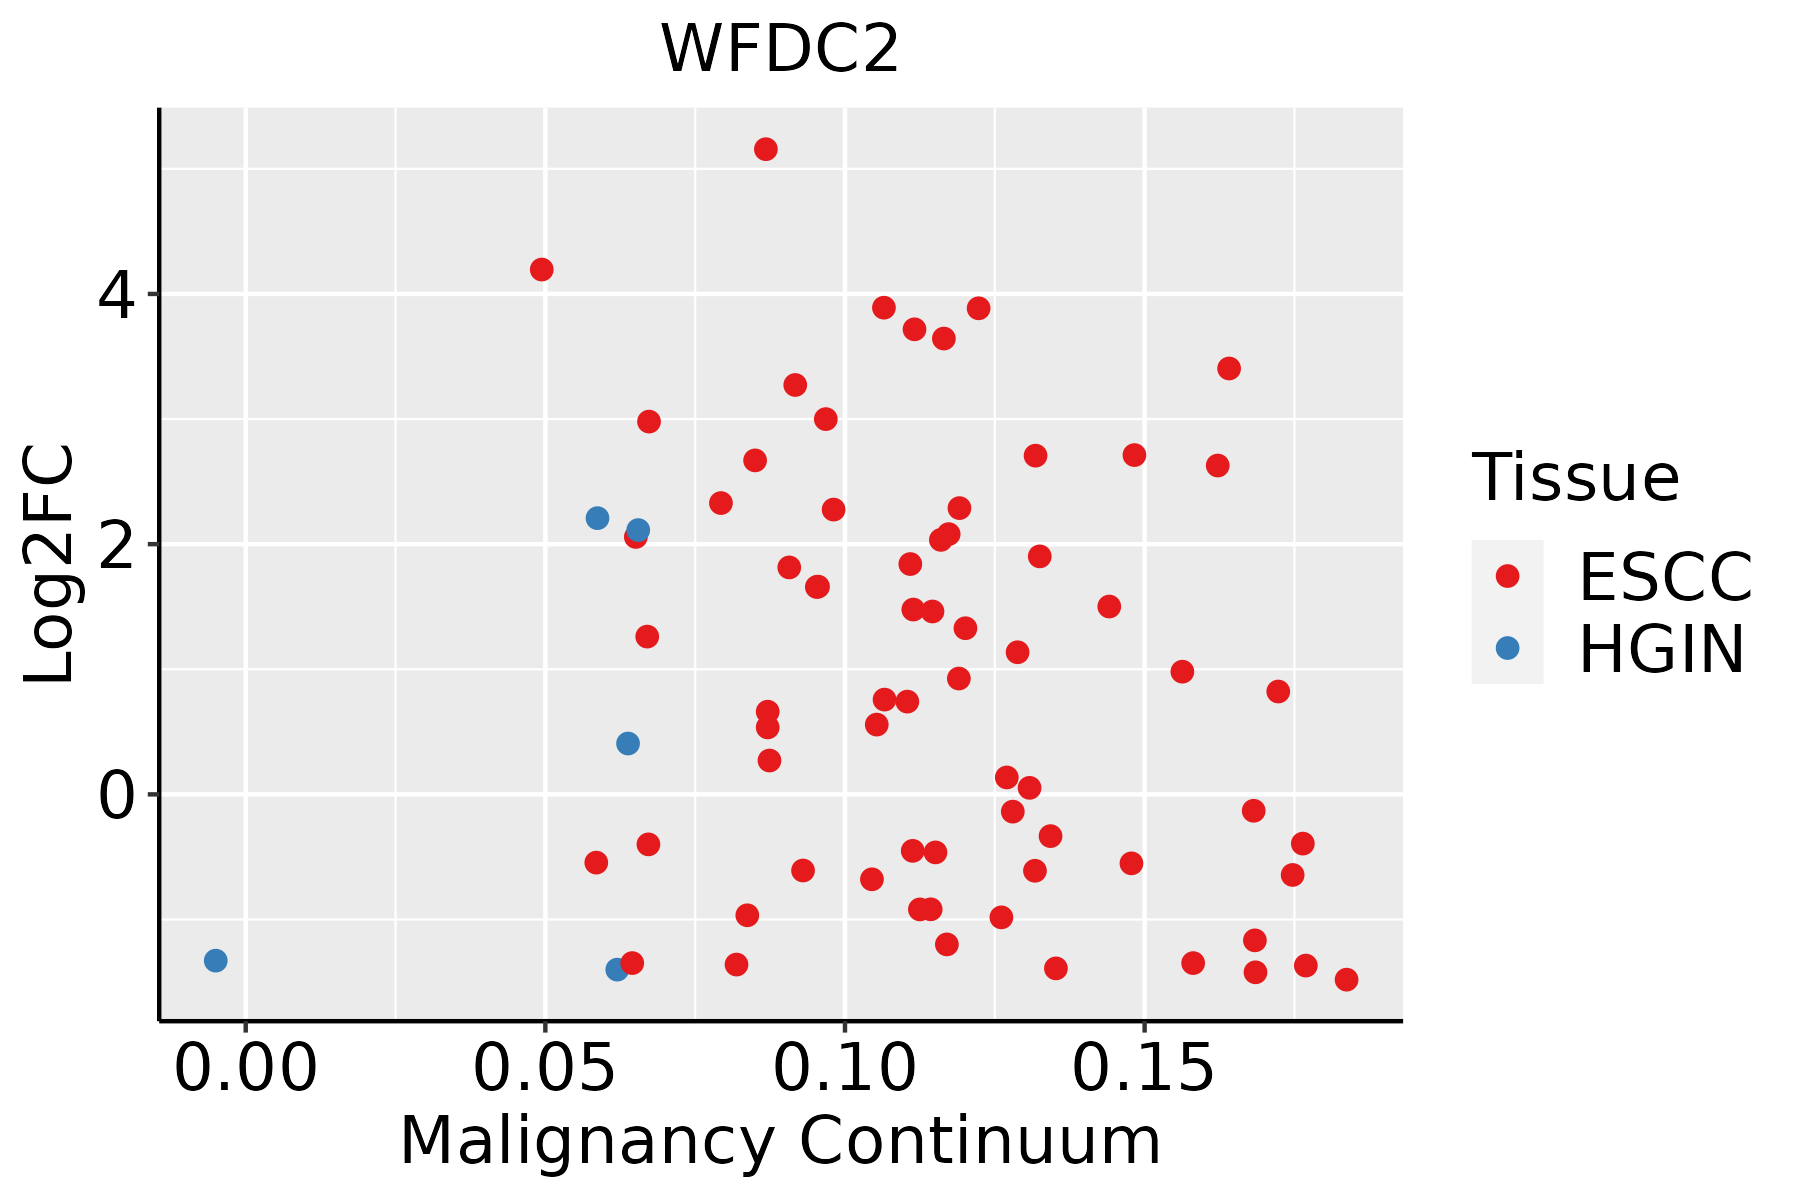 | ESCC: Esophageal squamous cell carcinoma |
| HGIN: High-grade intraepithelial neoplasias | ||
| LGIN: Low-grade intraepithelial neoplasias | ||
| GC |  | CAG: Chronic atrophic gastritis |
| CAG with IM: Chronic atrophic gastritis with intestinal metaplasia | ||
| CSG: Chronic superficial gastritis | ||
| GC: Gastric cancer | ||
| SIM: Severe intestinal metaplasia | ||
| WIM: Wild intestinal metaplasia | ||
| Liver | 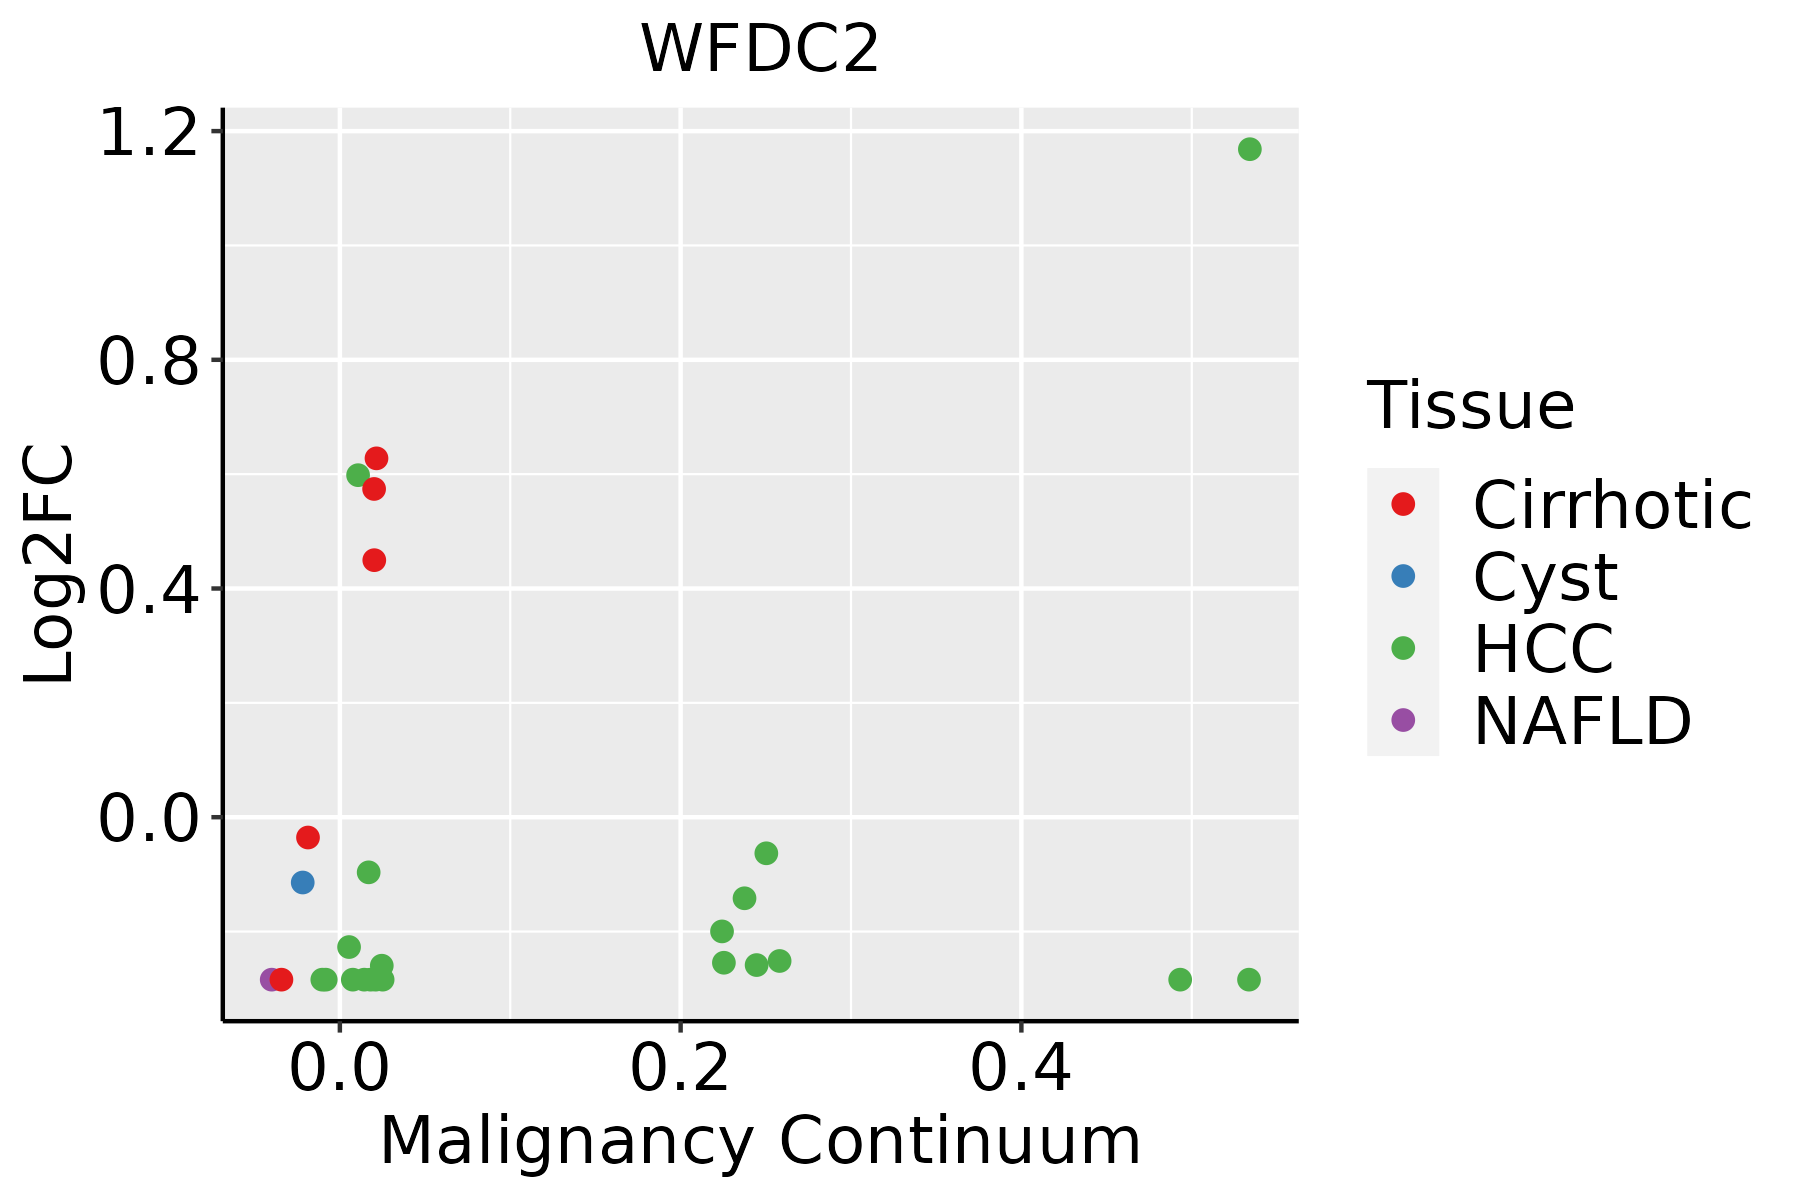 | HCC: Hepatocellular carcinoma |
| NAFLD: Non-alcoholic fatty liver disease | ||
| Lung | 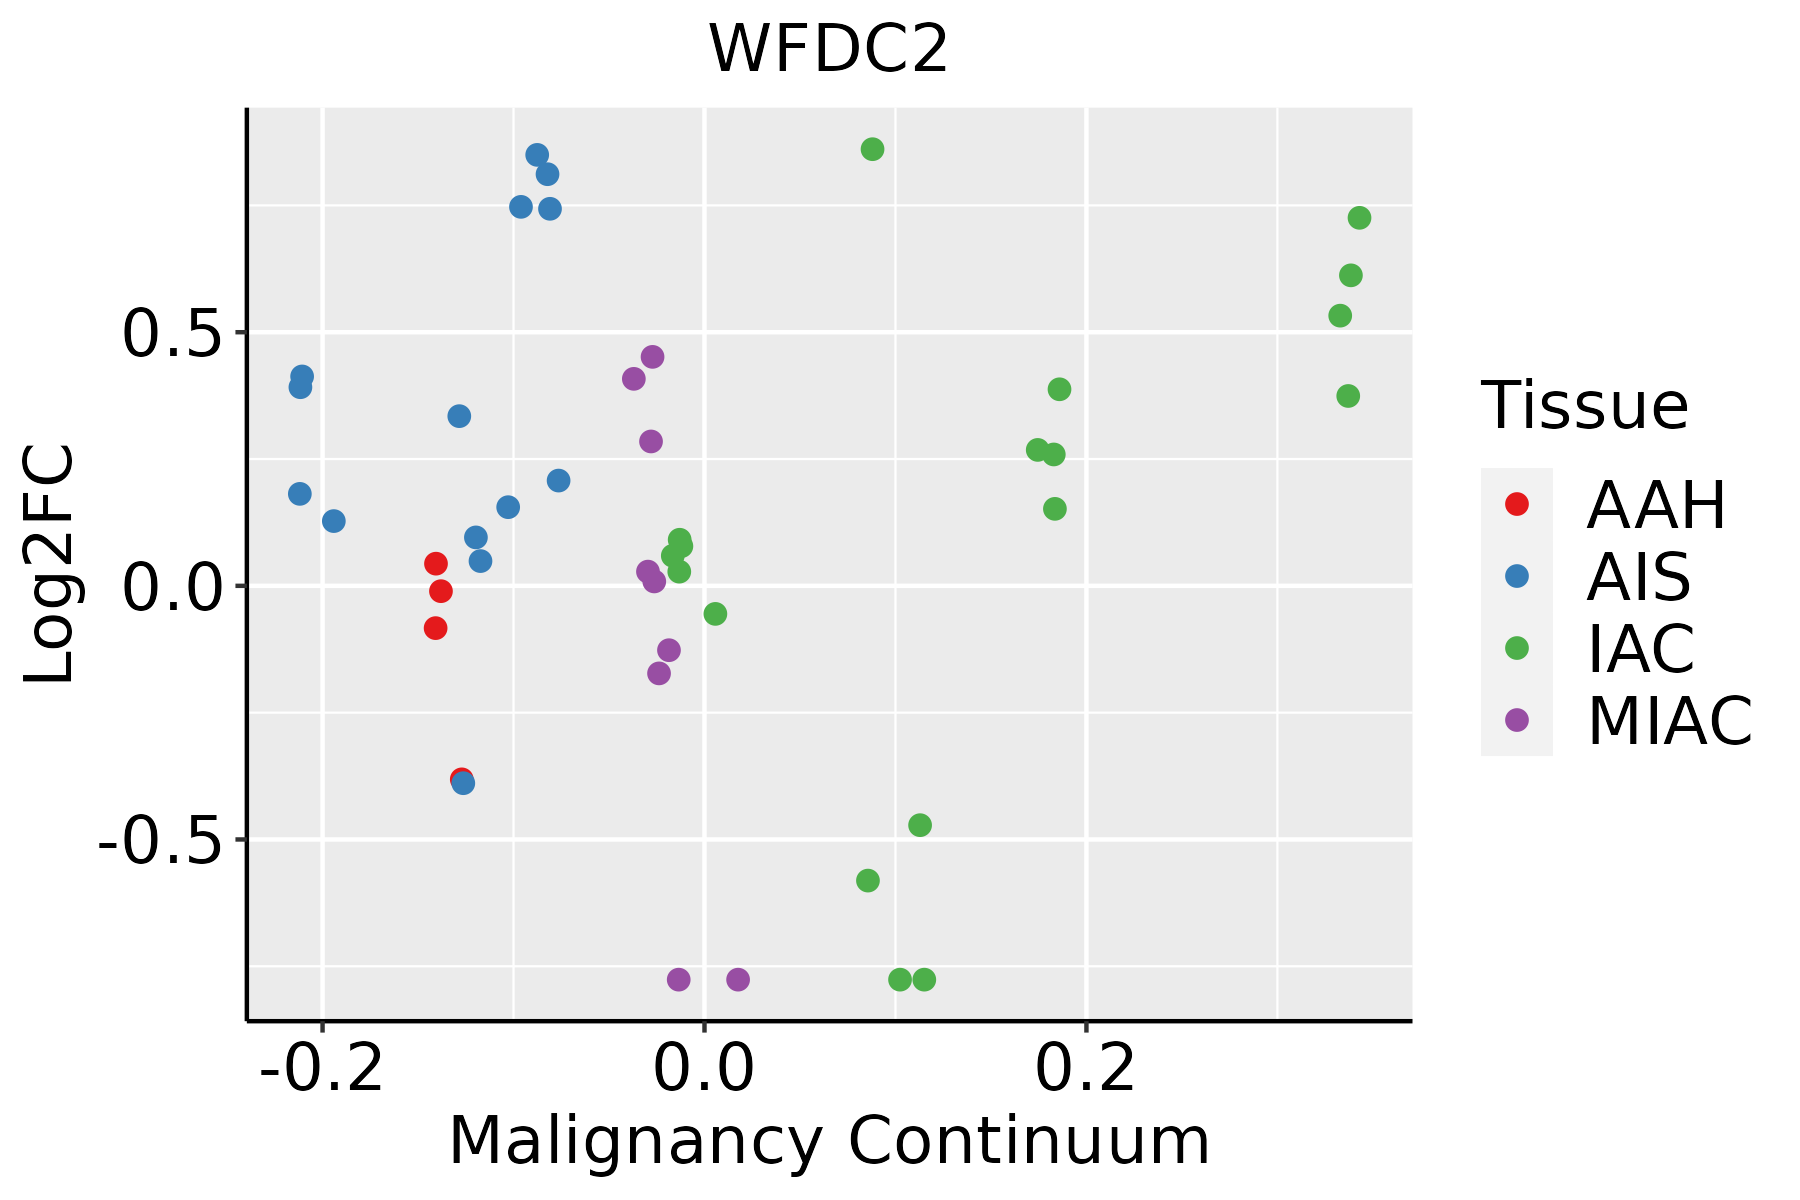 | AAH: Atypical adenomatous hyperplasia |
| AIS: Adenocarcinoma in situ | ||
| IAC: Invasive lung adenocarcinoma | ||
| MIA: Minimally invasive adenocarcinoma | ||
| Oral Cavity | 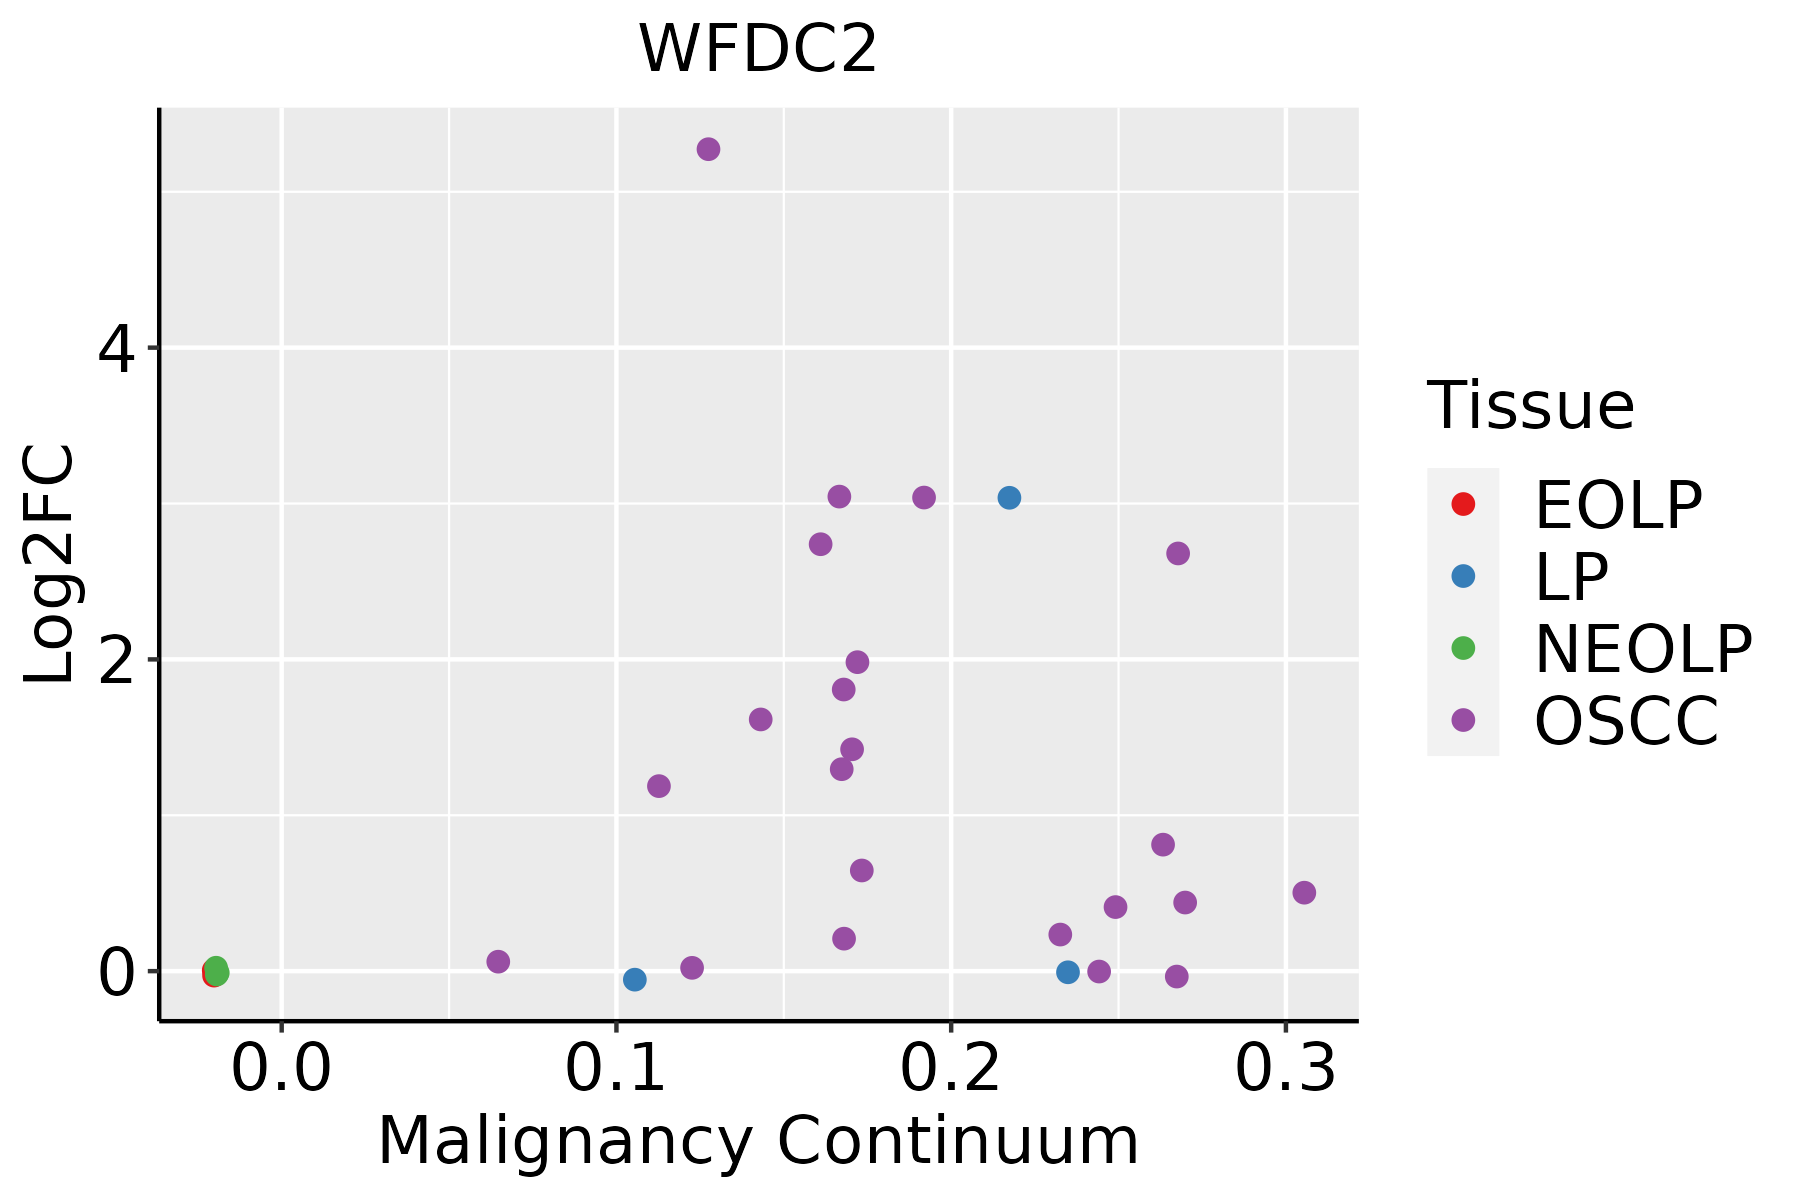 | EOLP: Erosive Oral lichen planus |
| LP: leukoplakia | ||
| NEOLP: Non-erosive oral lichen planus | ||
| OSCC: Oral squamous cell carcinoma | ||
| Prostate |  | BPH: Benign Prostatic Hyperplasia |
| Thyroid | 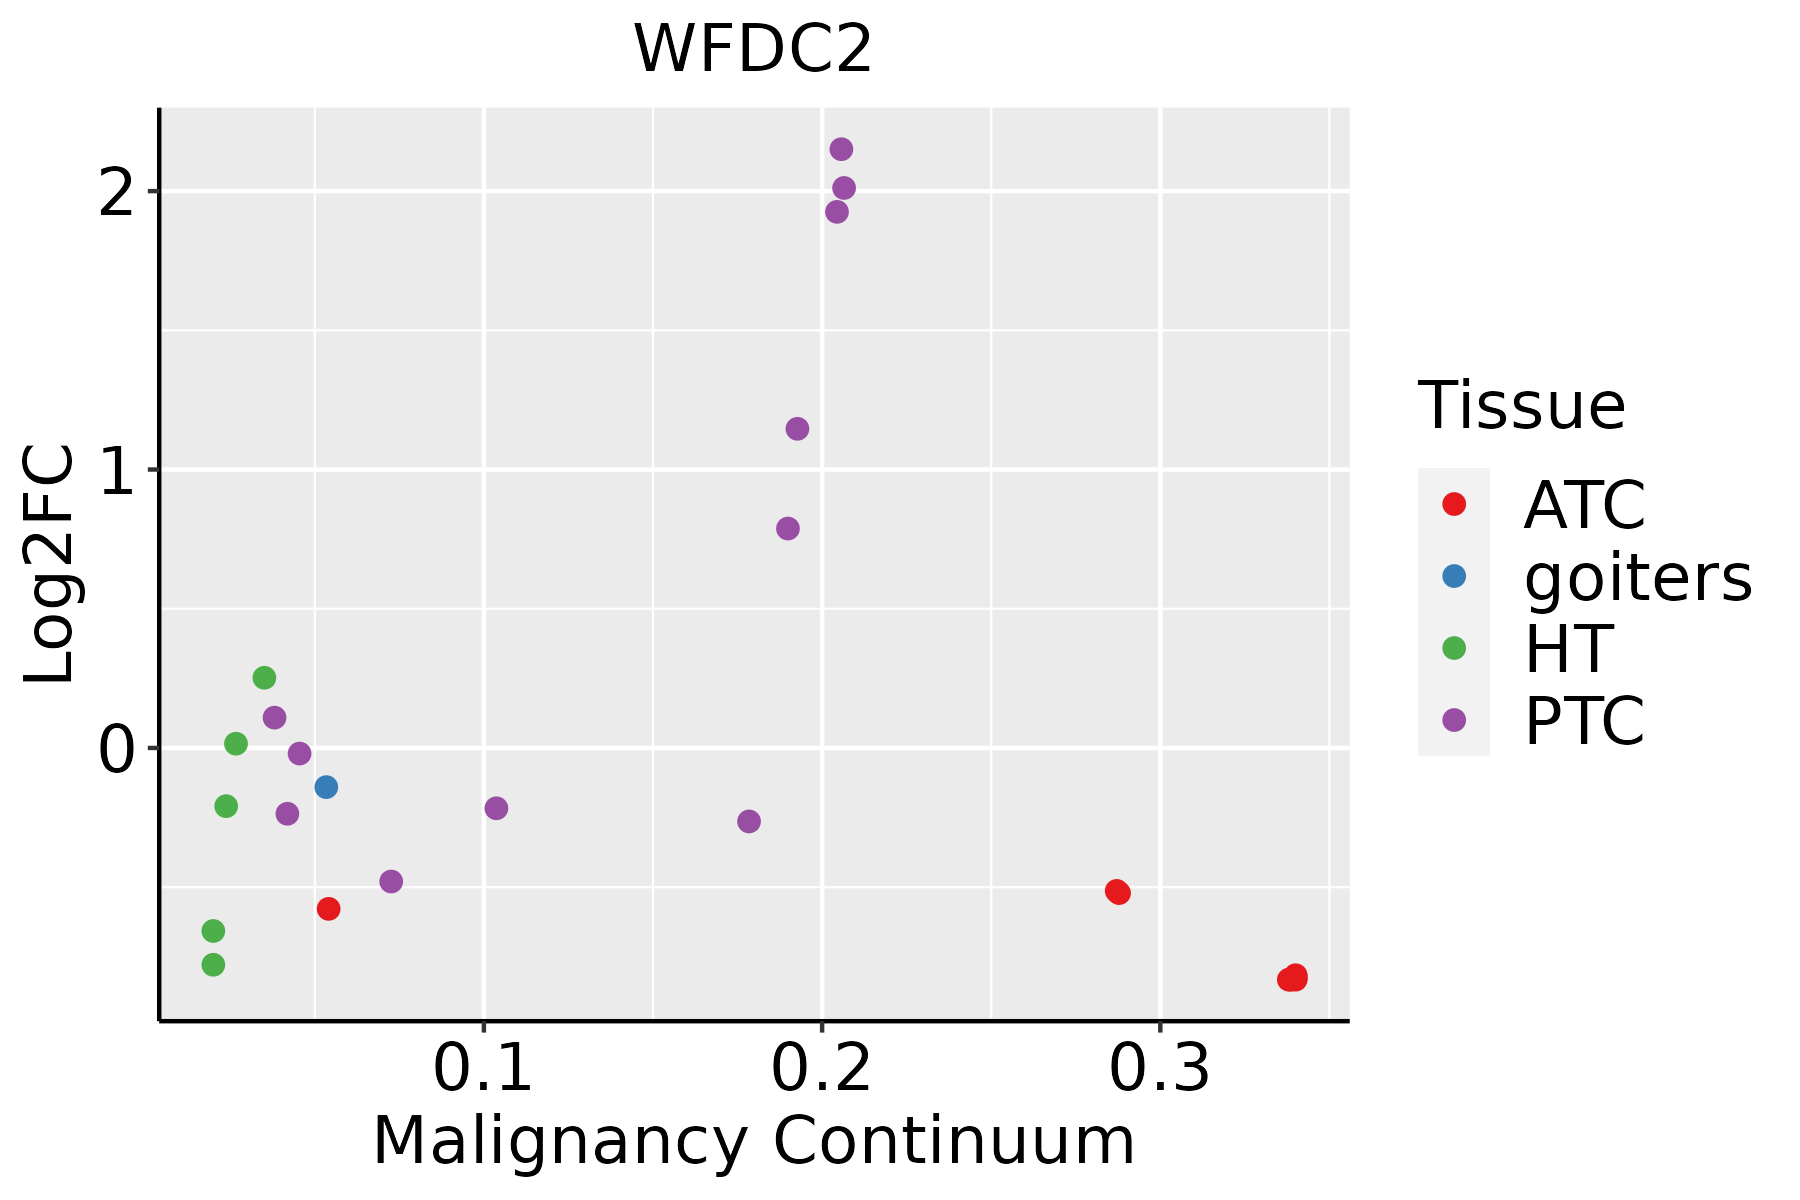 | ATC: Anaplastic thyroid cancer |
| HT: Hashimoto's thyroiditis | ||
| PTC: Papillary thyroid cancer |
| ∗log2FC in expression of this searched gene in stem-like cells from each diseased tissue sample relative to stem-like cells in normal samples in each tissue plotted against the malignancy continuum. Samples are colored based on if they are from different disease stage. |
Top |
Malignant transformation related pathway analysis |
| Find out the enriched GO biological processes and KEGG pathways involved in transition from healthy to precancer to cancer |
| Tissue | Disease Stage | Enriched GO biological Processes |
| Colorectum | AD |  |
| Colorectum | SER |  |
| Colorectum | MSS |  |
| Colorectum | MSI-H |  |
| Colorectum | FAP |  |
| ∗Top 15 enriched GO BP terms are showed in the bar plot of each disease state in each tissue. Each row represents a significant GO biological process which is colored according to the -log10(p.adjust). |
| Page: 1 2 3 4 5 6 7 8 9 |
| GO ID | Tissue | Disease Stage | Description | Gene Ratio | Bg Ratio | pvalue | p.adjust | Count |
| GO:00525479 | Breast | Precancer | regulation of peptidase activity | 71/1080 | 461/18723 | 2.72e-14 | 6.94e-12 | 71 |
| GO:00525489 | Breast | Precancer | regulation of endopeptidase activity | 67/1080 | 432/18723 | 1.06e-13 | 2.36e-11 | 67 |
| GO:00458619 | Breast | Precancer | negative regulation of proteolysis | 50/1080 | 351/18723 | 2.99e-09 | 2.39e-07 | 50 |
| GO:00513468 | Breast | Precancer | negative regulation of hydrolase activity | 50/1080 | 379/18723 | 3.85e-08 | 2.34e-06 | 50 |
| GO:00104668 | Breast | Precancer | negative regulation of peptidase activity | 38/1080 | 262/18723 | 1.46e-07 | 7.82e-06 | 38 |
| GO:00109519 | Breast | Precancer | negative regulation of endopeptidase activity | 37/1080 | 252/18723 | 1.55e-07 | 8.05e-06 | 37 |
| GO:00197307 | Breast | Precancer | antimicrobial humoral response | 19/1080 | 122/18723 | 7.02e-05 | 1.40e-03 | 19 |
| GO:005254714 | Breast | IDC | regulation of peptidase activity | 96/1434 | 461/18723 | 7.58e-20 | 6.15e-17 | 96 |
| GO:005254814 | Breast | IDC | regulation of endopeptidase activity | 88/1434 | 432/18723 | 1.20e-17 | 4.85e-15 | 88 |
| GO:004586114 | Breast | IDC | negative regulation of proteolysis | 70/1434 | 351/18723 | 8.21e-14 | 2.22e-11 | 70 |
| GO:005134613 | Breast | IDC | negative regulation of hydrolase activity | 71/1434 | 379/18723 | 1.33e-12 | 2.90e-10 | 71 |
| GO:001046613 | Breast | IDC | negative regulation of peptidase activity | 56/1434 | 262/18723 | 1.39e-12 | 2.92e-10 | 56 |
| GO:001095112 | Breast | IDC | negative regulation of endopeptidase activity | 52/1434 | 252/18723 | 3.53e-11 | 5.57e-09 | 52 |
| GO:001973011 | Breast | IDC | antimicrobial humoral response | 23/1434 | 122/18723 | 4.67e-05 | 1.04e-03 | 23 |
| GO:00069596 | Breast | IDC | humoral immune response | 40/1434 | 317/18723 | 1.25e-03 | 1.33e-02 | 40 |
| GO:005254723 | Breast | DCIS | regulation of peptidase activity | 88/1390 | 461/18723 | 1.18e-16 | 4.78e-14 | 88 |
| GO:005254823 | Breast | DCIS | regulation of endopeptidase activity | 83/1390 | 432/18723 | 6.07e-16 | 2.15e-13 | 83 |
| GO:004586123 | Breast | DCIS | negative regulation of proteolysis | 63/1390 | 351/18723 | 4.39e-11 | 6.06e-09 | 63 |
| GO:005134623 | Breast | DCIS | negative regulation of hydrolase activity | 64/1390 | 379/18723 | 4.32e-10 | 4.80e-08 | 64 |
| GO:001046622 | Breast | DCIS | negative regulation of peptidase activity | 49/1390 | 262/18723 | 1.54e-09 | 1.43e-07 | 49 |
| Page: 1 2 3 4 5 6 7 8 9 |
| Pathway ID | Tissue | Disease Stage | Description | Gene Ratio | Bg Ratio | pvalue | p.adjust | qvalue | Count |
| Page: 1 |
Top |
Cell-cell communication analysis |
| Identification of potential cell-cell interactions between two cell types and their ligand-receptor pairs for different disease states |
| Ligand | Receptor | LRpair | Pathway | Tissue | Disease Stage |
| Page: 1 |
Top |
Single-cell gene regulatory network inference analysis |
| Find out the significant the regulons (TFs) and the target genes of each regulon across cell types for different disease states |
| TF | Cell Type | Tissue | Disease Stage | Target Gene | RSS | Regulon Activity |
| ∗The dot plots of a searched regulon are shown for all cell subpopulations in each disease state of each tissue based on the regulon specific score inferred using pySCENIC and by calculating the average expression. |
| Page: 1 |
Top |
Somatic mutation of malignant transformation related genes |
| Annotation of somatic variants for genes involved in malignant transformation |
| Hugo Symbol | Variant Class | Variant Classification | dbSNP RS | HGVSc | HGVSp | HGVSp Short | SWISSPROT | BIOTYPE | SIFT | PolyPhen | Tumor Sample Barcode | Tissue | Histology | Sex | Age | Stage | Therapy Types | Drugs | Outcome |
| WFDC2 | SNV | Missense_Mutation | c.253N>G | p.Ile85Val | p.I85V | Q14508 | protein_coding | tolerated(0.47) | benign(0.023) | TCGA-A8-A07B-01 | Breast | breast invasive carcinoma | Female | >=65 | I/II | Unknown | Unknown | SD | |
| WFDC2 | SNV | Missense_Mutation | novel | c.265N>G | p.Gln89Glu | p.Q89E | Q14508 | protein_coding | tolerated(0.08) | benign(0.04) | TCGA-E2-A573-01 | Breast | breast invasive carcinoma | Female | <65 | I/II | Chemotherapy | taxotere | CR |
| WFDC2 | SNV | Missense_Mutation | rs757484769 | c.152C>T | p.Ser51Leu | p.S51L | Q14508 | protein_coding | tolerated(0.08) | benign(0.081) | TCGA-LP-A7HU-01 | Cervix | cervical & endocervical cancer | Female | <65 | I/II | Unknown | Unknown | SD |
| WFDC2 | SNV | Missense_Mutation | c.37N>A | p.Leu13Ile | p.L13I | Q14508 | protein_coding | tolerated(0.11) | benign(0.017) | TCGA-BG-A18B-01 | Endometrium | uterine corpus endometrioid carcinoma | Female | <65 | I/II | Unknown | Unknown | SD | |
| WFDC2 | SNV | Missense_Mutation | novel | c.199N>A | p.Ala67Thr | p.A67T | Q14508 | protein_coding | tolerated(0.2) | benign(0.038) | TCGA-BG-A222-01 | Endometrium | uterine corpus endometrioid carcinoma | Female | <65 | I/II | Unknown | Unknown | SD |
| WFDC2 | SNV | Missense_Mutation | novel | c.372C>A | p.Phe124Leu | p.F124L | Q14508 | protein_coding | tolerated(0.07) | benign(0.187) | TCGA-EO-A3AY-01 | Endometrium | uterine corpus endometrioid carcinoma | Female | <65 | I/II | Unknown | Unknown | PD |
| WFDC2 | SNV | Missense_Mutation | c.284N>T | p.Asp95Val | p.D95V | Q14508 | protein_coding | deleterious(0) | probably_damaging(0.917) | TCGA-44-7660-01 | Lung | lung adenocarcinoma | Male | >=65 | I/II | Vaccine | recprame+as15 | PD | |
| WFDC2 | SNV | Missense_Mutation | novel | c.231N>C | p.Glu77Asp | p.E77D | Q14508 | protein_coding | tolerated(0.19) | benign(0.348) | TCGA-KU-A66S-01 | Oral cavity | head & neck squamous cell carcinoma | Female | >=65 | III/IV | Unknown | Unknown | PD |
| Page: 1 |
Top |
Related drugs of malignant transformation related genes |
| Identification of chemicals and drugs interact with genes involved in malignant transfromation |
| (DGIdb 4.0) |
| Entrez ID | Symbol | Category | Interaction Types | Drug Claim Name | Drug Name | PMIDs |
| Page: 1 |

Copyright 2023-Present -The University of Texas Health Science Center at Houston |