
|
|||||
|
 | |
| |
| |
| |
| |
| |
|
Gene: WDR91 |
Gene summary for WDR91 |
| Gene information | Species | Human | Gene symbol | WDR91 | Gene ID | 29062 |
| Gene name | WD repeat domain 91 | |
| Gene Alias | HSPC049 | |
| Cytomap | 7q33 | |
| Gene Type | protein-coding | GO ID | GO:0006793 | UniProtAcc | A4D1P6 |
Top |
Malignant transformation analysis |
| Identification of the aberrant gene expression in precancerous and cancerous lesions by comparing the gene expression of stem-like cells in diseased tissues with normal stem cells |
| Entrez ID | Symbol | Replicates | Species | Organ | Tissue | Adj P-value | Log2FC | Malignancy |
| 29062 | WDR91 | LZE4T | Human | Esophagus | ESCC | 6.46e-03 | 1.37e-01 | 0.0811 |
| 29062 | WDR91 | LZE7T | Human | Esophagus | ESCC | 1.51e-03 | 9.01e-02 | 0.0667 |
| 29062 | WDR91 | LZE20T | Human | Esophagus | ESCC | 3.54e-08 | 1.76e-01 | 0.0662 |
| 29062 | WDR91 | LZE22T | Human | Esophagus | ESCC | 6.24e-05 | 3.60e-01 | 0.068 |
| 29062 | WDR91 | P2T-E | Human | Esophagus | ESCC | 3.24e-07 | 3.38e-02 | 0.1177 |
| 29062 | WDR91 | P4T-E | Human | Esophagus | ESCC | 1.32e-07 | 9.12e-02 | 0.1323 |
| 29062 | WDR91 | P5T-E | Human | Esophagus | ESCC | 3.02e-18 | 3.41e-01 | 0.1327 |
| 29062 | WDR91 | P9T-E | Human | Esophagus | ESCC | 2.44e-05 | 3.03e-02 | 0.1131 |
| 29062 | WDR91 | P10T-E | Human | Esophagus | ESCC | 1.50e-07 | 6.06e-02 | 0.116 |
| 29062 | WDR91 | P11T-E | Human | Esophagus | ESCC | 4.57e-05 | 2.71e-01 | 0.1426 |
| 29062 | WDR91 | P12T-E | Human | Esophagus | ESCC | 3.06e-16 | 2.24e-01 | 0.1122 |
| 29062 | WDR91 | P15T-E | Human | Esophagus | ESCC | 1.68e-22 | 3.85e-01 | 0.1149 |
| 29062 | WDR91 | P16T-E | Human | Esophagus | ESCC | 8.01e-09 | 3.45e-02 | 0.1153 |
| 29062 | WDR91 | P20T-E | Human | Esophagus | ESCC | 2.04e-03 | 2.74e-03 | 0.1124 |
| 29062 | WDR91 | P21T-E | Human | Esophagus | ESCC | 1.79e-16 | 2.12e-01 | 0.1617 |
| 29062 | WDR91 | P22T-E | Human | Esophagus | ESCC | 3.43e-08 | 1.09e-01 | 0.1236 |
| 29062 | WDR91 | P23T-E | Human | Esophagus | ESCC | 4.94e-10 | 1.30e-01 | 0.108 |
| 29062 | WDR91 | P24T-E | Human | Esophagus | ESCC | 2.79e-10 | 9.93e-02 | 0.1287 |
| 29062 | WDR91 | P26T-E | Human | Esophagus | ESCC | 3.09e-05 | 1.23e-01 | 0.1276 |
| 29062 | WDR91 | P27T-E | Human | Esophagus | ESCC | 1.24e-16 | 2.86e-01 | 0.1055 |
| Page: 1 2 3 4 |
| Tissue | Expression Dynamics | Abbreviation |
| Esophagus | 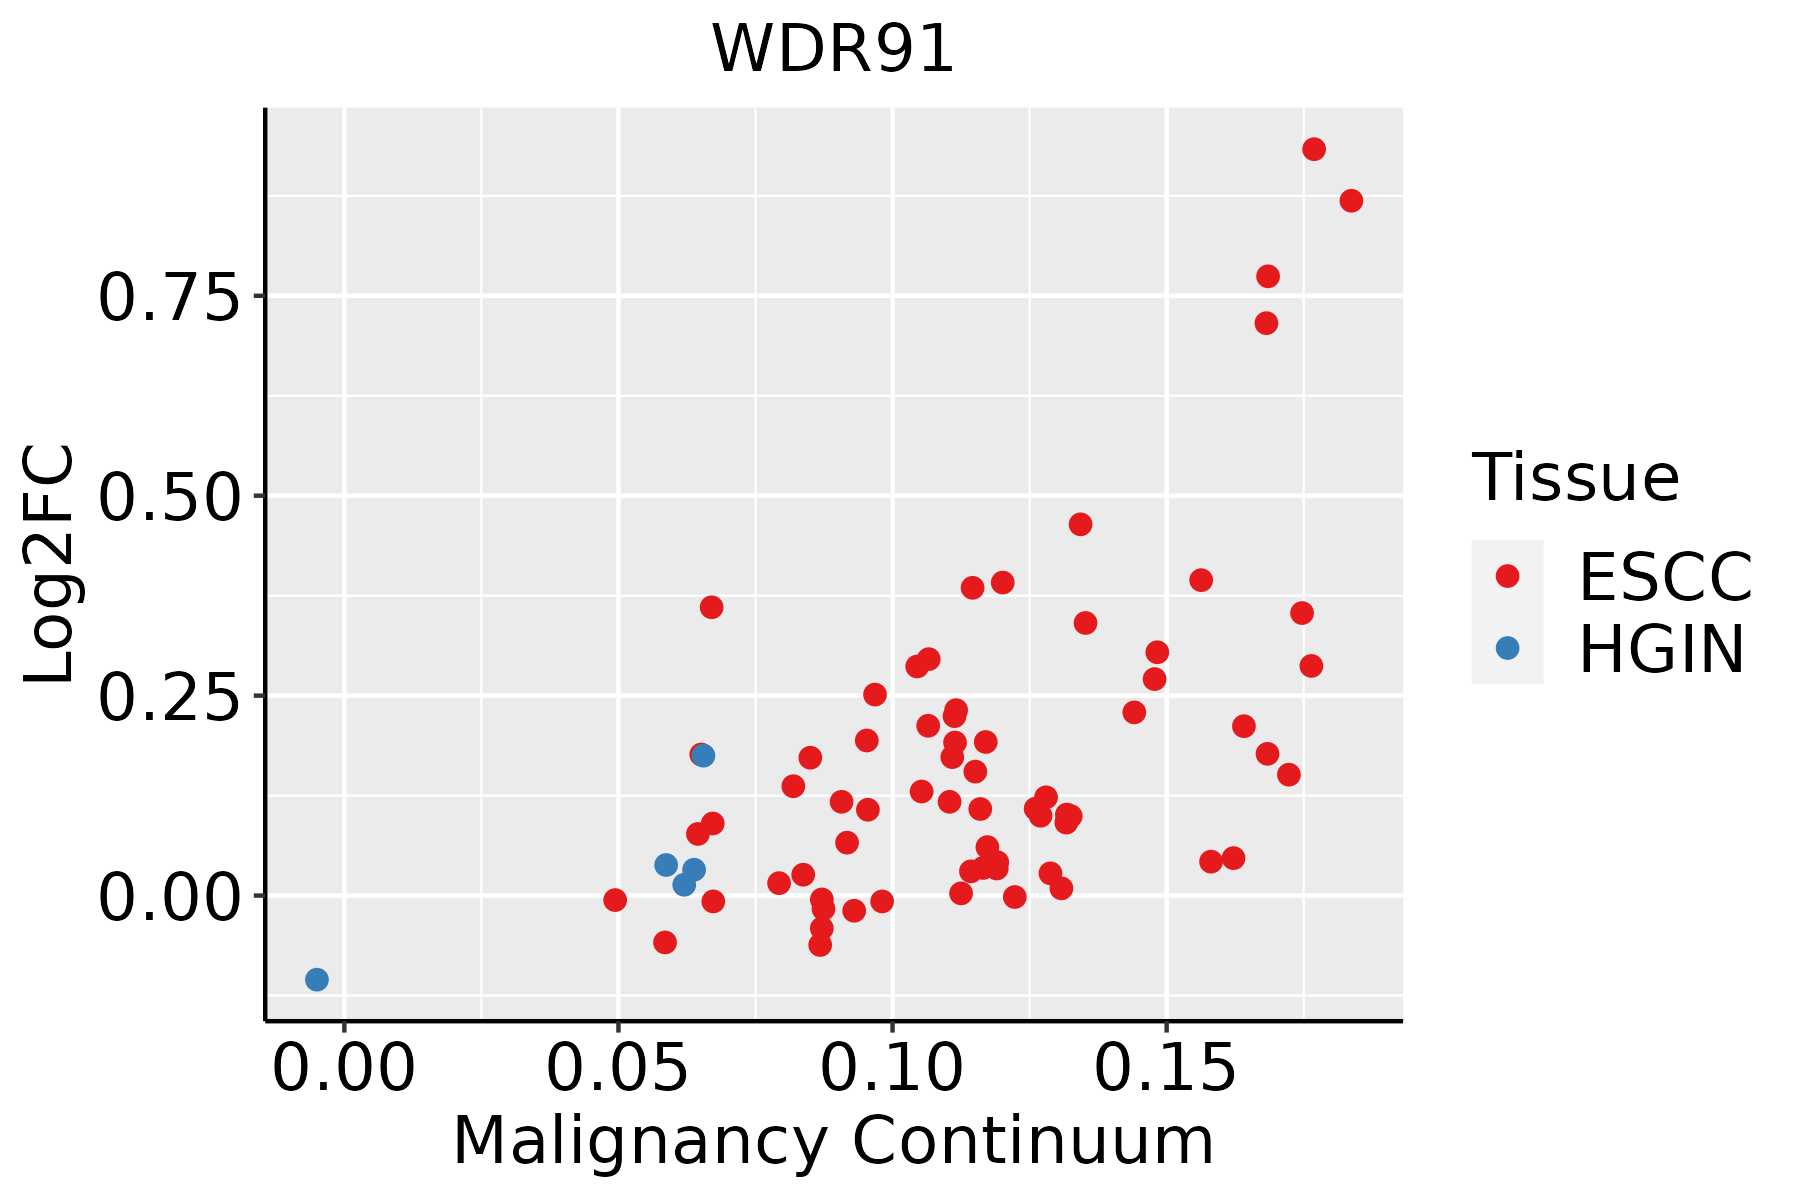 | ESCC: Esophageal squamous cell carcinoma |
| HGIN: High-grade intraepithelial neoplasias | ||
| LGIN: Low-grade intraepithelial neoplasias | ||
| Liver | 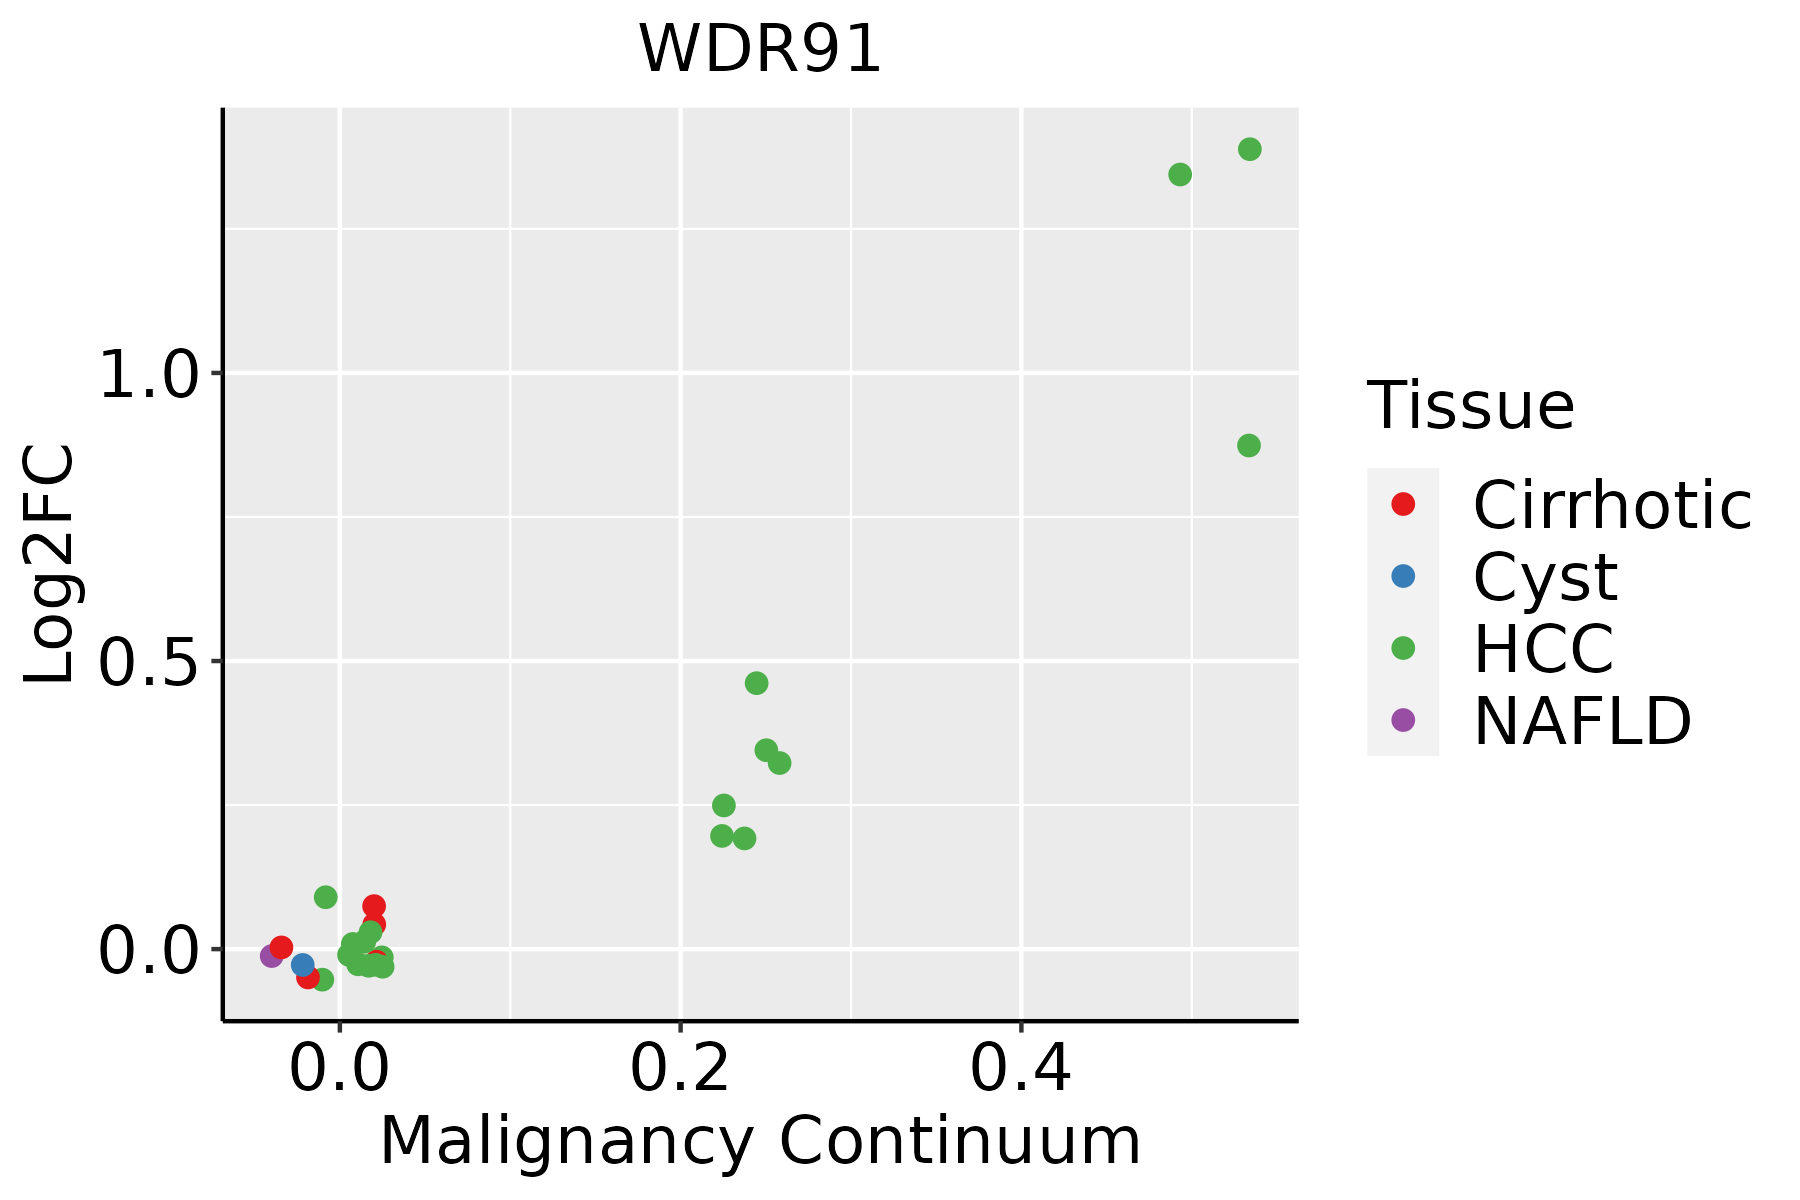 | HCC: Hepatocellular carcinoma |
| NAFLD: Non-alcoholic fatty liver disease | ||
| Oral Cavity | 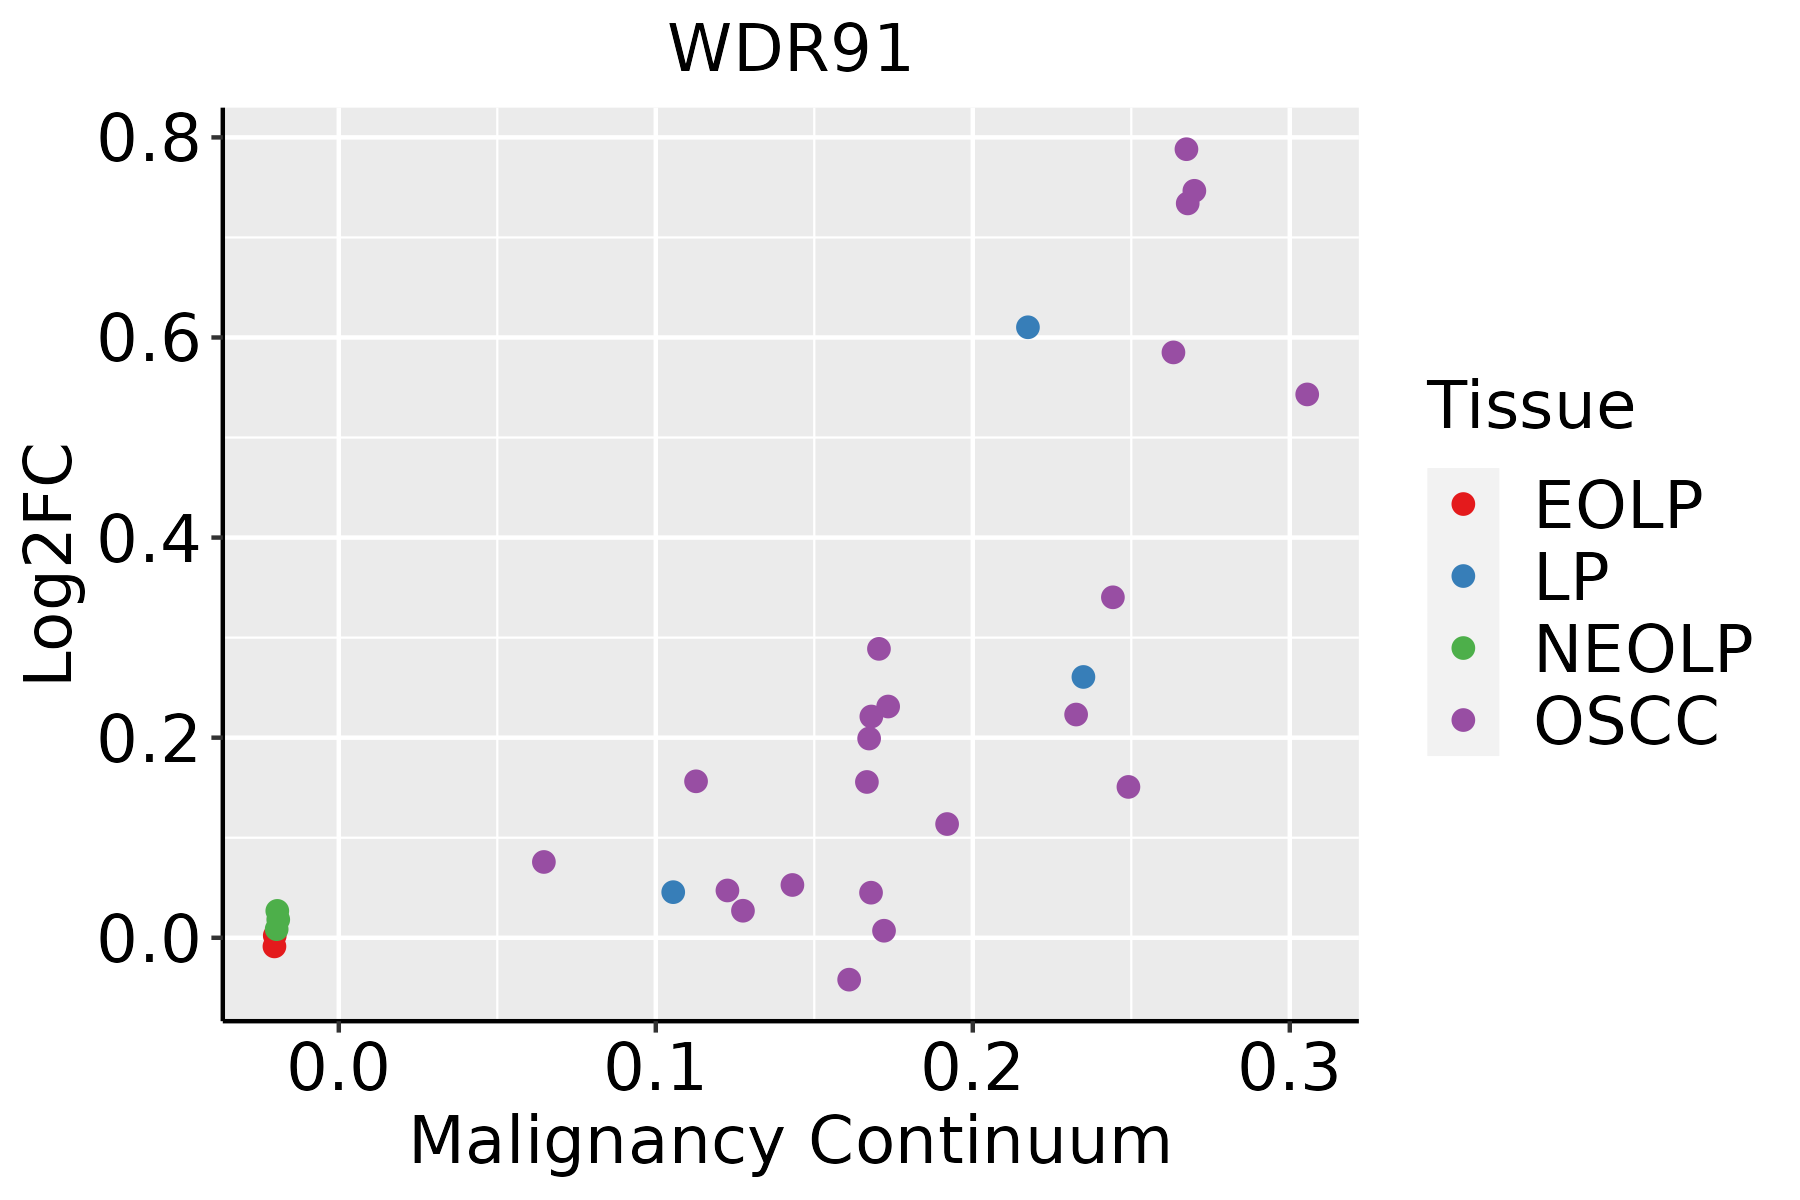 | EOLP: Erosive Oral lichen planus |
| LP: leukoplakia | ||
| NEOLP: Non-erosive oral lichen planus | ||
| OSCC: Oral squamous cell carcinoma |
| ∗log2FC in expression of this searched gene in stem-like cells from each diseased tissue sample relative to stem-like cells in normal samples in each tissue plotted against the malignancy continuum. Samples are colored based on if they are from different disease stage. |
Top |
Malignant transformation related pathway analysis |
| Find out the enriched GO biological processes and KEGG pathways involved in transition from healthy to precancer to cancer |
| Tissue | Disease Stage | Enriched GO biological Processes |
| Colorectum | AD |  |
| Colorectum | SER |  |
| Colorectum | MSS |  |
| Colorectum | MSI-H |  |
| Colorectum | FAP |  |
| ∗Top 15 enriched GO BP terms are showed in the bar plot of each disease state in each tissue. Each row represents a significant GO biological process which is colored according to the -log10(p.adjust). |
| Page: 1 2 3 4 5 6 7 8 9 |
| GO ID | Tissue | Disease Stage | Description | Gene Ratio | Bg Ratio | pvalue | p.adjust | Count |
| GO:0042176111 | Esophagus | ESCC | regulation of protein catabolic process | 280/8552 | 391/18723 | 8.65e-26 | 2.39e-23 | 280 |
| GO:1903362111 | Esophagus | ESCC | regulation of cellular protein catabolic process | 188/8552 | 255/18723 | 5.12e-20 | 6.62e-18 | 188 |
| GO:001648210 | Esophagus | ESCC | cytosolic transport | 124/8552 | 168/18723 | 9.69e-14 | 4.69e-12 | 124 |
| GO:00989278 | Esophagus | ESCC | vesicle-mediated transport between endosomal compartments | 36/8552 | 43/18723 | 2.90e-07 | 4.20e-06 | 36 |
| GO:00450226 | Esophagus | ESCC | early endosome to late endosome transport | 33/8552 | 40/18723 | 1.80e-06 | 2.11e-05 | 33 |
| GO:004217622 | Liver | HCC | regulation of protein catabolic process | 267/7958 | 391/18723 | 2.45e-25 | 7.38e-23 | 267 |
| GO:190336222 | Liver | HCC | regulation of cellular protein catabolic process | 182/7958 | 255/18723 | 5.91e-21 | 8.52e-19 | 182 |
| GO:001648221 | Liver | HCC | cytosolic transport | 117/7958 | 168/18723 | 8.83e-13 | 4.48e-11 | 117 |
| GO:009892711 | Liver | HCC | vesicle-mediated transport between endosomal compartments | 32/7958 | 43/18723 | 2.16e-05 | 2.30e-04 | 32 |
| GO:004502211 | Liver | HCC | early endosome to late endosome transport | 30/7958 | 40/18723 | 3.04e-05 | 3.12e-04 | 30 |
| GO:004217620 | Oral cavity | OSCC | regulation of protein catabolic process | 254/7305 | 391/18723 | 1.07e-25 | 3.22e-23 | 254 |
| GO:190336220 | Oral cavity | OSCC | regulation of cellular protein catabolic process | 174/7305 | 255/18723 | 2.04e-21 | 3.70e-19 | 174 |
| GO:00164829 | Oral cavity | OSCC | cytosolic transport | 106/7305 | 168/18723 | 2.08e-10 | 5.90e-09 | 106 |
| GO:00989277 | Oral cavity | OSCC | vesicle-mediated transport between endosomal compartments | 31/7305 | 43/18723 | 1.10e-05 | 1.14e-04 | 31 |
| GO:00450225 | Oral cavity | OSCC | early endosome to late endosome transport | 28/7305 | 40/18723 | 7.00e-05 | 5.60e-04 | 28 |
| GO:0042176110 | Oral cavity | LP | regulation of protein catabolic process | 177/4623 | 391/18723 | 3.00e-19 | 5.87e-17 | 177 |
| GO:1903362110 | Oral cavity | LP | regulation of cellular protein catabolic process | 119/4623 | 255/18723 | 1.52e-14 | 1.76e-12 | 119 |
| GO:001648214 | Oral cavity | LP | cytosolic transport | 69/4623 | 168/18723 | 2.03e-06 | 4.65e-05 | 69 |
| GO:009892714 | Oral cavity | LP | vesicle-mediated transport between endosomal compartments | 21/4623 | 43/18723 | 5.18e-04 | 4.82e-03 | 21 |
| GO:004502213 | Oral cavity | LP | early endosome to late endosome transport | 19/4623 | 40/18723 | 1.44e-03 | 1.14e-02 | 19 |
| Page: 1 |
| Pathway ID | Tissue | Disease Stage | Description | Gene Ratio | Bg Ratio | pvalue | p.adjust | qvalue | Count |
| Page: 1 |
Top |
Cell-cell communication analysis |
| Identification of potential cell-cell interactions between two cell types and their ligand-receptor pairs for different disease states |
| Ligand | Receptor | LRpair | Pathway | Tissue | Disease Stage |
| Page: 1 |
Top |
Single-cell gene regulatory network inference analysis |
| Find out the significant the regulons (TFs) and the target genes of each regulon across cell types for different disease states |
| TF | Cell Type | Tissue | Disease Stage | Target Gene | RSS | Regulon Activity |
| ∗The dot plots of a searched regulon are shown for all cell subpopulations in each disease state of each tissue based on the regulon specific score inferred using pySCENIC and by calculating the average expression. |
| Page: 1 |
Top |
Somatic mutation of malignant transformation related genes |
| Annotation of somatic variants for genes involved in malignant transformation |
| Hugo Symbol | Variant Class | Variant Classification | dbSNP RS | HGVSc | HGVSp | HGVSp Short | SWISSPROT | BIOTYPE | SIFT | PolyPhen | Tumor Sample Barcode | Tissue | Histology | Sex | Age | Stage | Therapy Types | Drugs | Outcome |
| WDR91 | SNV | Missense_Mutation | c.700A>G | p.Met234Val | p.M234V | A4D1P6 | protein_coding | deleterious(0.04) | benign(0.045) | TCGA-A1-A0SE-01 | Breast | breast invasive carcinoma | Female | <65 | I/II | Unknown | Unknown | SD | |
| WDR91 | SNV | Missense_Mutation | novel | c.171N>A | p.Asp57Glu | p.D57E | A4D1P6 | protein_coding | deleterious(0) | possibly_damaging(0.765) | TCGA-A2-A3XW-01 | Breast | breast invasive carcinoma | Female | <65 | I/II | Chemotherapy | adriamyicin | CR |
| WDR91 | SNV | Missense_Mutation | novel | c.568N>A | p.Glu190Lys | p.E190K | A4D1P6 | protein_coding | deleterious(0.01) | benign(0.135) | TCGA-A8-A08H-01 | Breast | breast invasive carcinoma | Female | >=65 | I/II | Unknown | Unknown | SD |
| WDR91 | SNV | Missense_Mutation | novel | c.691G>A | p.Val231Ile | p.V231I | A4D1P6 | protein_coding | tolerated(0.12) | benign(0.035) | TCGA-D8-A1J8-01 | Breast | breast invasive carcinoma | Female | >=65 | I/II | Hormone Therapy | nolvadex | SD |
| WDR91 | insertion | Frame_Shift_Ins | novel | c.1123_1124insCTGGTCTTGAACTCCTGGCTTCAAGTGATCTGCCCATCTC | p.Glu375AlafsTer25 | p.E375Afs*25 | A4D1P6 | protein_coding | TCGA-A7-A0CJ-01 | Breast | breast invasive carcinoma | Female | <65 | I/II | Chemotherapy | cytoxan | SD | ||
| WDR91 | insertion | In_Frame_Ins | novel | c.1918_1919insCCACAGAATTCTTTTTCTTCCCTGAAAGCTGGCAGCTTTTGT | p.Val640delinsAlaThrGluPhePhePhePheProGluSerTrpGlnLeuLeuLeu | p.V640delinsATEFFFFPESWQLLL | A4D1P6 | protein_coding | TCGA-A8-A07J-01 | Breast | breast invasive carcinoma | Female | <65 | I/II | Chemotherapy | 5-fluorouracil | CR | ||
| WDR91 | insertion | Nonsense_Mutation | novel | c.843_844insTCCCCTCTTTTCTCATAAATTT | p.Pro282SerfsTer6 | p.P282Sfs*6 | A4D1P6 | protein_coding | TCGA-AN-A0FX-01 | Breast | breast invasive carcinoma | Female | <65 | I/II | Unknown | Unknown | SD | ||
| WDR91 | insertion | Nonsense_Mutation | novel | c.19_20insAATTCCAGATGCTCTCTCAAAGATACTAAATGCAGGGCATG | p.Arg7GlnfsTer10 | p.R7Qfs*10 | A4D1P6 | protein_coding | TCGA-AN-A0FX-01 | Breast | breast invasive carcinoma | Female | <65 | I/II | Unknown | Unknown | SD | ||
| WDR91 | insertion | Frame_Shift_Ins | novel | c.1183_1184insTCAAG | p.Pro395LeufsTer34 | p.P395Lfs*34 | A4D1P6 | protein_coding | TCGA-AO-A0J7-01 | Breast | breast invasive carcinoma | Female | >=65 | I/II | Chemotherapy | doxorubicin | SD | ||
| WDR91 | insertion | In_Frame_Ins | novel | c.1181_1182insTCTTGGCTCACTGCAACCTTGCCCTCCCAG | p.Gln394delinsHisLeuGlySerLeuGlnProCysProProArg | p.Q394delinsHLGSLQPCPPR | A4D1P6 | protein_coding | TCGA-AO-A0J7-01 | Breast | breast invasive carcinoma | Female | >=65 | I/II | Chemotherapy | doxorubicin | SD |
| Page: 1 2 3 4 5 6 7 8 9 |
Top |
Related drugs of malignant transformation related genes |
| Identification of chemicals and drugs interact with genes involved in malignant transfromation |
| (DGIdb 4.0) |
| Entrez ID | Symbol | Category | Interaction Types | Drug Claim Name | Drug Name | PMIDs |
| Page: 1 |

Copyright 2023-Present -The University of Texas Health Science Center at Houston |