
|
|||||
|
 | |
| |
| |
| |
| |
| |
|
Gene: WDR83OS |
Gene summary for WDR83OS |
| Gene information | Species | Human | Gene symbol | WDR83OS | Gene ID | 51398 |
| Gene name | WD repeat domain 83 opposite strand | |
| Gene Alias | ASTERIX | |
| Cytomap | 19p13.13 | |
| Gene Type | protein-coding | GO ID | GO:0006457 | UniProtAcc | Q9Y284 |
Top |
Malignant transformation analysis |
| Identification of the aberrant gene expression in precancerous and cancerous lesions by comparing the gene expression of stem-like cells in diseased tissues with normal stem cells |
| Entrez ID | Symbol | Replicates | Species | Organ | Tissue | Adj P-value | Log2FC | Malignancy |
| 51398 | WDR83OS | GSM4909282 | Human | Breast | IDC | 2.23e-24 | 4.86e-01 | -0.0288 |
| 51398 | WDR83OS | GSM4909285 | Human | Breast | IDC | 2.15e-21 | 5.02e-01 | 0.21 |
| 51398 | WDR83OS | GSM4909286 | Human | Breast | IDC | 2.96e-03 | -1.48e-01 | 0.1081 |
| 51398 | WDR83OS | GSM4909290 | Human | Breast | IDC | 3.72e-04 | 3.10e-01 | 0.2096 |
| 51398 | WDR83OS | GSM4909291 | Human | Breast | IDC | 1.09e-11 | 4.25e-01 | 0.1753 |
| 51398 | WDR83OS | GSM4909293 | Human | Breast | IDC | 3.53e-21 | 4.91e-01 | 0.1581 |
| 51398 | WDR83OS | GSM4909294 | Human | Breast | IDC | 1.71e-17 | 8.03e-02 | 0.2022 |
| 51398 | WDR83OS | GSM4909296 | Human | Breast | IDC | 9.09e-20 | 1.92e-01 | 0.1524 |
| 51398 | WDR83OS | GSM4909297 | Human | Breast | IDC | 7.82e-28 | -1.26e-01 | 0.1517 |
| 51398 | WDR83OS | GSM4909298 | Human | Breast | IDC | 1.20e-06 | 2.90e-01 | 0.1551 |
| 51398 | WDR83OS | GSM4909299 | Human | Breast | IDC | 1.01e-03 | 2.13e-01 | 0.035 |
| 51398 | WDR83OS | GSM4909301 | Human | Breast | IDC | 1.76e-10 | 2.61e-01 | 0.1577 |
| 51398 | WDR83OS | GSM4909302 | Human | Breast | IDC | 1.16e-07 | 1.66e-01 | 0.1545 |
| 51398 | WDR83OS | GSM4909304 | Human | Breast | IDC | 3.15e-03 | 3.04e-01 | 0.1636 |
| 51398 | WDR83OS | GSM4909306 | Human | Breast | IDC | 1.55e-15 | 4.41e-01 | 0.1564 |
| 51398 | WDR83OS | GSM4909307 | Human | Breast | IDC | 1.43e-04 | 2.49e-01 | 0.1569 |
| 51398 | WDR83OS | GSM4909308 | Human | Breast | IDC | 4.91e-05 | 2.95e-01 | 0.158 |
| 51398 | WDR83OS | GSM4909309 | Human | Breast | IDC | 8.01e-12 | 9.98e-02 | 0.0483 |
| 51398 | WDR83OS | GSM4909311 | Human | Breast | IDC | 8.63e-58 | -1.92e-01 | 0.1534 |
| 51398 | WDR83OS | GSM4909312 | Human | Breast | IDC | 1.73e-16 | -6.79e-02 | 0.1552 |
| Page: 1 2 3 4 5 6 7 8 9 10 11 12 13 14 15 16 |
| Tissue | Expression Dynamics | Abbreviation |
| Breast | 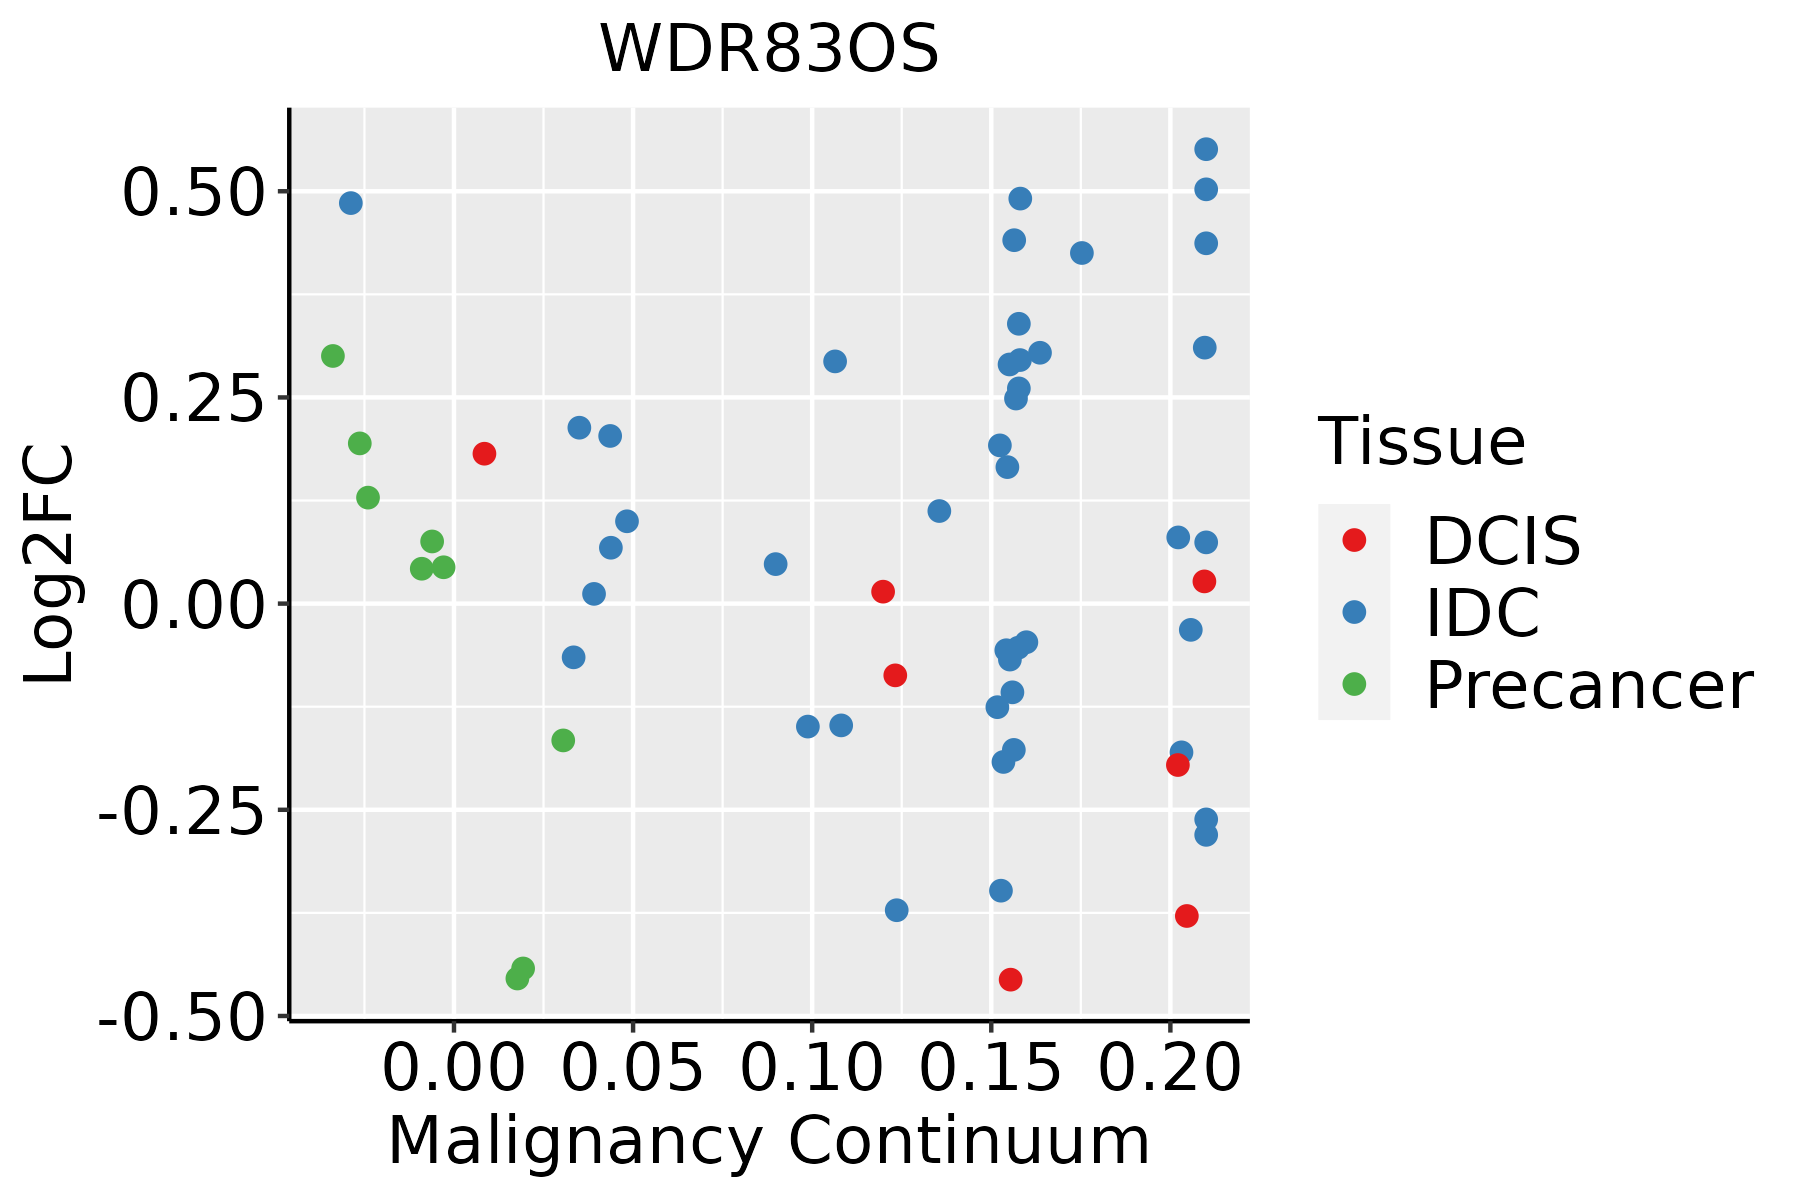 | IDC: Invasive ductal carcinoma |
| DCIS: Ductal carcinoma in situ | ||
| Precancer(BRCA1-mut): Precancerous lesion from BRCA1 mutation carriers | ||
| Cervix |  | CC: Cervix cancer |
| HSIL_HPV: HPV-infected high-grade squamous intraepithelial lesions | ||
| N_HPV: HPV-infected normal cervix | ||
| Colorectum (GSE201348) |  | FAP: Familial adenomatous polyposis |
| CRC: Colorectal cancer | ||
| Colorectum (HTA11) |  | AD: Adenomas |
| SER: Sessile serrated lesions | ||
| MSI-H: Microsatellite-high colorectal cancer | ||
| MSS: Microsatellite stable colorectal cancer | ||
| Endometrium | 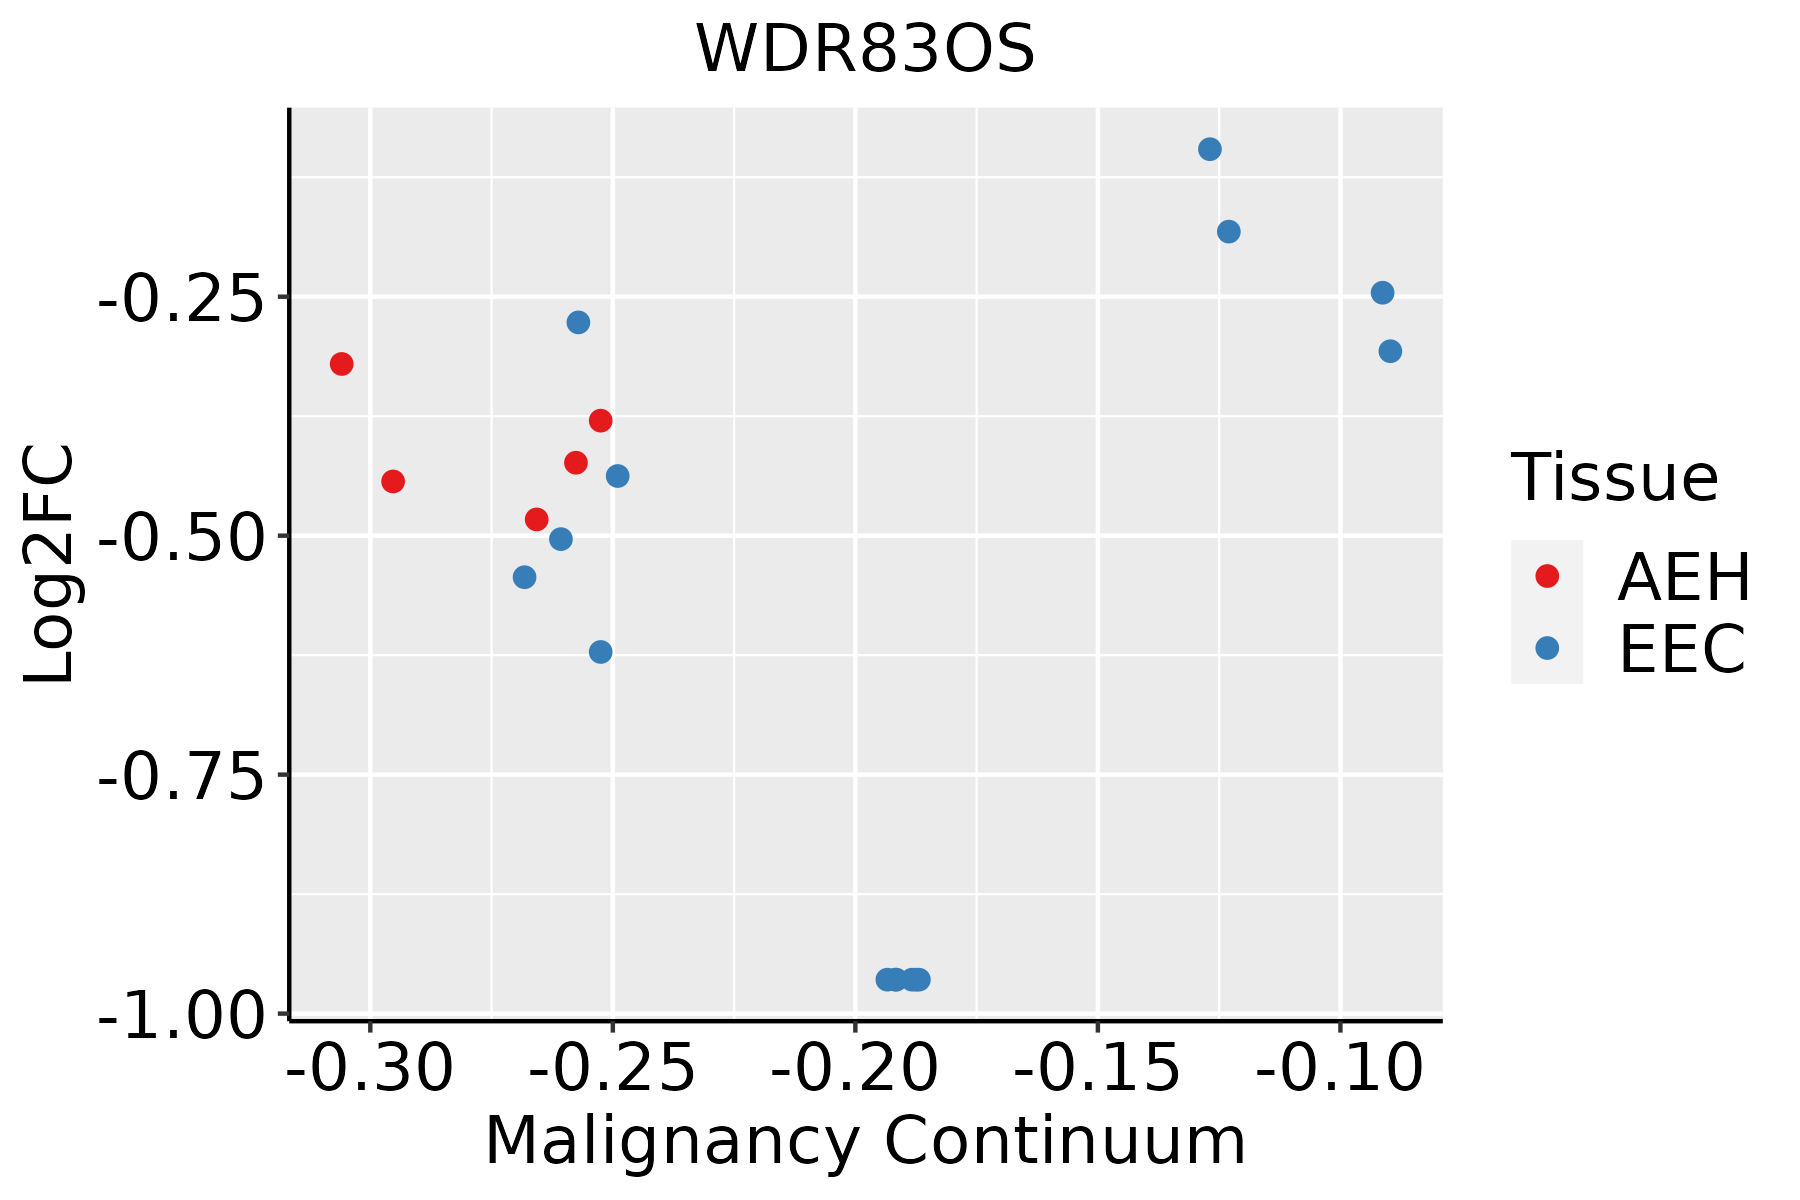 | AEH: Atypical endometrial hyperplasia |
| EEC: Endometrioid Cancer | ||
| Esophagus |  | ESCC: Esophageal squamous cell carcinoma |
| HGIN: High-grade intraepithelial neoplasias | ||
| LGIN: Low-grade intraepithelial neoplasias | ||
| GC |  | CAG: Chronic atrophic gastritis |
| CAG with IM: Chronic atrophic gastritis with intestinal metaplasia | ||
| CSG: Chronic superficial gastritis | ||
| GC: Gastric cancer | ||
| SIM: Severe intestinal metaplasia | ||
| WIM: Wild intestinal metaplasia | ||
| Liver | 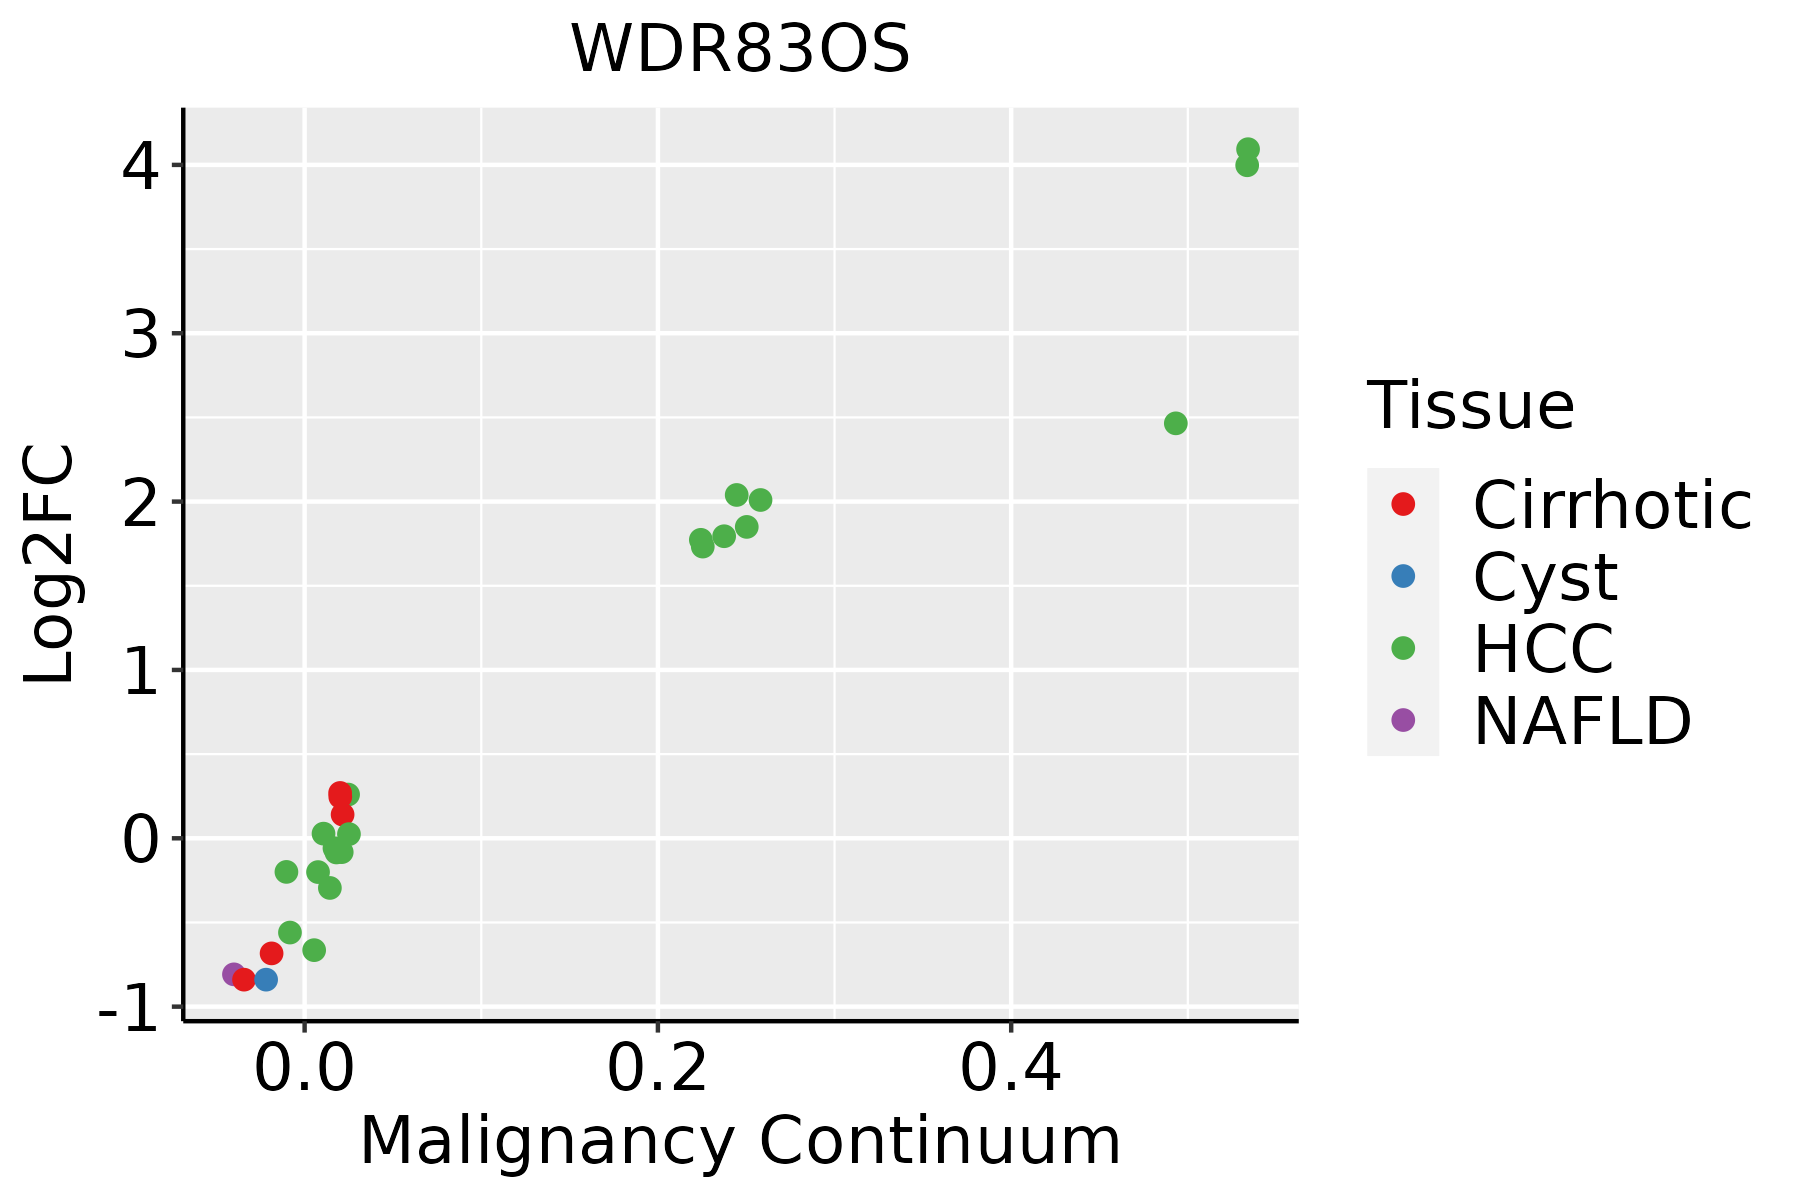 | HCC: Hepatocellular carcinoma |
| NAFLD: Non-alcoholic fatty liver disease | ||
| Lung |  | AAH: Atypical adenomatous hyperplasia |
| AIS: Adenocarcinoma in situ | ||
| IAC: Invasive lung adenocarcinoma | ||
| MIA: Minimally invasive adenocarcinoma | ||
| Oral Cavity | 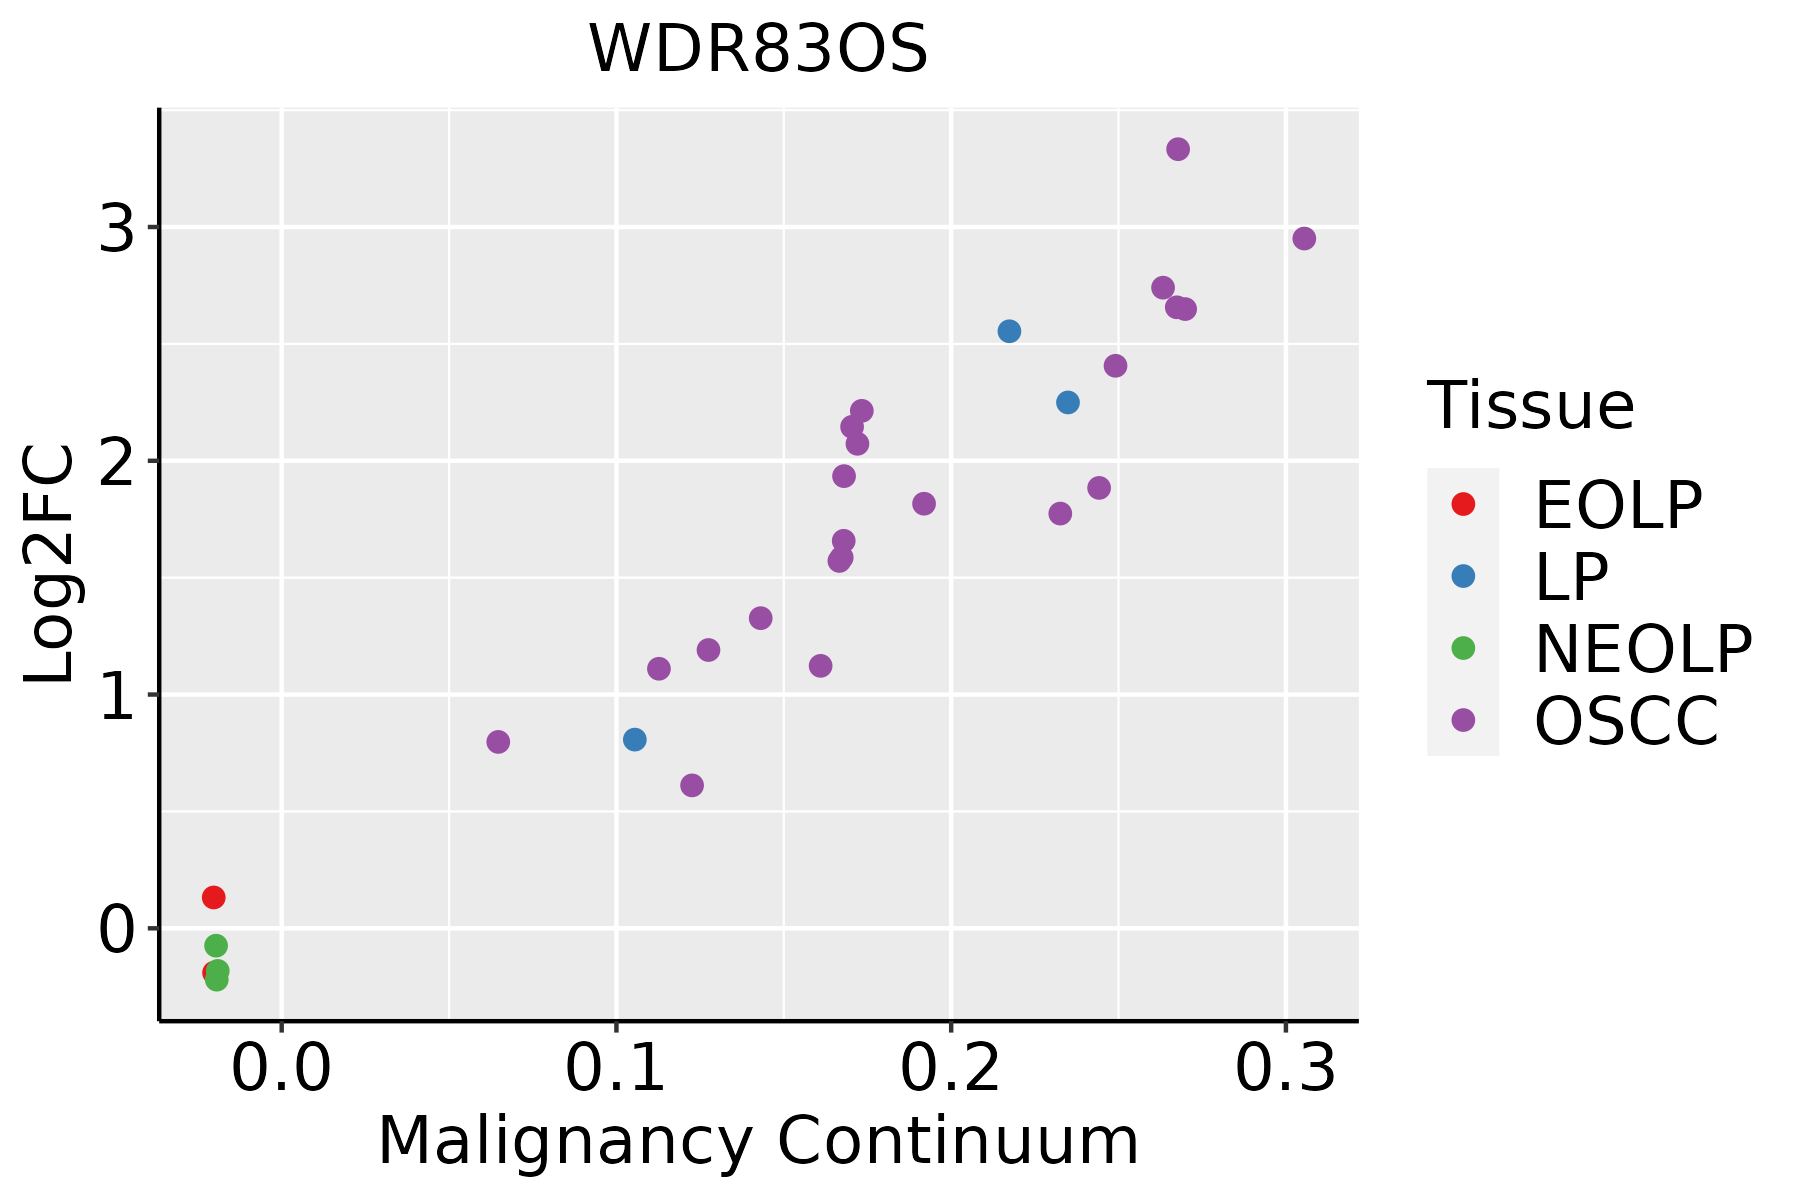 | EOLP: Erosive Oral lichen planus |
| LP: leukoplakia | ||
| NEOLP: Non-erosive oral lichen planus | ||
| OSCC: Oral squamous cell carcinoma | ||
| Prostate |  | BPH: Benign Prostatic Hyperplasia |
| Skin |  | AK: Actinic keratosis |
| cSCC: Cutaneous squamous cell carcinoma | ||
| SCCIS:squamous cell carcinoma in situ | ||
| Thyroid | 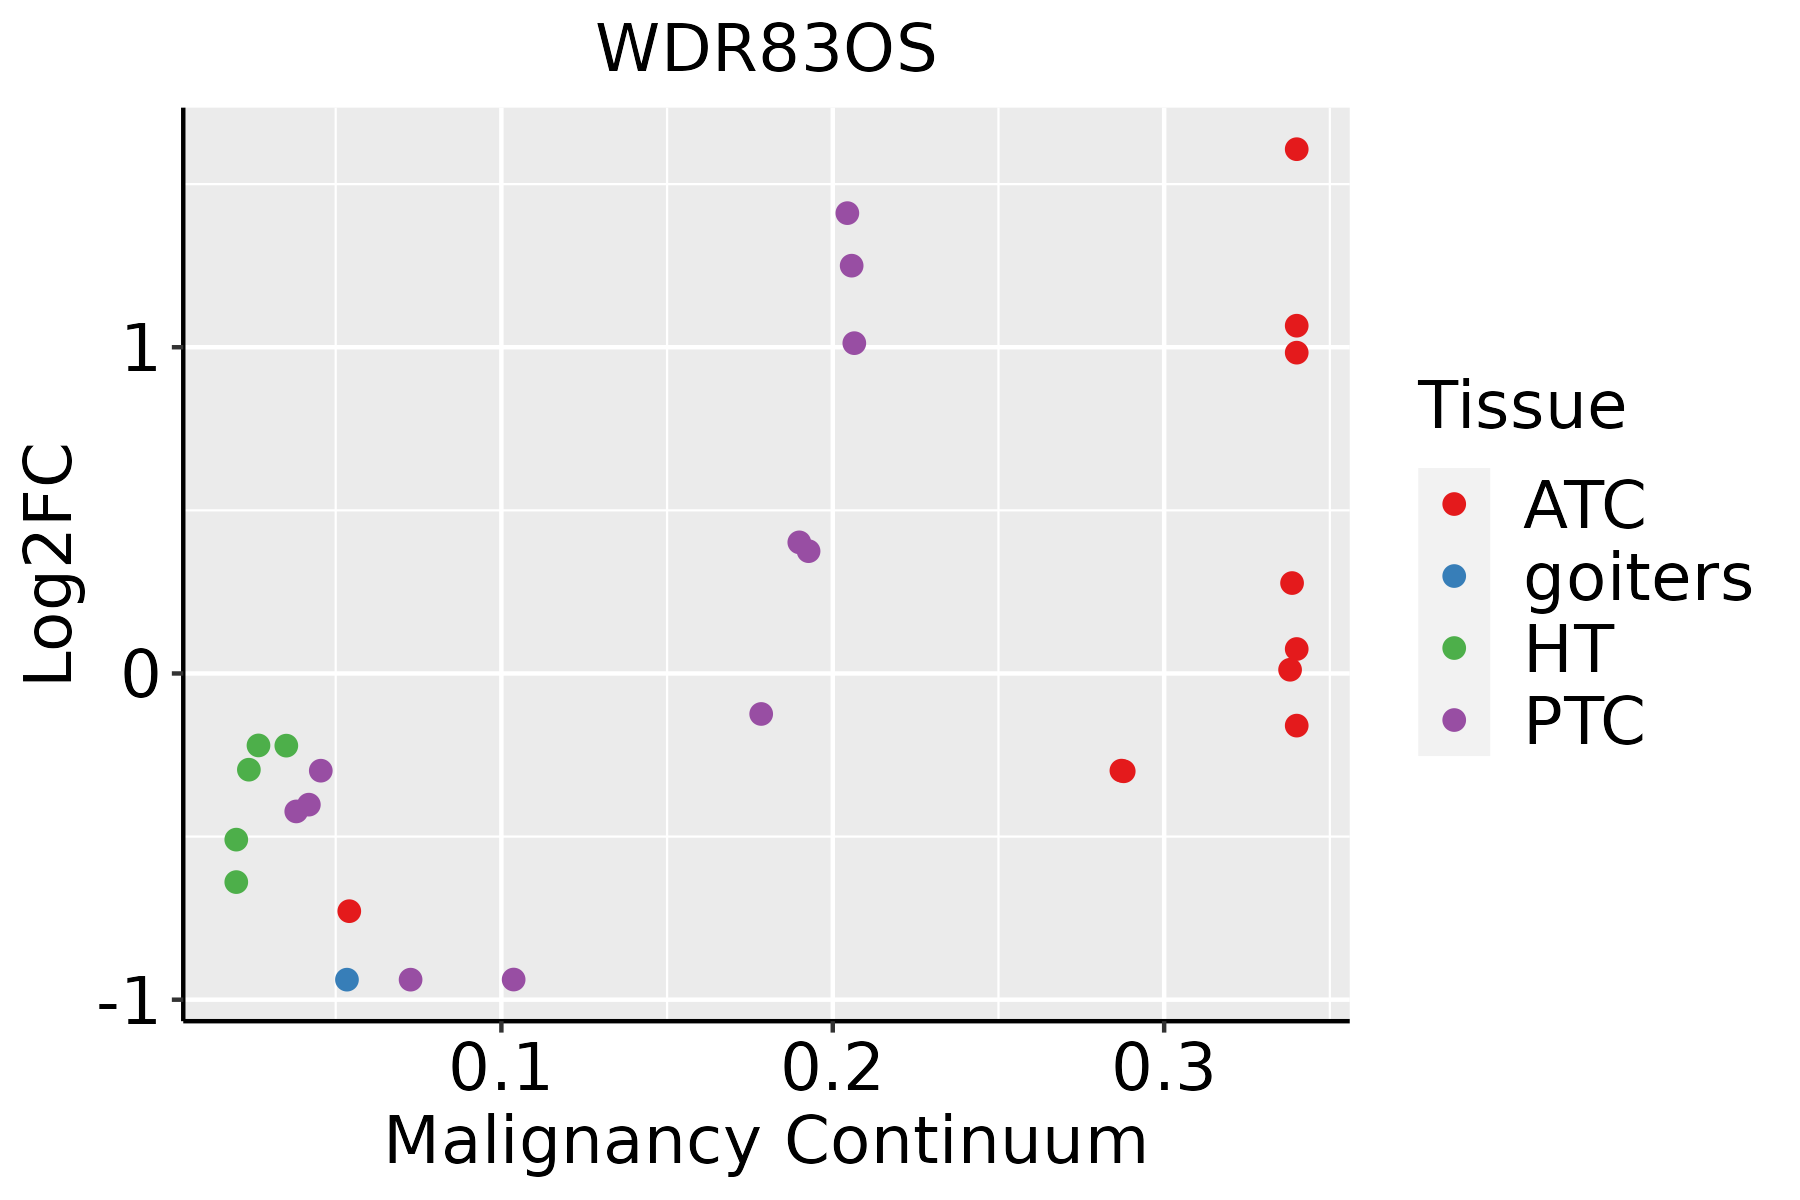 | ATC: Anaplastic thyroid cancer |
| HT: Hashimoto's thyroiditis | ||
| PTC: Papillary thyroid cancer |
| ∗log2FC in expression of this searched gene in stem-like cells from each diseased tissue sample relative to stem-like cells in normal samples in each tissue plotted against the malignancy continuum. Samples are colored based on if they are from different disease stage. |
Top |
Malignant transformation related pathway analysis |
| Find out the enriched GO biological processes and KEGG pathways involved in transition from healthy to precancer to cancer |
| Tissue | Disease Stage | Enriched GO biological Processes |
| Colorectum | AD |  |
| Colorectum | SER |  |
| Colorectum | MSS |  |
| Colorectum | MSI-H |  |
| Colorectum | FAP |  |
| ∗Top 15 enriched GO BP terms are showed in the bar plot of each disease state in each tissue. Each row represents a significant GO biological process which is colored according to the -log10(p.adjust). |
| Page: 1 2 3 4 5 6 7 8 9 |
| GO ID | Tissue | Disease Stage | Description | Gene Ratio | Bg Ratio | pvalue | p.adjust | Count |
| GO:00064578 | Breast | Precancer | protein folding | 43/1080 | 212/18723 | 3.48e-13 | 7.45e-11 | 43 |
| GO:000645713 | Breast | IDC | protein folding | 47/1434 | 212/18723 | 2.31e-11 | 3.86e-09 | 47 |
| GO:000645723 | Breast | DCIS | protein folding | 47/1390 | 212/18723 | 7.84e-12 | 1.53e-09 | 47 |
| GO:00901509 | Cervix | CC | establishment of protein localization to membrane | 54/2311 | 260/18723 | 7.67e-05 | 1.05e-03 | 54 |
| GO:00064579 | Cervix | CC | protein folding | 44/2311 | 212/18723 | 3.43e-04 | 3.59e-03 | 44 |
| GO:000645714 | Cervix | HSIL_HPV | protein folding | 20/737 | 212/18723 | 2.81e-04 | 4.69e-03 | 20 |
| GO:0090150 | Colorectum | AD | establishment of protein localization to membrane | 100/3918 | 260/18723 | 6.01e-11 | 6.33e-09 | 100 |
| GO:0006457 | Colorectum | AD | protein folding | 73/3918 | 212/18723 | 3.24e-06 | 9.10e-05 | 73 |
| GO:0051205 | Colorectum | AD | protein insertion into membrane | 23/3918 | 57/18723 | 6.62e-04 | 6.80e-03 | 23 |
| GO:0007029 | Colorectum | AD | endoplasmic reticulum organization | 31/3918 | 87/18723 | 1.08e-03 | 1.00e-02 | 31 |
| GO:00901501 | Colorectum | SER | establishment of protein localization to membrane | 68/2897 | 260/18723 | 5.55e-06 | 2.01e-04 | 68 |
| GO:00064571 | Colorectum | SER | protein folding | 54/2897 | 212/18723 | 1.04e-04 | 2.18e-03 | 54 |
| GO:00512051 | Colorectum | SER | protein insertion into membrane | 19/2897 | 57/18723 | 6.32e-04 | 8.58e-03 | 19 |
| GO:00070291 | Colorectum | SER | endoplasmic reticulum organization | 23/2897 | 87/18723 | 5.77e-03 | 4.23e-02 | 23 |
| GO:00901502 | Colorectum | MSS | establishment of protein localization to membrane | 90/3467 | 260/18723 | 4.11e-10 | 3.49e-08 | 90 |
| GO:00064572 | Colorectum | MSS | protein folding | 71/3467 | 212/18723 | 1.25e-07 | 5.91e-06 | 71 |
| GO:00512052 | Colorectum | MSS | protein insertion into membrane | 21/3467 | 57/18723 | 8.53e-04 | 8.75e-03 | 21 |
| GO:00064573 | Colorectum | MSI-H | protein folding | 33/1319 | 212/18723 | 1.40e-05 | 6.29e-04 | 33 |
| GO:00901503 | Colorectum | MSI-H | establishment of protein localization to membrane | 32/1319 | 260/18723 | 1.47e-03 | 2.23e-02 | 32 |
| GO:000645710 | Endometrium | AEH | protein folding | 61/2100 | 212/18723 | 1.86e-12 | 3.48e-10 | 61 |
| Page: 1 2 3 4 5 |
| Pathway ID | Tissue | Disease Stage | Description | Gene Ratio | Bg Ratio | pvalue | p.adjust | qvalue | Count |
| Page: 1 |
Top |
Cell-cell communication analysis |
| Identification of potential cell-cell interactions between two cell types and their ligand-receptor pairs for different disease states |
| Ligand | Receptor | LRpair | Pathway | Tissue | Disease Stage |
| Page: 1 |
Top |
Single-cell gene regulatory network inference analysis |
| Find out the significant the regulons (TFs) and the target genes of each regulon across cell types for different disease states |
| TF | Cell Type | Tissue | Disease Stage | Target Gene | RSS | Regulon Activity |
| ∗The dot plots of a searched regulon are shown for all cell subpopulations in each disease state of each tissue based on the regulon specific score inferred using pySCENIC and by calculating the average expression. |
| Page: 1 |
Top |
Somatic mutation of malignant transformation related genes |
| Annotation of somatic variants for genes involved in malignant transformation |
| Hugo Symbol | Variant Class | Variant Classification | dbSNP RS | HGVSc | HGVSp | HGVSp Short | SWISSPROT | BIOTYPE | SIFT | PolyPhen | Tumor Sample Barcode | Tissue | Histology | Sex | Age | Stage | Therapy Types | Drugs | Outcome |
| WDR83OS | SNV | Missense_Mutation | c.290N>C | p.Gln97Pro | p.Q97P | Q9Y284 | protein_coding | deleterious(0.02) | probably_damaging(0.999) | TCGA-BH-A0BP-01 | Breast | breast invasive carcinoma | Female | >=65 | I/II | Unknown | Unknown | SD | |
| WDR83OS | SNV | Missense_Mutation | c.20N>G | p.Ser7Trp | p.S7W | Q9Y284 | protein_coding | deleterious(0) | probably_damaging(0.917) | TCGA-D8-A27G-01 | Breast | breast invasive carcinoma | Female | >=65 | I/II | Unknown | Unknown | SD | |
| WDR83OS | SNV | Missense_Mutation | novel | c.91G>A | p.Asp31Asn | p.D31N | Q9Y284 | protein_coding | tolerated(0.06) | possibly_damaging(0.467) | TCGA-EA-A3HU-01 | Cervix | cervical & endocervical cancer | Female | <65 | I/II | Unknown | Unknown | SD |
| WDR83OS | SNV | Missense_Mutation | novel | c.212N>T | p.Ser71Phe | p.S71F | Q9Y284 | protein_coding | deleterious(0.03) | probably_damaging(0.917) | TCGA-VS-A94Z-01 | Cervix | cervical & endocervical cancer | Female | <65 | I/II | Chemotherapy | cisplatin | CR |
| WDR83OS | SNV | Missense_Mutation | novel | c.146T>C | p.Leu49Pro | p.L49P | Q9Y284 | protein_coding | deleterious(0) | probably_damaging(1) | TCGA-5M-AAT6-01 | Colorectum | colon adenocarcinoma | Female | <65 | III/IV | Unknown | Unknown | PD |
| WDR83OS | SNV | Missense_Mutation | novel | c.166N>G | p.Cys56Gly | p.C56G | Q9Y284 | protein_coding | deleterious(0.03) | possibly_damaging(0.486) | TCGA-AA-3667-01 | Colorectum | colon adenocarcinoma | Female | <65 | I/II | Unknown | Unknown | SD |
| WDR83OS | SNV | Missense_Mutation | rs375244334 | c.308N>T | p.Thr103Met | p.T103M | Q9Y284 | protein_coding | tolerated(0.09) | possibly_damaging(0.696) | TCGA-AX-A0J1-01 | Endometrium | uterine corpus endometrioid carcinoma | Female | >=65 | I/II | Unknown | Unknown | SD |
| WDR83OS | SNV | Missense_Mutation | c.34C>T | p.Pro12Ser | p.P12S | Q9Y284 | protein_coding | tolerated(0.11) | benign(0.011) | TCGA-B5-A0JS-01 | Endometrium | uterine corpus endometrioid carcinoma | Female | <65 | I/II | Unknown | Unknown | SD | |
| WDR83OS | SNV | Missense_Mutation | c.240N>T | p.Met80Ile | p.M80I | Q9Y284 | protein_coding | tolerated(1) | benign(0.003) | TCGA-EY-A1GI-01 | Endometrium | uterine corpus endometrioid carcinoma | Female | <65 | I/II | Unknown | Unknown | SD | |
| WDR83OS | SNV | Missense_Mutation | c.119T>A | p.Leu40Gln | p.L40Q | Q9Y284 | protein_coding | deleterious(0) | probably_damaging(0.995) | TCGA-NJ-A55O-01 | Lung | lung adenocarcinoma | Female | <65 | I/II | Unknown | Unknown | SD |
| Page: 1 2 |
Top |
Related drugs of malignant transformation related genes |
| Identification of chemicals and drugs interact with genes involved in malignant transfromation |
| (DGIdb 4.0) |
| Entrez ID | Symbol | Category | Interaction Types | Drug Claim Name | Drug Name | PMIDs |
| Page: 1 |

Copyright 2023-Present -The University of Texas Health Science Center at Houston |