
|
|||||
|
 | |
| |
| |
| |
| |
| |
|
Gene: WDR83 |
Gene summary for WDR83 |
| Gene information | Species | Human | Gene symbol | WDR83 | Gene ID | 84292 |
| Gene name | WD repeat domain 83 | |
| Gene Alias | MORG1 | |
| Cytomap | 19p13.13 | |
| Gene Type | protein-coding | GO ID | GO:0000375 | UniProtAcc | Q9BRX9 |
Top |
Malignant transformation analysis |
| Identification of the aberrant gene expression in precancerous and cancerous lesions by comparing the gene expression of stem-like cells in diseased tissues with normal stem cells |
| Entrez ID | Symbol | Replicates | Species | Organ | Tissue | Adj P-value | Log2FC | Malignancy |
| 84292 | WDR83 | LZE4T | Human | Esophagus | ESCC | 8.73e-04 | 1.98e-01 | 0.0811 |
| 84292 | WDR83 | LZE7T | Human | Esophagus | ESCC | 4.74e-03 | 1.81e-01 | 0.0667 |
| 84292 | WDR83 | LZE24T | Human | Esophagus | ESCC | 2.33e-10 | 2.96e-01 | 0.0596 |
| 84292 | WDR83 | LZE22D3 | Human | Esophagus | HGIN | 2.13e-02 | 5.00e-01 | 0.0653 |
| 84292 | WDR83 | P1T-E | Human | Esophagus | ESCC | 4.40e-06 | 2.99e-01 | 0.0875 |
| 84292 | WDR83 | P2T-E | Human | Esophagus | ESCC | 2.03e-08 | 1.33e-01 | 0.1177 |
| 84292 | WDR83 | P4T-E | Human | Esophagus | ESCC | 2.24e-12 | 2.14e-01 | 0.1323 |
| 84292 | WDR83 | P5T-E | Human | Esophagus | ESCC | 6.87e-12 | 1.98e-01 | 0.1327 |
| 84292 | WDR83 | P8T-E | Human | Esophagus | ESCC | 5.89e-25 | 4.09e-01 | 0.0889 |
| 84292 | WDR83 | P9T-E | Human | Esophagus | ESCC | 1.47e-06 | 1.94e-01 | 0.1131 |
| 84292 | WDR83 | P10T-E | Human | Esophagus | ESCC | 4.81e-19 | 3.02e-01 | 0.116 |
| 84292 | WDR83 | P11T-E | Human | Esophagus | ESCC | 3.09e-05 | 3.08e-01 | 0.1426 |
| 84292 | WDR83 | P12T-E | Human | Esophagus | ESCC | 3.47e-10 | 2.59e-01 | 0.1122 |
| 84292 | WDR83 | P15T-E | Human | Esophagus | ESCC | 1.21e-08 | 2.22e-01 | 0.1149 |
| 84292 | WDR83 | P16T-E | Human | Esophagus | ESCC | 2.12e-12 | 2.07e-01 | 0.1153 |
| 84292 | WDR83 | P17T-E | Human | Esophagus | ESCC | 1.66e-06 | 3.00e-01 | 0.1278 |
| 84292 | WDR83 | P19T-E | Human | Esophagus | ESCC | 2.97e-05 | 3.91e-01 | 0.1662 |
| 84292 | WDR83 | P20T-E | Human | Esophagus | ESCC | 9.23e-10 | 2.53e-01 | 0.1124 |
| 84292 | WDR83 | P21T-E | Human | Esophagus | ESCC | 1.08e-18 | 3.05e-01 | 0.1617 |
| 84292 | WDR83 | P22T-E | Human | Esophagus | ESCC | 2.84e-14 | 2.43e-01 | 0.1236 |
| Page: 1 2 3 4 |
| Tissue | Expression Dynamics | Abbreviation |
| Esophagus | 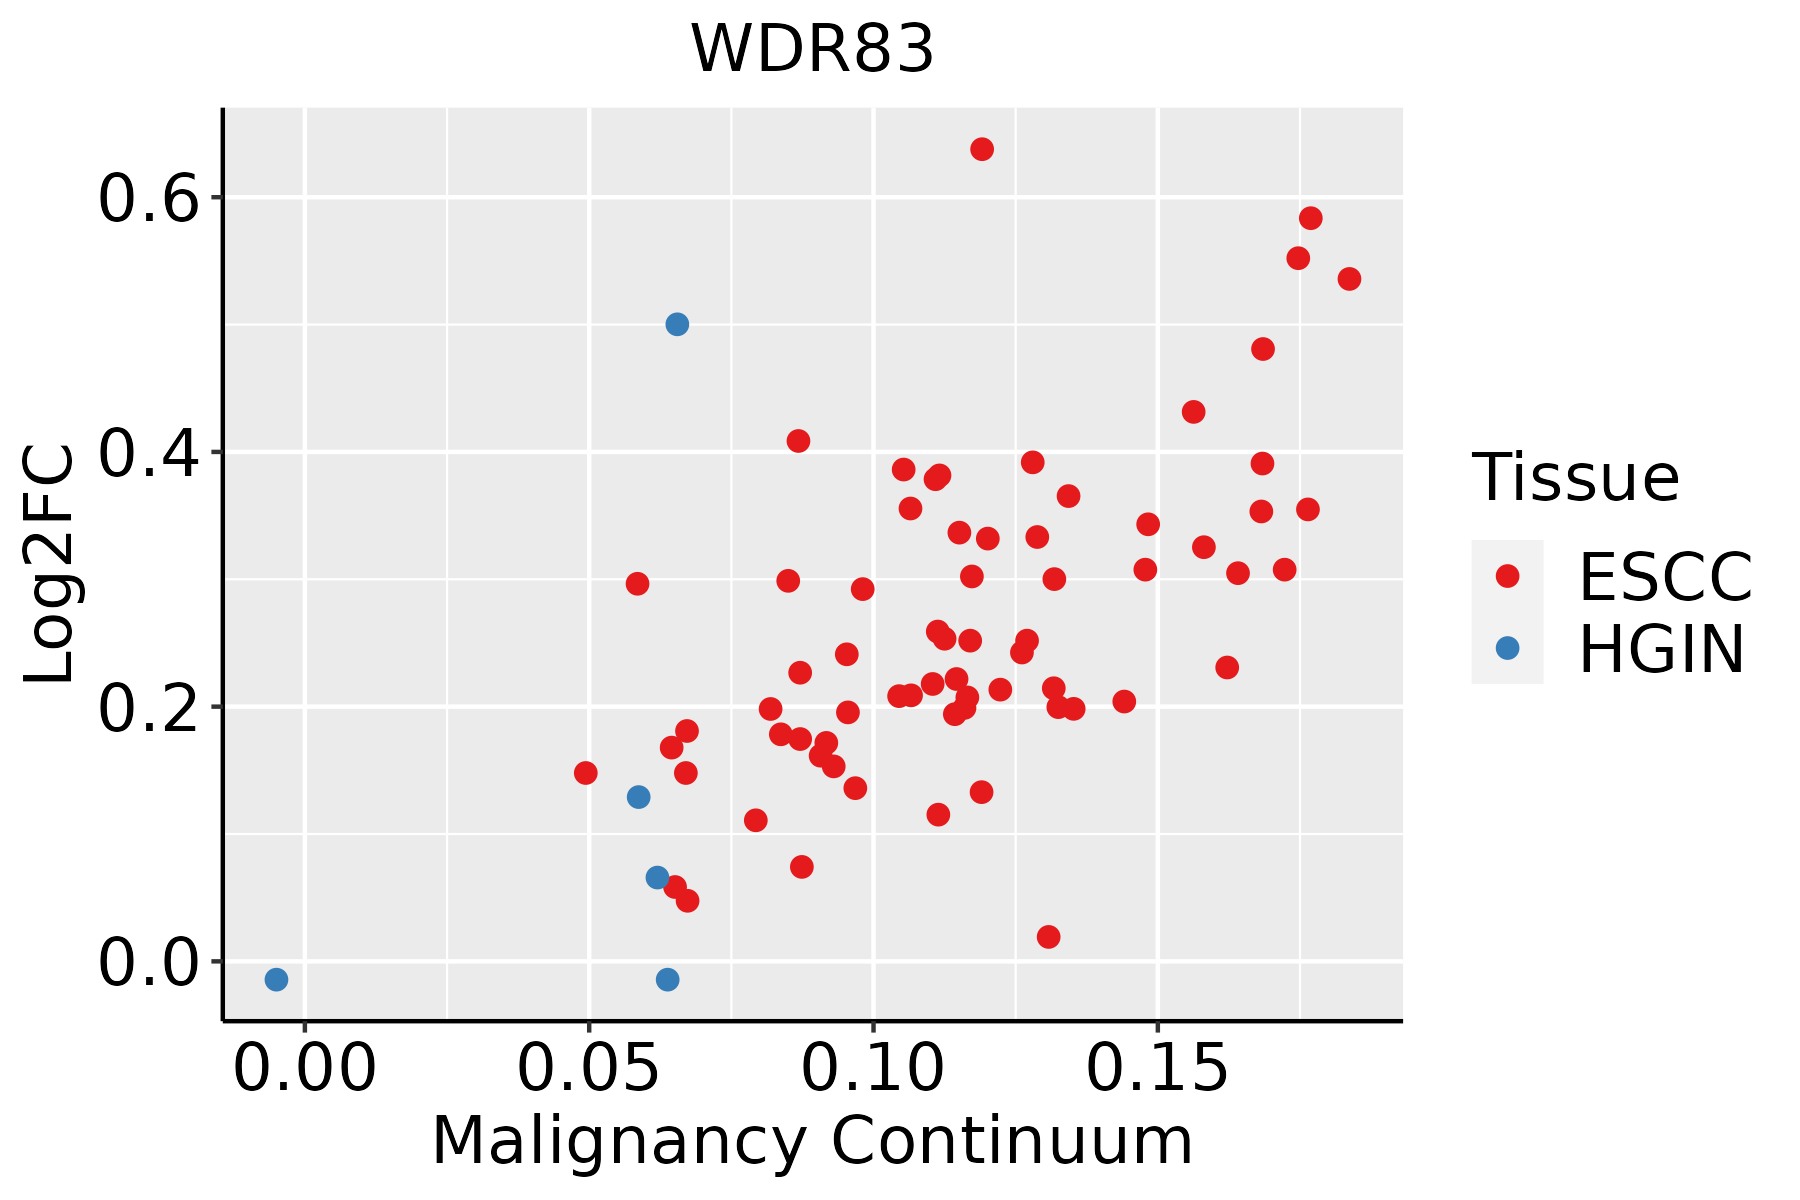 | ESCC: Esophageal squamous cell carcinoma |
| HGIN: High-grade intraepithelial neoplasias | ||
| LGIN: Low-grade intraepithelial neoplasias | ||
| Oral Cavity |  | EOLP: Erosive Oral lichen planus |
| LP: leukoplakia | ||
| NEOLP: Non-erosive oral lichen planus | ||
| OSCC: Oral squamous cell carcinoma |
| ∗log2FC in expression of this searched gene in stem-like cells from each diseased tissue sample relative to stem-like cells in normal samples in each tissue plotted against the malignancy continuum. Samples are colored based on if they are from different disease stage. |
Top |
Malignant transformation related pathway analysis |
| Find out the enriched GO biological processes and KEGG pathways involved in transition from healthy to precancer to cancer |
| Tissue | Disease Stage | Enriched GO biological Processes |
| Colorectum | AD |  |
| Colorectum | SER |  |
| Colorectum | MSS |  |
| Colorectum | MSI-H |  |
| Colorectum | FAP |  |
| ∗Top 15 enriched GO BP terms are showed in the bar plot of each disease state in each tissue. Each row represents a significant GO biological process which is colored according to the -log10(p.adjust). |
| Page: 1 2 3 4 5 6 7 8 9 |
| GO ID | Tissue | Disease Stage | Description | Gene Ratio | Bg Ratio | pvalue | p.adjust | Count |
| GO:00064578 | Breast | Precancer | protein folding | 43/1080 | 212/18723 | 3.48e-13 | 7.45e-11 | 43 |
| GO:000645713 | Breast | IDC | protein folding | 47/1434 | 212/18723 | 2.31e-11 | 3.86e-09 | 47 |
| GO:000645723 | Breast | DCIS | protein folding | 47/1390 | 212/18723 | 7.84e-12 | 1.53e-09 | 47 |
| GO:00901509 | Cervix | CC | establishment of protein localization to membrane | 54/2311 | 260/18723 | 7.67e-05 | 1.05e-03 | 54 |
| GO:00064579 | Cervix | CC | protein folding | 44/2311 | 212/18723 | 3.43e-04 | 3.59e-03 | 44 |
| GO:000645714 | Cervix | HSIL_HPV | protein folding | 20/737 | 212/18723 | 2.81e-04 | 4.69e-03 | 20 |
| GO:0090150 | Colorectum | AD | establishment of protein localization to membrane | 100/3918 | 260/18723 | 6.01e-11 | 6.33e-09 | 100 |
| GO:0006457 | Colorectum | AD | protein folding | 73/3918 | 212/18723 | 3.24e-06 | 9.10e-05 | 73 |
| GO:0051205 | Colorectum | AD | protein insertion into membrane | 23/3918 | 57/18723 | 6.62e-04 | 6.80e-03 | 23 |
| GO:0007029 | Colorectum | AD | endoplasmic reticulum organization | 31/3918 | 87/18723 | 1.08e-03 | 1.00e-02 | 31 |
| GO:00901501 | Colorectum | SER | establishment of protein localization to membrane | 68/2897 | 260/18723 | 5.55e-06 | 2.01e-04 | 68 |
| GO:00064571 | Colorectum | SER | protein folding | 54/2897 | 212/18723 | 1.04e-04 | 2.18e-03 | 54 |
| GO:00512051 | Colorectum | SER | protein insertion into membrane | 19/2897 | 57/18723 | 6.32e-04 | 8.58e-03 | 19 |
| GO:00070291 | Colorectum | SER | endoplasmic reticulum organization | 23/2897 | 87/18723 | 5.77e-03 | 4.23e-02 | 23 |
| GO:00901502 | Colorectum | MSS | establishment of protein localization to membrane | 90/3467 | 260/18723 | 4.11e-10 | 3.49e-08 | 90 |
| GO:00064572 | Colorectum | MSS | protein folding | 71/3467 | 212/18723 | 1.25e-07 | 5.91e-06 | 71 |
| GO:00512052 | Colorectum | MSS | protein insertion into membrane | 21/3467 | 57/18723 | 8.53e-04 | 8.75e-03 | 21 |
| GO:00064573 | Colorectum | MSI-H | protein folding | 33/1319 | 212/18723 | 1.40e-05 | 6.29e-04 | 33 |
| GO:00901503 | Colorectum | MSI-H | establishment of protein localization to membrane | 32/1319 | 260/18723 | 1.47e-03 | 2.23e-02 | 32 |
| GO:000645710 | Endometrium | AEH | protein folding | 61/2100 | 212/18723 | 1.86e-12 | 3.48e-10 | 61 |
| Page: 1 2 3 4 5 6 |
| Pathway ID | Tissue | Disease Stage | Description | Gene Ratio | Bg Ratio | pvalue | p.adjust | qvalue | Count |
| Page: 1 |
Top |
Cell-cell communication analysis |
| Identification of potential cell-cell interactions between two cell types and their ligand-receptor pairs for different disease states |
| Ligand | Receptor | LRpair | Pathway | Tissue | Disease Stage |
| Page: 1 |
Top |
Single-cell gene regulatory network inference analysis |
| Find out the significant the regulons (TFs) and the target genes of each regulon across cell types for different disease states |
| TF | Cell Type | Tissue | Disease Stage | Target Gene | RSS | Regulon Activity |
| ∗The dot plots of a searched regulon are shown for all cell subpopulations in each disease state of each tissue based on the regulon specific score inferred using pySCENIC and by calculating the average expression. |
| Page: 1 |
Top |
Somatic mutation of malignant transformation related genes |
| Annotation of somatic variants for genes involved in malignant transformation |
| Hugo Symbol | Variant Class | Variant Classification | dbSNP RS | HGVSc | HGVSp | HGVSp Short | SWISSPROT | BIOTYPE | SIFT | PolyPhen | Tumor Sample Barcode | Tissue | Histology | Sex | Age | Stage | Therapy Types | Drugs | Outcome |
| WDR83 | SNV | Missense_Mutation | c.679N>T | p.Gly227Cys | p.G227C | Q9BRX9 | protein_coding | deleterious(0) | probably_damaging(0.996) | TCGA-A8-A09I-01 | Breast | breast invasive carcinoma | Female | >=65 | I/II | Hormone Therapy | anastrozole | SD | |
| WDR83 | SNV | Missense_Mutation | c.451N>A | p.Glu151Lys | p.E151K | Q9BRX9 | protein_coding | deleterious(0.01) | possibly_damaging(0.876) | TCGA-C5-A1BK-01 | Cervix | cervical & endocervical cancer | Female | <65 | I/II | Unknown | Unknown | SD | |
| WDR83 | SNV | Missense_Mutation | c.314N>C | p.Phe105Ser | p.F105S | Q9BRX9 | protein_coding | deleterious(0) | benign(0.129) | TCGA-A5-A0GP-01 | Endometrium | uterine corpus endometrioid carcinoma | Female | <65 | I/II | Unknown | Unknown | SD | |
| WDR83 | SNV | Missense_Mutation | novel | c.425N>C | p.Arg142Thr | p.R142T | Q9BRX9 | protein_coding | tolerated(0.27) | benign(0.001) | TCGA-AJ-A3NG-01 | Endometrium | uterine corpus endometrioid carcinoma | Female | >=65 | I/II | Unknown | Unknown | SD |
| WDR83 | SNV | Missense_Mutation | c.802G>C | p.Ala268Pro | p.A268P | Q9BRX9 | protein_coding | tolerated(0.13) | benign(0.012) | TCGA-D1-A15X-01 | Endometrium | uterine corpus endometrioid carcinoma | Female | <65 | I/II | Unknown | Unknown | SD | |
| WDR83 | SNV | Missense_Mutation | novel | c.480N>T | p.Lys160Asn | p.K160N | Q9BRX9 | protein_coding | tolerated(0.41) | benign(0.24) | TCGA-D1-A1NY-01 | Endometrium | uterine corpus endometrioid carcinoma | Female | >=65 | I/II | Chemotherapy | carboplatin | SD |
| WDR83 | SNV | Missense_Mutation | novel | c.326N>T | p.Ala109Val | p.A109V | Q9BRX9 | protein_coding | tolerated(0.09) | benign(0.031) | TCGA-DF-A2KU-01 | Endometrium | uterine corpus endometrioid carcinoma | Female | Unknown | I/II | Unknown | Unknown | SD |
| WDR83 | SNV | Missense_Mutation | novel | c.416N>A | p.Arg139His | p.R139H | Q9BRX9 | protein_coding | deleterious(0) | probably_damaging(0.974) | TCGA-DF-A2KV-01 | Endometrium | uterine corpus endometrioid carcinoma | Female | <65 | I/II | Unknown | Unknown | SD |
| WDR83 | SNV | Missense_Mutation | novel | c.22N>T | p.Pro8Ser | p.P8S | Q9BRX9 | protein_coding | tolerated_low_confidence(0.07) | benign(0.115) | TCGA-FI-A2D0-01 | Endometrium | uterine corpus endometrioid carcinoma | Female | <65 | I/II | Unknown | Unknown | SD |
| WDR83 | insertion | Frame_Shift_Ins | rs751812756 | c.74_75insG | p.Ala27GlyfsTer8 | p.A27Gfs*8 | Q9BRX9 | protein_coding | TCGA-DI-A1BU-01 | Endometrium | uterine corpus endometrioid carcinoma | Female | <65 | I/II | Chemotherapy | paclitaxel | SD |
| Page: 1 2 |
Top |
Related drugs of malignant transformation related genes |
| Identification of chemicals and drugs interact with genes involved in malignant transfromation |
| (DGIdb 4.0) |
| Entrez ID | Symbol | Category | Interaction Types | Drug Claim Name | Drug Name | PMIDs |
| Page: 1 |

Copyright 2023-Present -The University of Texas Health Science Center at Houston |