
|
|||||
|
 | |
| |
| |
| |
| |
| |
|
Gene: WDR82 |
Gene summary for WDR82 |
| Gene information | Species | Human | Gene symbol | WDR82 | Gene ID | 80335 |
| Gene name | WD repeat domain 82 | |
| Gene Alias | MST107 | |
| Cytomap | 3p21.2 | |
| Gene Type | protein-coding | GO ID | GO:0006464 | UniProtAcc | A0A024R333 |
Top |
Malignant transformation analysis |
| Identification of the aberrant gene expression in precancerous and cancerous lesions by comparing the gene expression of stem-like cells in diseased tissues with normal stem cells |
| Entrez ID | Symbol | Replicates | Species | Organ | Tissue | Adj P-value | Log2FC | Malignancy |
| 80335 | WDR82 | HTA11_347_2000001011 | Human | Colorectum | AD | 1.32e-14 | 5.38e-01 | -0.1954 |
| 80335 | WDR82 | HTA11_83_2000001011 | Human | Colorectum | SER | 4.18e-02 | 3.00e-01 | -0.1526 |
| 80335 | WDR82 | HTA11_696_2000001011 | Human | Colorectum | AD | 1.86e-03 | 3.19e-01 | -0.1464 |
| 80335 | WDR82 | HTA11_1391_2000001011 | Human | Colorectum | AD | 5.08e-07 | 4.40e-01 | -0.059 |
| 80335 | WDR82 | HTA11_866_3004761011 | Human | Colorectum | AD | 1.34e-02 | 3.01e-01 | 0.096 |
| 80335 | WDR82 | HTA11_99999971662_82457 | Human | Colorectum | MSS | 1.15e-11 | 5.62e-01 | 0.3859 |
| 80335 | WDR82 | A015-C-203 | Human | Colorectum | FAP | 1.57e-03 | -9.85e-02 | -0.1294 |
| 80335 | WDR82 | A002-C-205 | Human | Colorectum | FAP | 1.58e-02 | -7.25e-02 | -0.1236 |
| 80335 | WDR82 | A015-C-104 | Human | Colorectum | FAP | 3.20e-03 | -1.20e-01 | -0.1899 |
| 80335 | WDR82 | A002-C-116 | Human | Colorectum | FAP | 2.80e-04 | -6.70e-02 | -0.0452 |
| 80335 | WDR82 | A018-E-020 | Human | Colorectum | FAP | 2.62e-02 | -8.61e-02 | -0.2034 |
| 80335 | WDR82 | HCC1_Meng | Human | Liver | HCC | 4.12e-50 | 2.75e-02 | 0.0246 |
| 80335 | WDR82 | HCC2_Meng | Human | Liver | HCC | 3.25e-16 | 4.29e-04 | 0.0107 |
| 80335 | WDR82 | HCC1 | Human | Liver | HCC | 1.15e-10 | 3.21e+00 | 0.5336 |
| 80335 | WDR82 | HCC2 | Human | Liver | HCC | 1.81e-30 | 4.15e+00 | 0.5341 |
| 80335 | WDR82 | HCC5 | Human | Liver | HCC | 1.64e-11 | 2.98e+00 | 0.4932 |
| 80335 | WDR82 | Pt13.b | Human | Liver | HCC | 1.24e-02 | 2.11e-02 | 0.0251 |
| 80335 | WDR82 | S014 | Human | Liver | HCC | 1.46e-17 | 7.42e-01 | 0.2254 |
| 80335 | WDR82 | S015 | Human | Liver | HCC | 3.90e-09 | 6.54e-01 | 0.2375 |
| 80335 | WDR82 | S016 | Human | Liver | HCC | 1.25e-17 | 8.16e-01 | 0.2243 |
| Page: 1 2 3 4 5 |
| Tissue | Expression Dynamics | Abbreviation |
| Colorectum (GSE201348) | 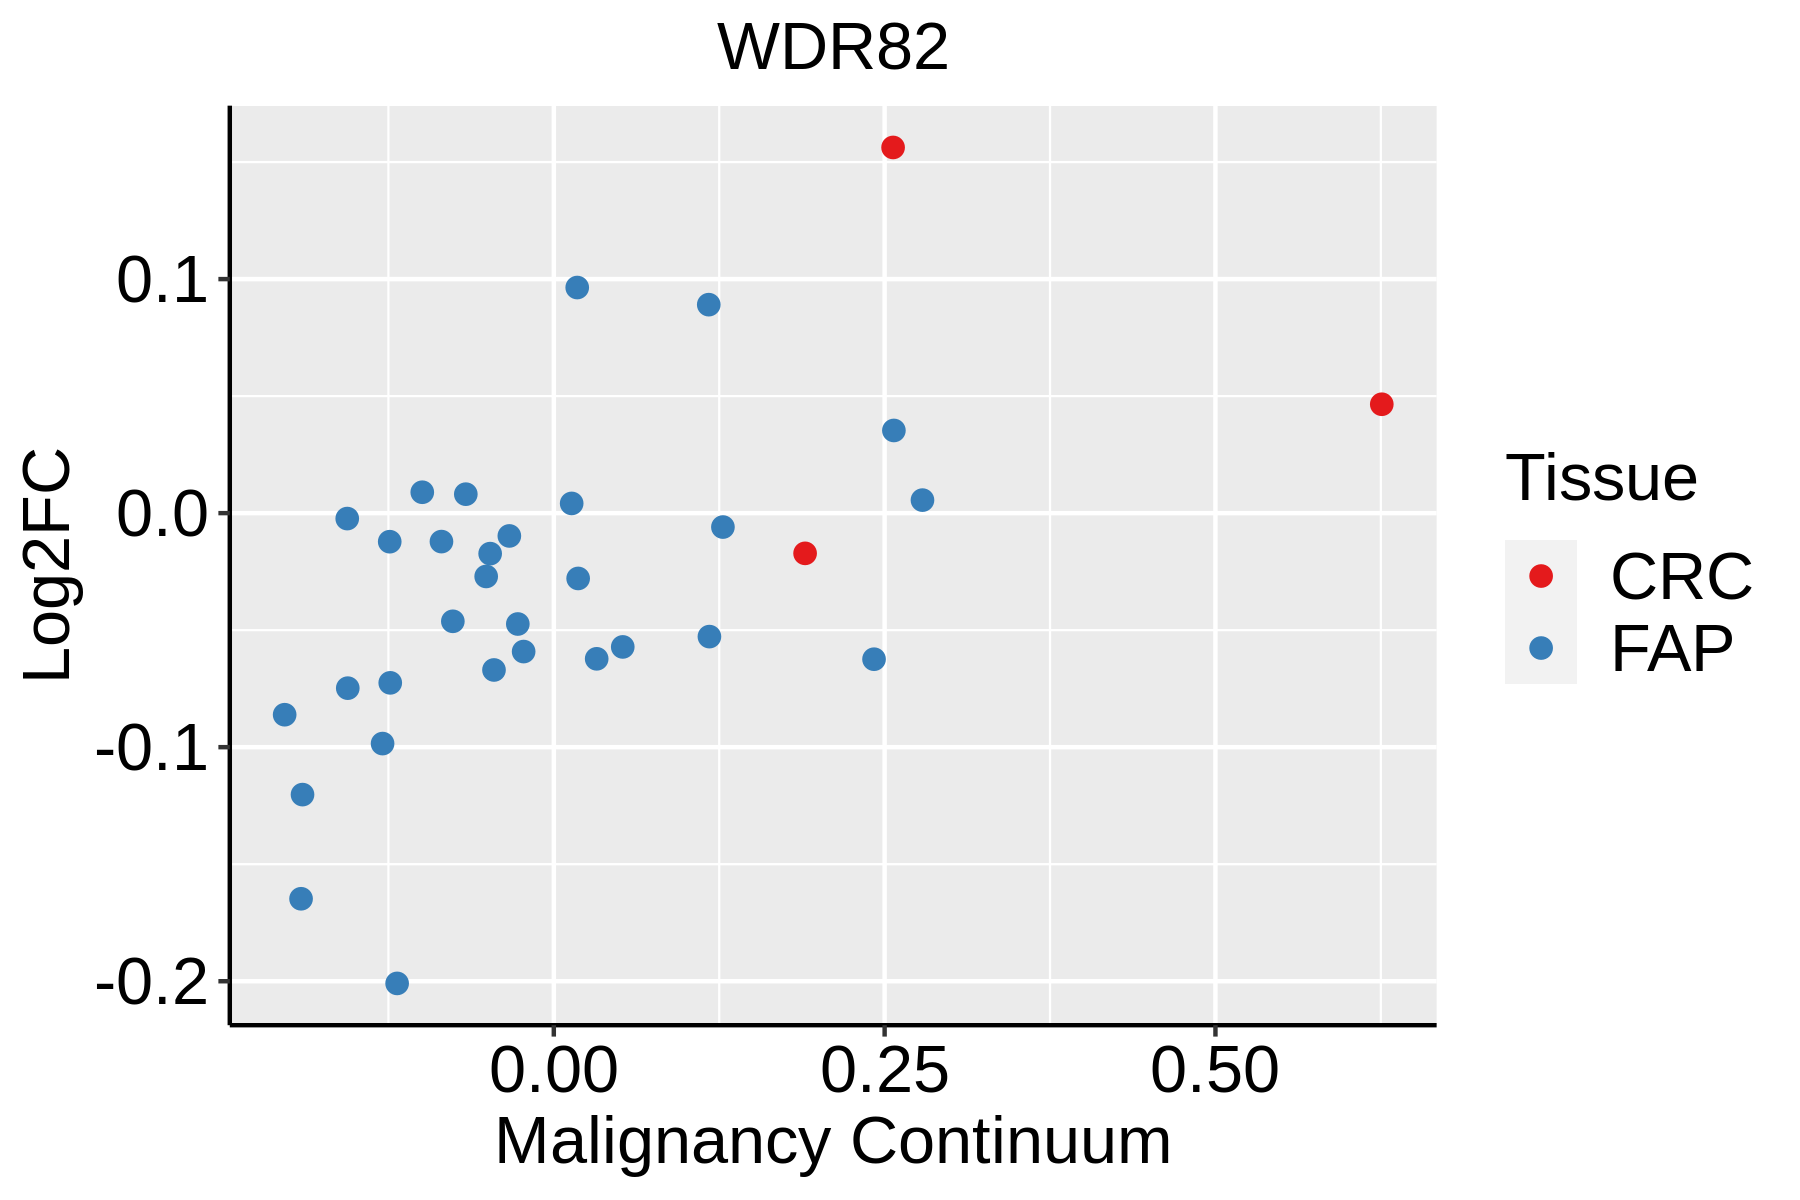 | FAP: Familial adenomatous polyposis |
| CRC: Colorectal cancer | ||
| Colorectum (HTA11) | 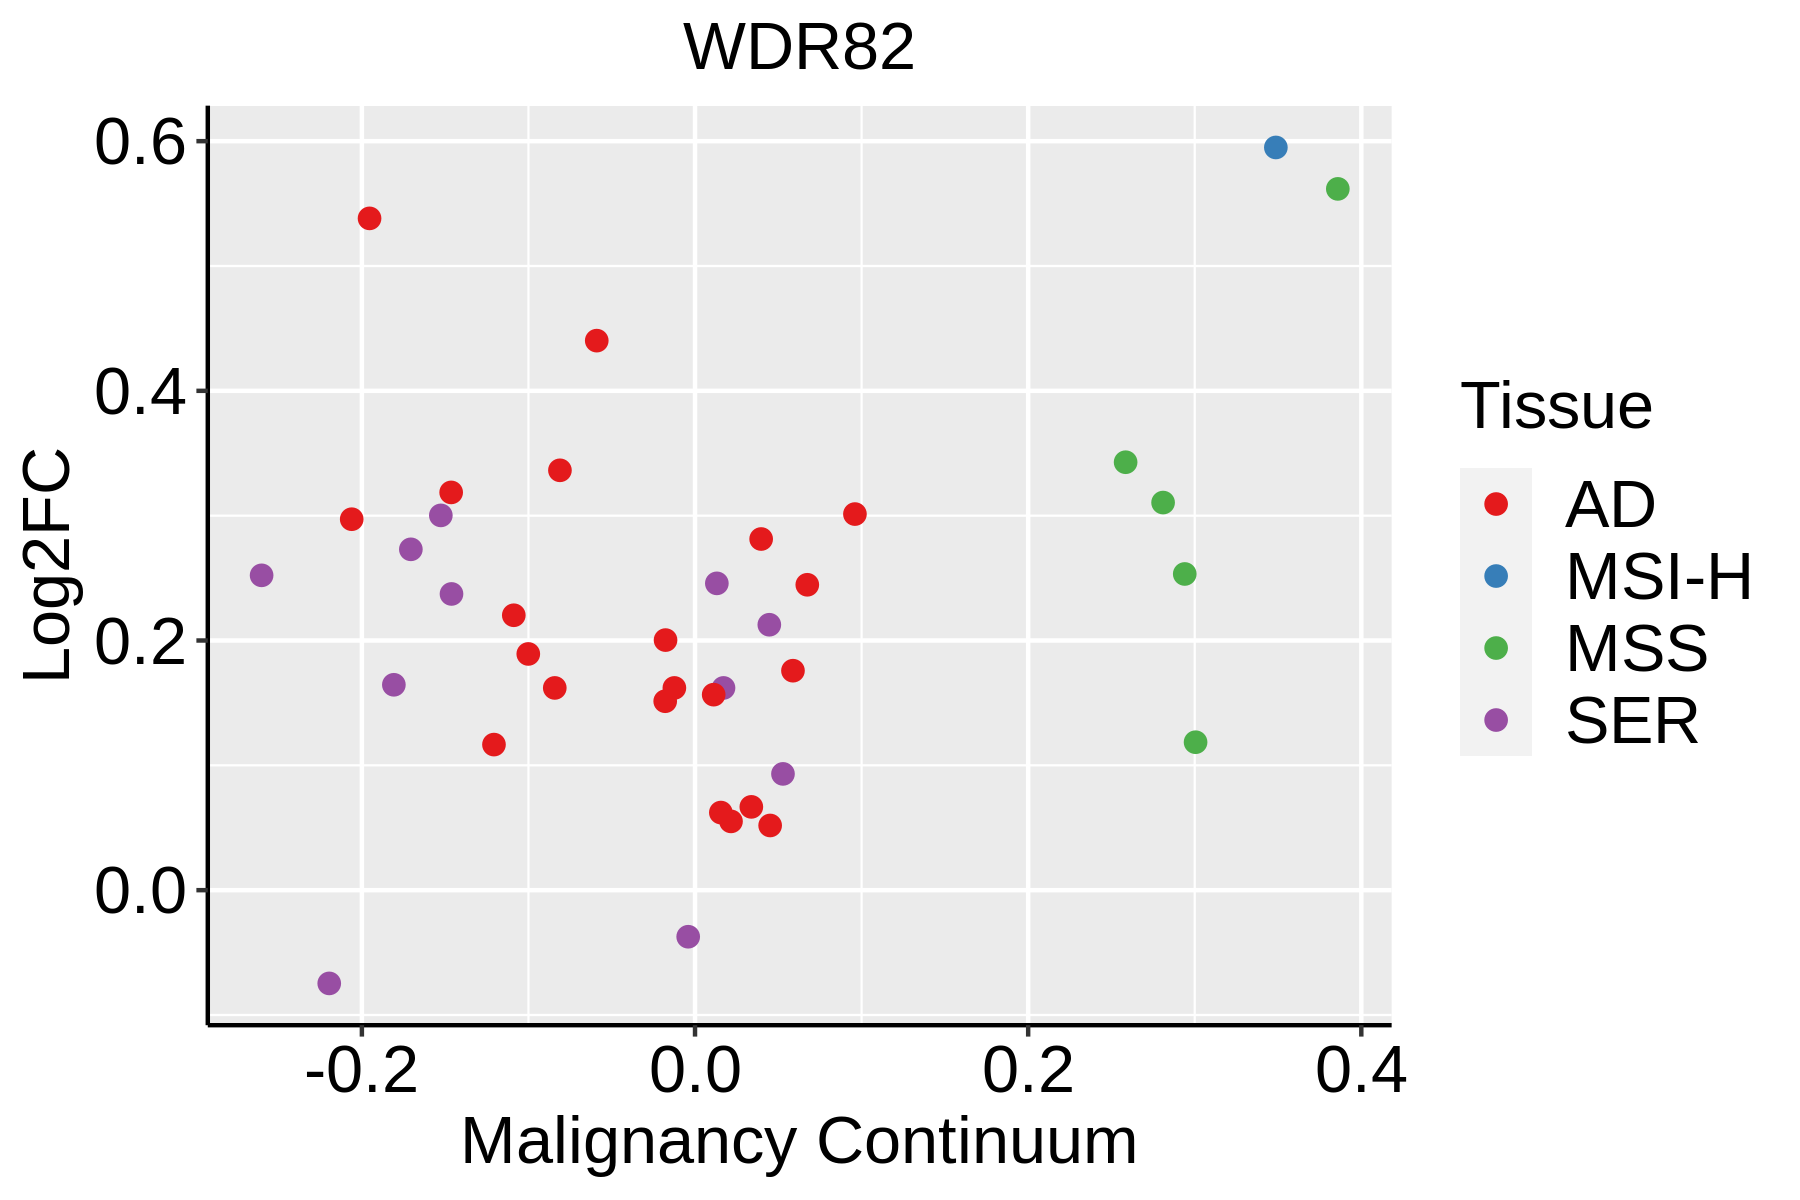 | AD: Adenomas |
| SER: Sessile serrated lesions | ||
| MSI-H: Microsatellite-high colorectal cancer | ||
| MSS: Microsatellite stable colorectal cancer | ||
| Liver | 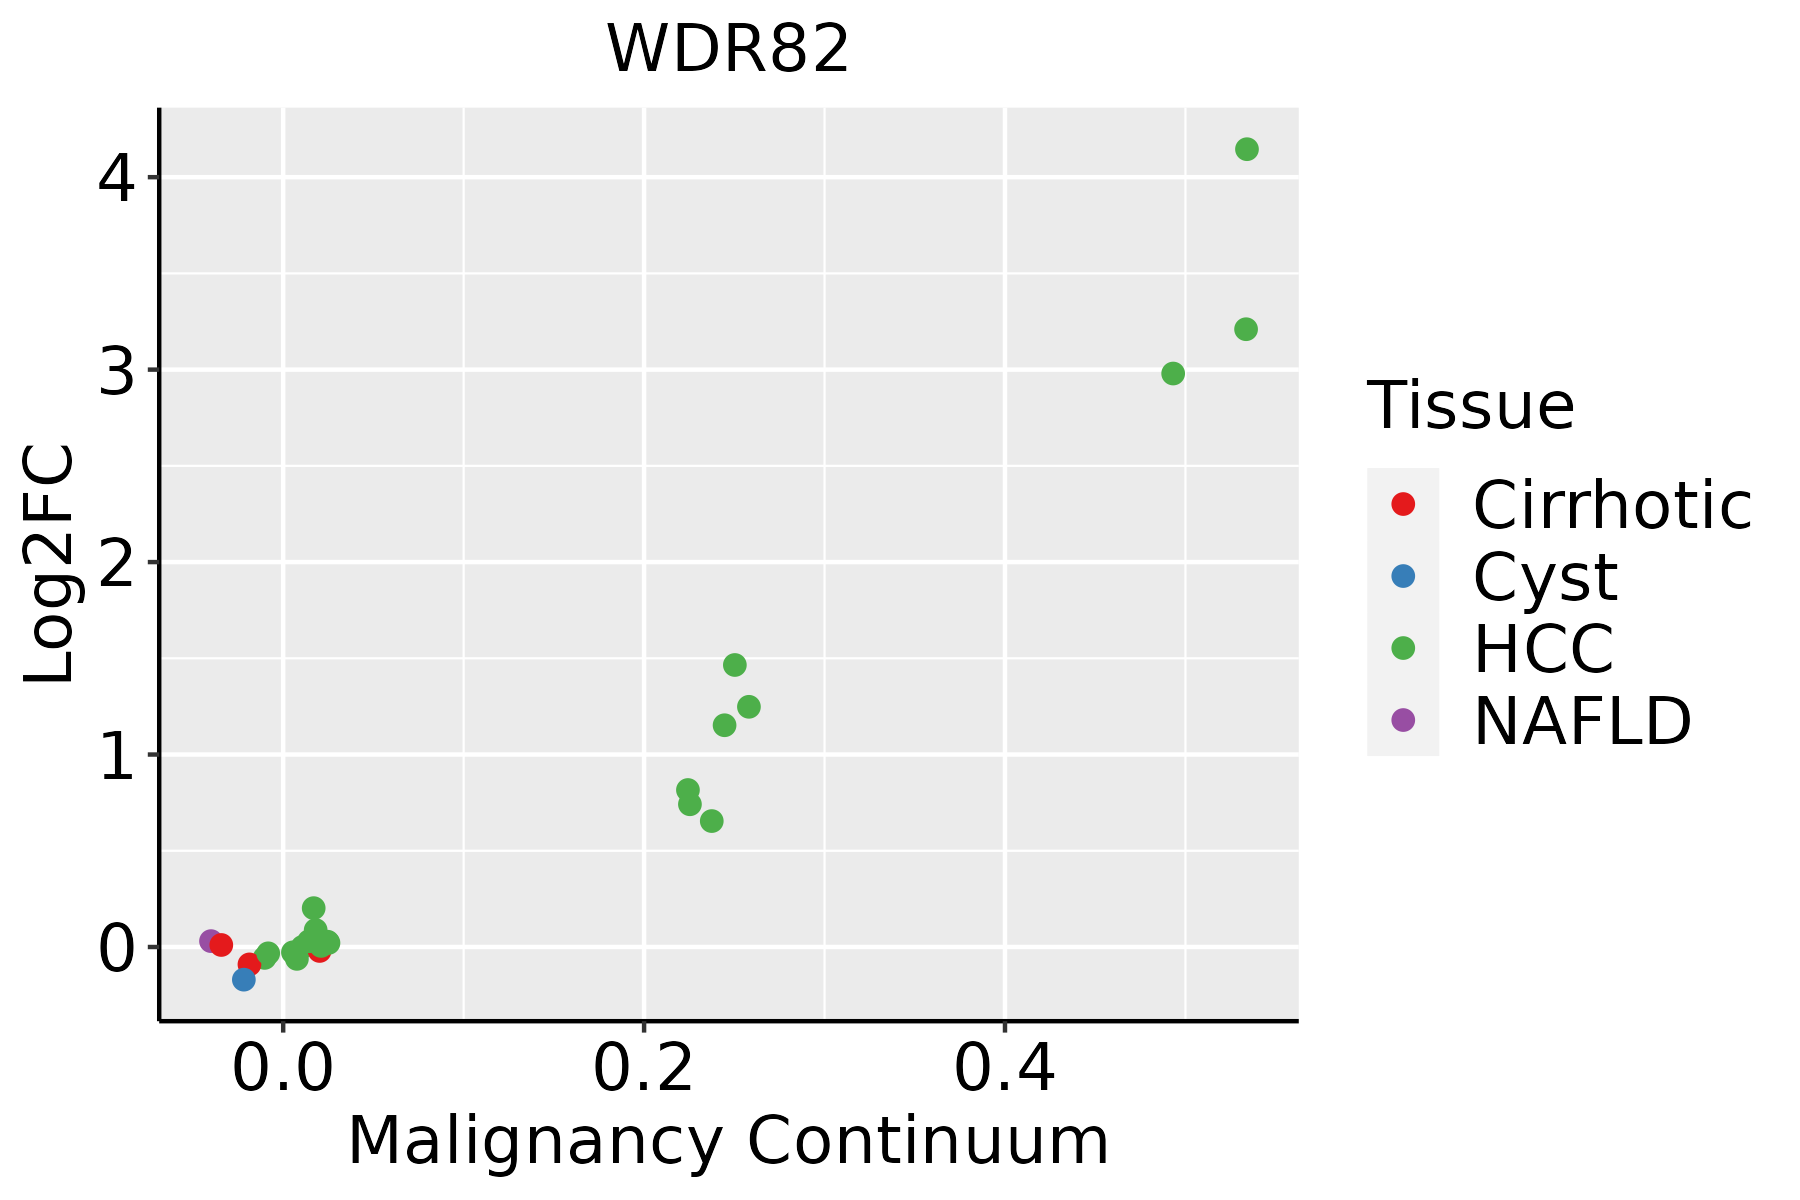 | HCC: Hepatocellular carcinoma |
| NAFLD: Non-alcoholic fatty liver disease | ||
| Oral Cavity | 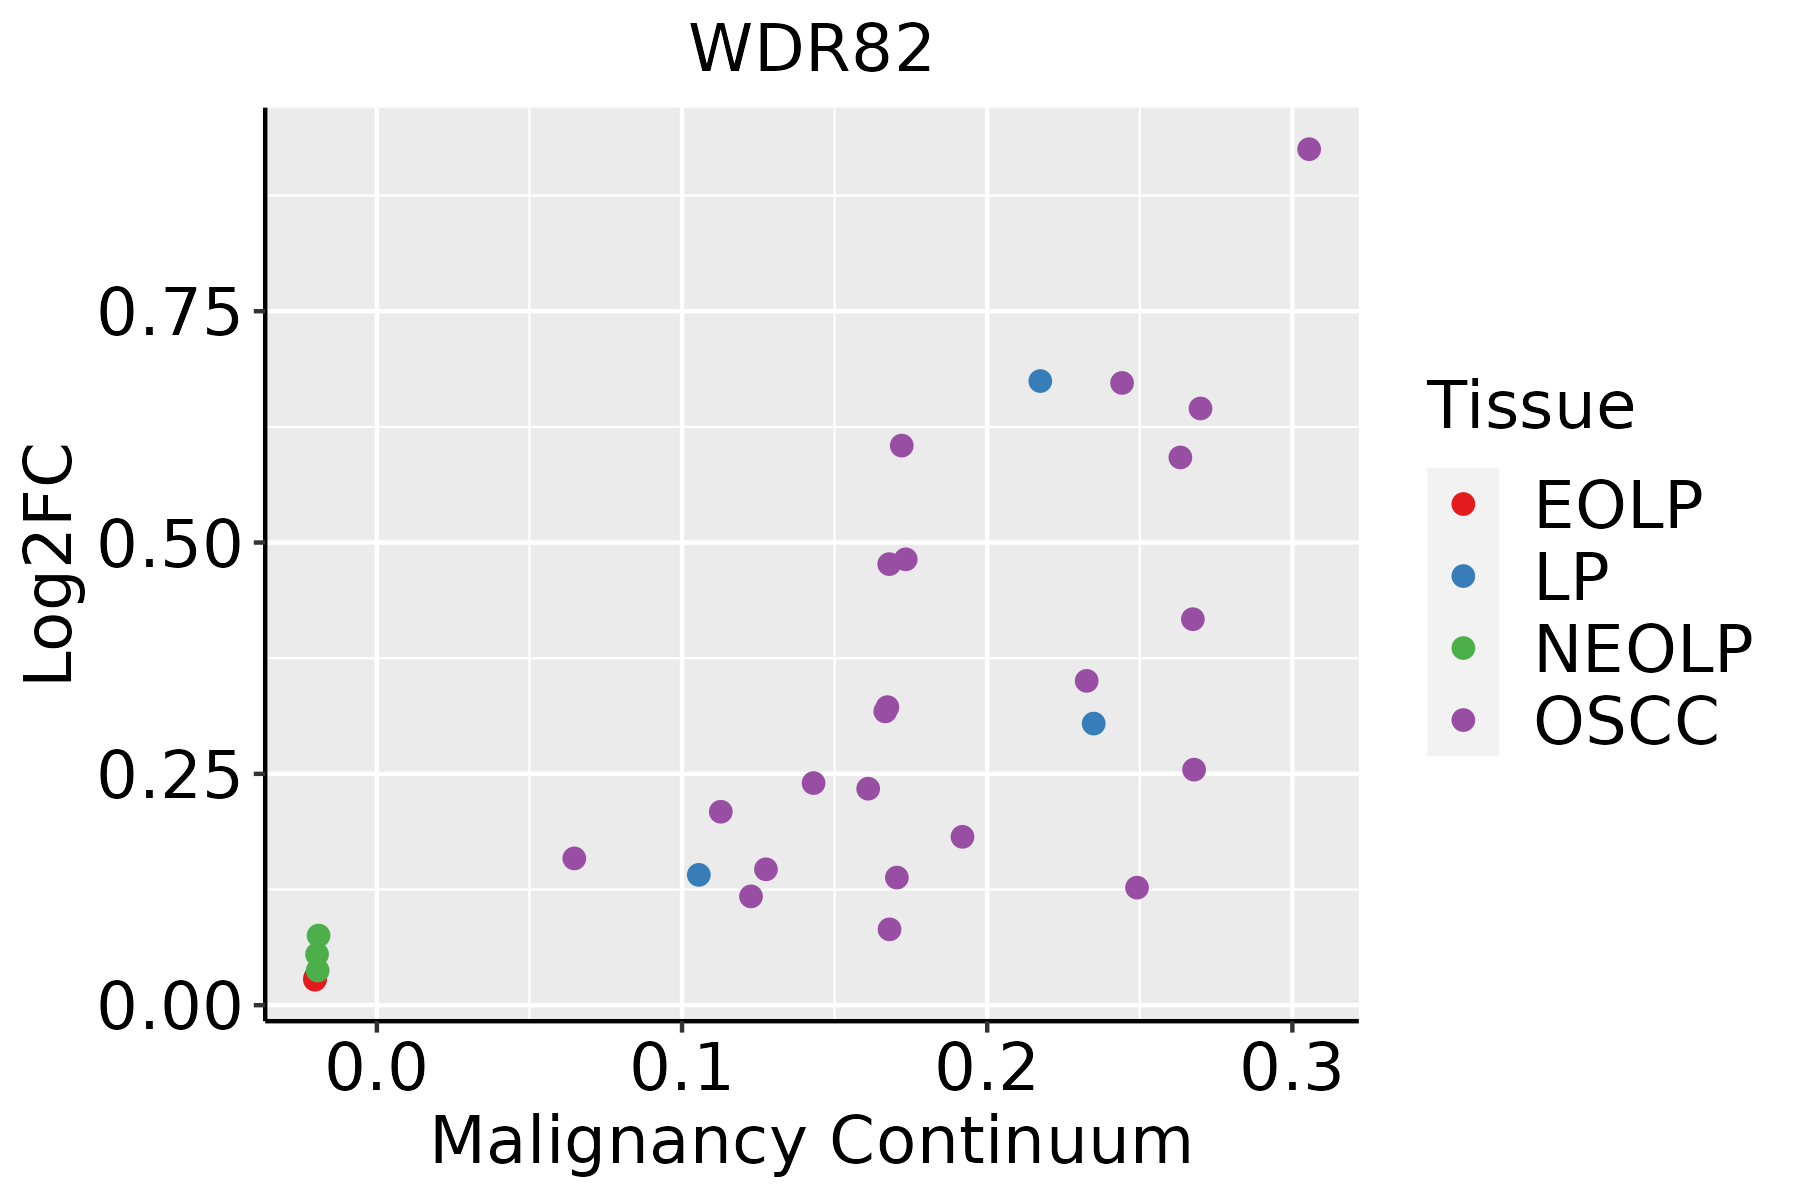 | EOLP: Erosive Oral lichen planus |
| LP: leukoplakia | ||
| NEOLP: Non-erosive oral lichen planus | ||
| OSCC: Oral squamous cell carcinoma | ||
| Prostate | 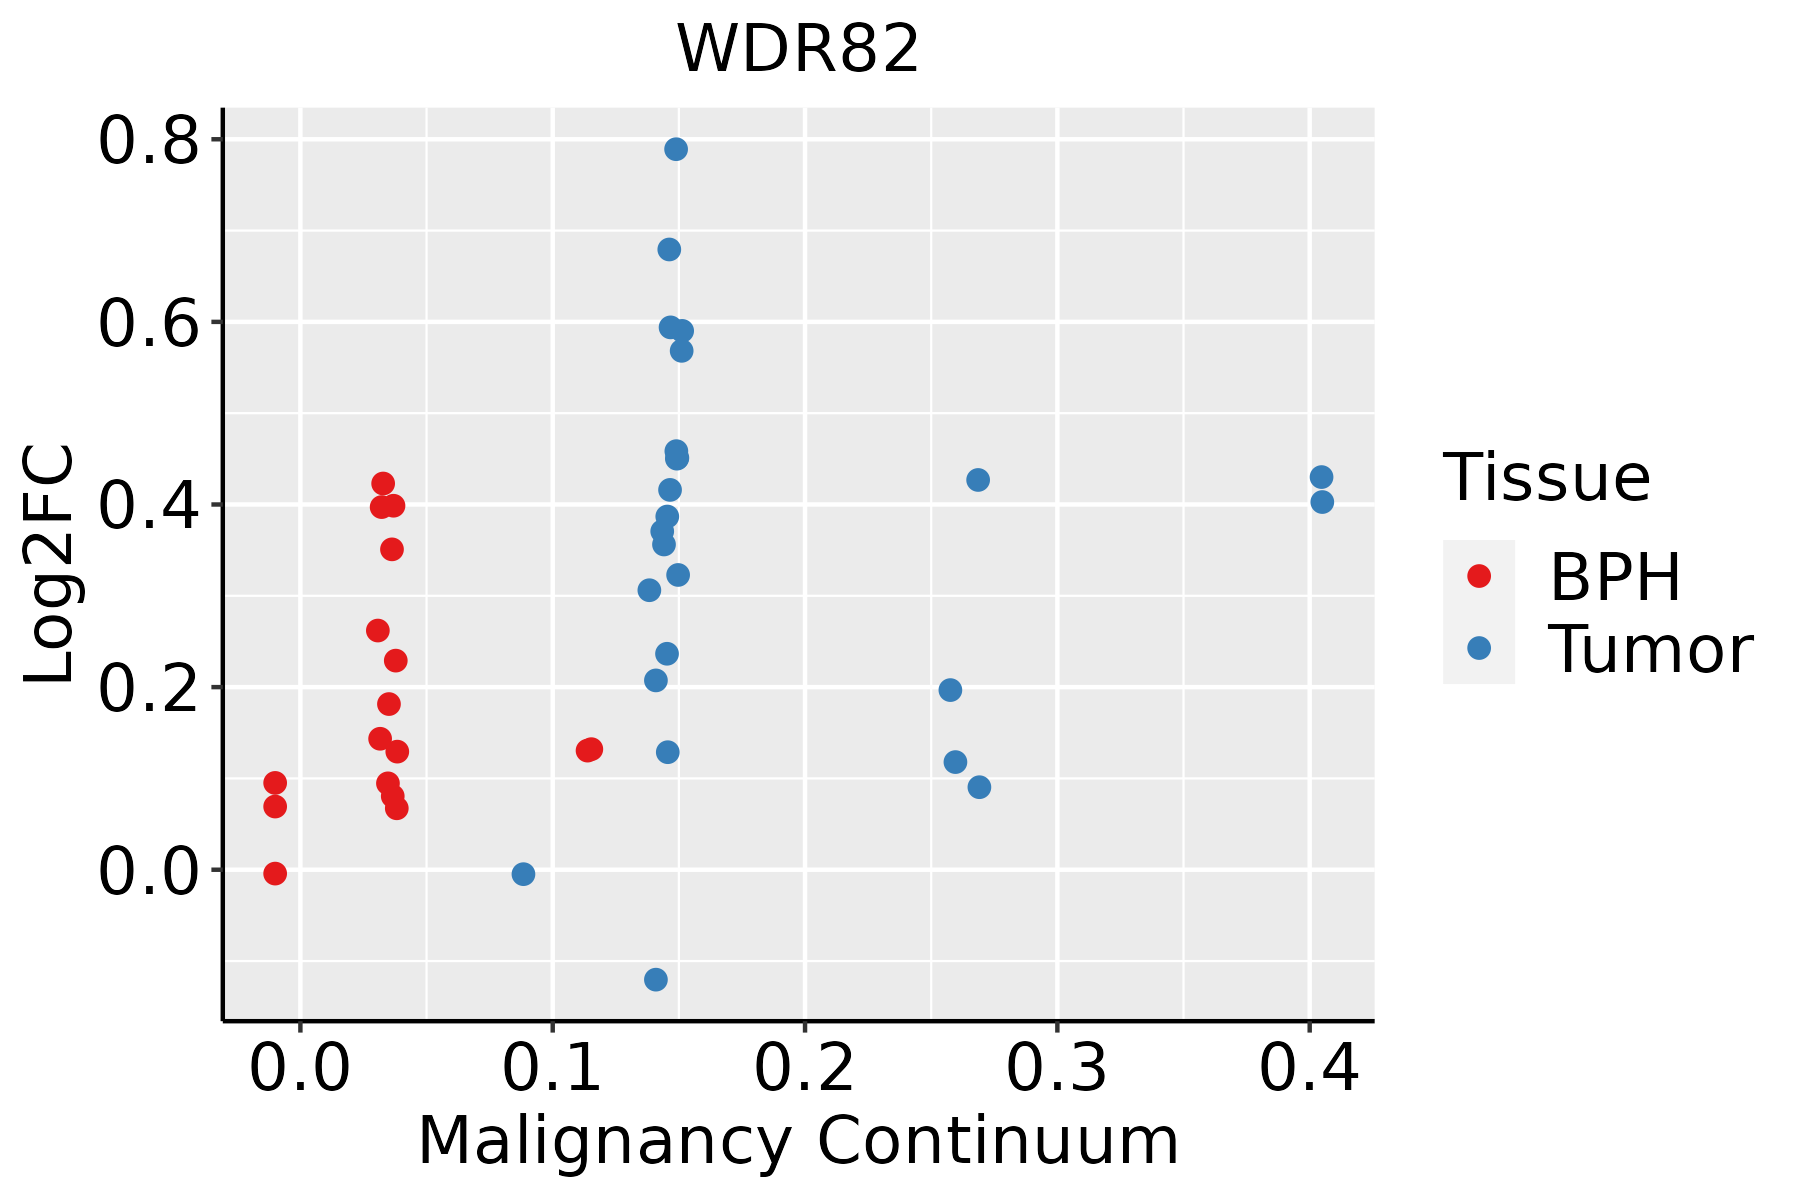 | BPH: Benign Prostatic Hyperplasia |
| Skin | 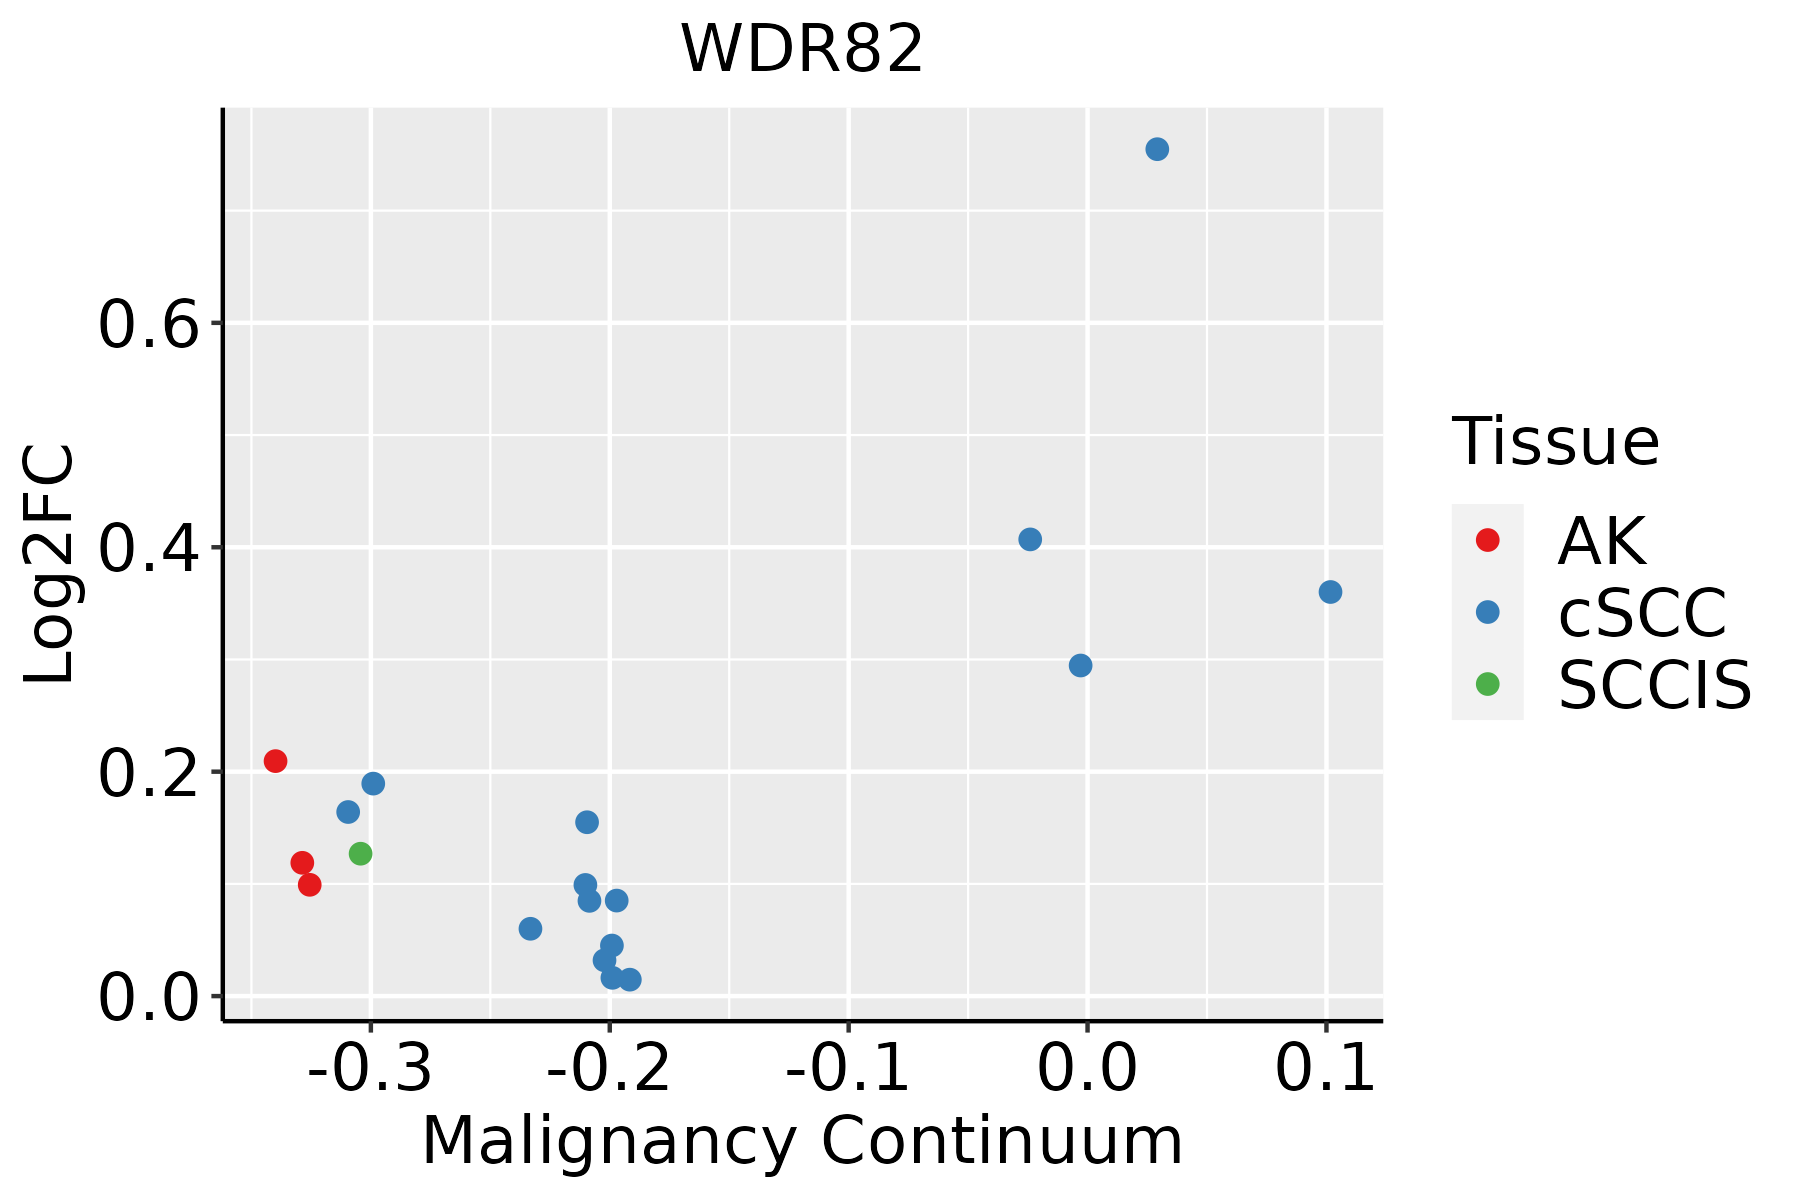 | AK: Actinic keratosis |
| cSCC: Cutaneous squamous cell carcinoma | ||
| SCCIS:squamous cell carcinoma in situ | ||
| Thyroid | 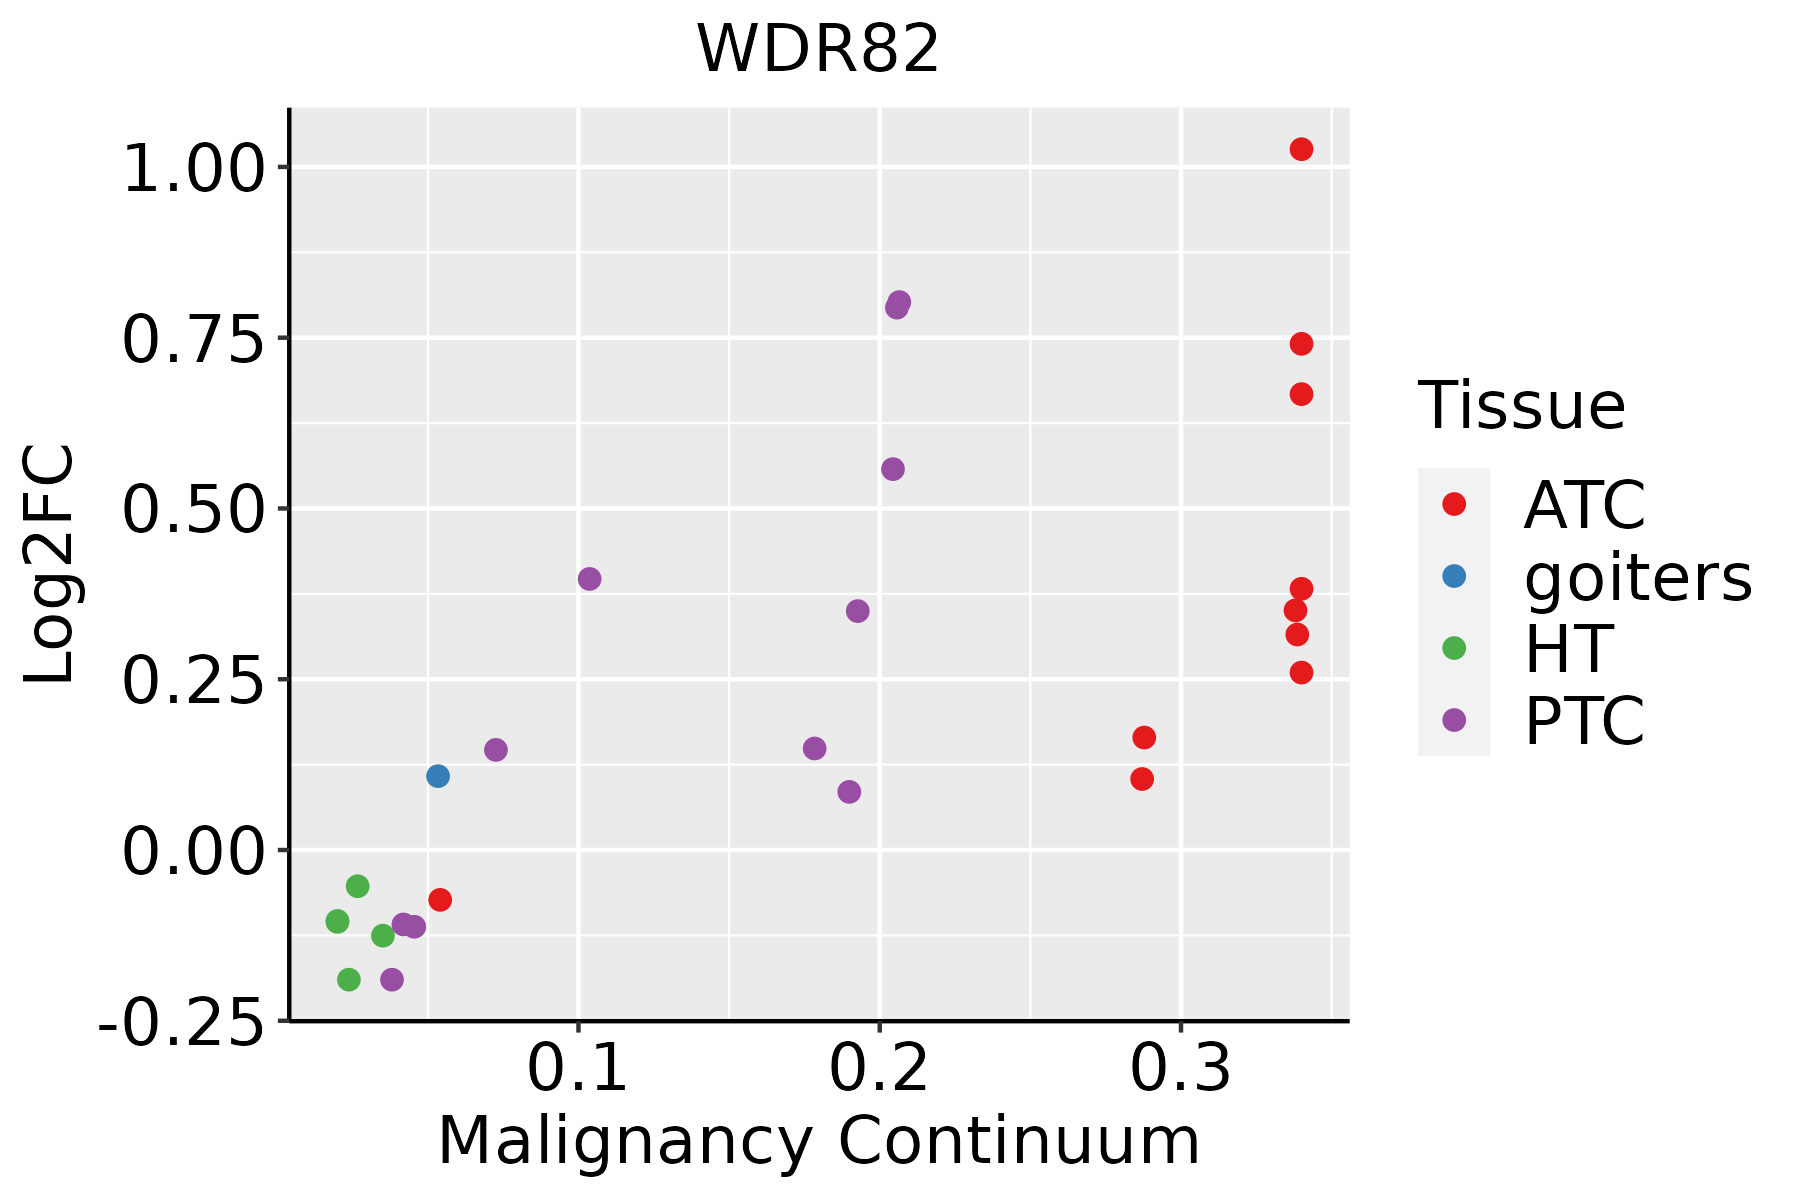 | ATC: Anaplastic thyroid cancer |
| HT: Hashimoto's thyroiditis | ||
| PTC: Papillary thyroid cancer |
| ∗log2FC in expression of this searched gene in stem-like cells from each diseased tissue sample relative to stem-like cells in normal samples in each tissue plotted against the malignancy continuum. Samples are colored based on if they are from different disease stage. |
Top |
Malignant transformation related pathway analysis |
| Find out the enriched GO biological processes and KEGG pathways involved in transition from healthy to precancer to cancer |
| Tissue | Disease Stage | Enriched GO biological Processes |
| Colorectum | AD |  |
| Colorectum | SER |  |
| Colorectum | MSS |  |
| Colorectum | MSI-H |  |
| Colorectum | FAP |  |
| ∗Top 15 enriched GO BP terms are showed in the bar plot of each disease state in each tissue. Each row represents a significant GO biological process which is colored according to the -log10(p.adjust). |
| Page: 1 2 3 4 5 6 7 8 9 |
| GO ID | Tissue | Disease Stage | Description | Gene Ratio | Bg Ratio | pvalue | p.adjust | Count |
| GO:0016570 | Colorectum | MSS | histone modification | 113/3467 | 463/18723 | 8.37e-04 | 8.68e-03 | 113 |
| GO:00165701 | Colorectum | FAP | histone modification | 94/2622 | 463/18723 | 1.06e-04 | 1.76e-03 | 94 |
| GO:0006479 | Colorectum | FAP | protein methylation | 39/2622 | 181/18723 | 3.60e-03 | 2.58e-02 | 39 |
| GO:0008213 | Colorectum | FAP | protein alkylation | 39/2622 | 181/18723 | 3.60e-03 | 2.58e-02 | 39 |
| GO:0034968 | Colorectum | FAP | histone lysine methylation | 27/2622 | 115/18723 | 4.23e-03 | 2.90e-02 | 27 |
| GO:0016571 | Colorectum | FAP | histone methylation | 31/2622 | 141/18723 | 6.47e-03 | 4.03e-02 | 31 |
| GO:001657021 | Liver | HCC | histone modification | 283/7958 | 463/18723 | 2.68e-16 | 2.33e-14 | 283 |
| GO:00182052 | Liver | HCC | peptidyl-lysine modification | 230/7958 | 376/18723 | 1.51e-13 | 8.32e-12 | 230 |
| GO:00434141 | Liver | HCC | macromolecule methylation | 183/7958 | 316/18723 | 2.00e-08 | 4.72e-07 | 183 |
| GO:0032259 | Liver | HCC | methylation | 206/7958 | 364/18723 | 3.35e-08 | 7.53e-07 | 206 |
| GO:00064792 | Liver | HCC | protein methylation | 111/7958 | 181/18723 | 2.36e-07 | 4.18e-06 | 111 |
| GO:00082132 | Liver | HCC | protein alkylation | 111/7958 | 181/18723 | 2.36e-07 | 4.18e-06 | 111 |
| GO:00165712 | Liver | HCC | histone methylation | 88/7958 | 141/18723 | 1.41e-06 | 2.02e-05 | 88 |
| GO:00349681 | Liver | HCC | histone lysine methylation | 70/7958 | 115/18723 | 5.32e-05 | 5.04e-04 | 70 |
| GO:00180221 | Liver | HCC | peptidyl-lysine methylation | 74/7958 | 131/18723 | 8.46e-04 | 5.06e-03 | 74 |
| GO:0051568 | Liver | HCC | histone H3-K4 methylation | 36/7958 | 59/18723 | 3.15e-03 | 1.46e-02 | 36 |
| GO:00165707 | Oral cavity | OSCC | histone modification | 270/7305 | 463/18723 | 1.59e-17 | 1.50e-15 | 270 |
| GO:00182056 | Oral cavity | OSCC | peptidyl-lysine modification | 216/7305 | 376/18723 | 2.32e-13 | 1.16e-11 | 216 |
| GO:00064797 | Oral cavity | OSCC | protein methylation | 92/7305 | 181/18723 | 7.86e-04 | 4.26e-03 | 92 |
| GO:00082137 | Oral cavity | OSCC | protein alkylation | 92/7305 | 181/18723 | 7.86e-04 | 4.26e-03 | 92 |
| Page: 1 2 3 4 |
| Pathway ID | Tissue | Disease Stage | Description | Gene Ratio | Bg Ratio | pvalue | p.adjust | qvalue | Count |
| hsa03015 | Colorectum | AD | mRNA surveillance pathway | 35/2092 | 97/8465 | 7.95e-03 | 3.13e-02 | 2.00e-02 | 35 |
| hsa030151 | Colorectum | AD | mRNA surveillance pathway | 35/2092 | 97/8465 | 7.95e-03 | 3.13e-02 | 2.00e-02 | 35 |
| hsa030158 | Oral cavity | OSCC | mRNA surveillance pathway | 75/3704 | 97/8465 | 1.30e-11 | 2.01e-10 | 1.02e-10 | 75 |
| hsa0301513 | Oral cavity | OSCC | mRNA surveillance pathway | 75/3704 | 97/8465 | 1.30e-11 | 2.01e-10 | 1.02e-10 | 75 |
| hsa030155 | Prostate | BPH | mRNA surveillance pathway | 32/1718 | 97/8465 | 2.20e-03 | 8.63e-03 | 5.34e-03 | 32 |
| hsa0301512 | Prostate | BPH | mRNA surveillance pathway | 32/1718 | 97/8465 | 2.20e-03 | 8.63e-03 | 5.34e-03 | 32 |
| hsa0301522 | Prostate | Tumor | mRNA surveillance pathway | 33/1791 | 97/8465 | 2.18e-03 | 8.60e-03 | 5.33e-03 | 33 |
| hsa0301532 | Prostate | Tumor | mRNA surveillance pathway | 33/1791 | 97/8465 | 2.18e-03 | 8.60e-03 | 5.33e-03 | 33 |
| Page: 1 |
Top |
Cell-cell communication analysis |
| Identification of potential cell-cell interactions between two cell types and their ligand-receptor pairs for different disease states |
| Ligand | Receptor | LRpair | Pathway | Tissue | Disease Stage |
| Page: 1 |
Top |
Single-cell gene regulatory network inference analysis |
| Find out the significant the regulons (TFs) and the target genes of each regulon across cell types for different disease states |
| TF | Cell Type | Tissue | Disease Stage | Target Gene | RSS | Regulon Activity |
| ∗The dot plots of a searched regulon are shown for all cell subpopulations in each disease state of each tissue based on the regulon specific score inferred using pySCENIC and by calculating the average expression. |
| Page: 1 |
Top |
Somatic mutation of malignant transformation related genes |
| Annotation of somatic variants for genes involved in malignant transformation |
| Hugo Symbol | Variant Class | Variant Classification | dbSNP RS | HGVSc | HGVSp | HGVSp Short | SWISSPROT | BIOTYPE | SIFT | PolyPhen | Tumor Sample Barcode | Tissue | Histology | Sex | Age | Stage | Therapy Types | Drugs | Outcome |
| WDR82 | SNV | Missense_Mutation | c.937N>T | p.Asp313Tyr | p.D313Y | Q6UXN9 | protein_coding | deleterious(0) | possibly_damaging(0.779) | TCGA-A2-A0CX-01 | Breast | breast invasive carcinoma | Female | <65 | I/II | Chemotherapy | adriamycin | SD | |
| WDR82 | SNV | Missense_Mutation | c.865N>A | p.Gln289Lys | p.Q289K | Q6UXN9 | protein_coding | tolerated(0.48) | benign(0.01) | TCGA-BH-A0HF-01 | Breast | breast invasive carcinoma | Female | >=65 | I/II | Hormone Therapy | arimidex | SD | |
| WDR82 | deletion | Frame_Shift_Del | novel | c.46delN | p.Val16CysfsTer70 | p.V16Cfs*70 | Q6UXN9 | protein_coding | TCGA-D8-A27V-01 | Breast | breast invasive carcinoma | Female | <65 | I/II | Hormone Therapy | tamoxiphen | SD | ||
| WDR82 | SNV | Missense_Mutation | c.55N>A | p.Glu19Lys | p.E19K | Q6UXN9 | protein_coding | tolerated(0.11) | benign(0.015) | TCGA-MU-A51Y-01 | Cervix | cervical & endocervical cancer | Female | <65 | I/II | Unknown | Unknown | SD | |
| WDR82 | SNV | Missense_Mutation | novel | c.205N>G | p.Ile69Val | p.I69V | Q6UXN9 | protein_coding | tolerated(0.23) | benign(0.001) | TCGA-A5-A0G2-01 | Endometrium | uterine corpus endometrioid carcinoma | Female | <65 | III/IV | Unknown | Unknown | SD |
| WDR82 | SNV | Missense_Mutation | novel | c.878N>C | p.Lys293Thr | p.K293T | Q6UXN9 | protein_coding | tolerated(0.1) | possibly_damaging(0.493) | TCGA-A5-A2K5-01 | Endometrium | uterine corpus endometrioid carcinoma | Female | >=65 | I/II | Unknown | Unknown | SD |
| WDR82 | SNV | Missense_Mutation | novel | c.241A>G | p.Ser81Gly | p.S81G | Q6UXN9 | protein_coding | tolerated(0.16) | benign(0.019) | TCGA-AP-A1DK-01 | Endometrium | uterine corpus endometrioid carcinoma | Female | <65 | I/II | Unknown | Unknown | SD |
| WDR82 | SNV | Missense_Mutation | novel | c.317N>G | p.His106Arg | p.H106R | Q6UXN9 | protein_coding | deleterious(0) | probably_damaging(0.944) | TCGA-AX-A1C4-01 | Endometrium | uterine corpus endometrioid carcinoma | Female | <65 | I/II | Unknown | Unknown | SD |
| WDR82 | SNV | Missense_Mutation | novel | c.133N>G | p.Ile45Val | p.I45V | Q6UXN9 | protein_coding | deleterious(0.01) | benign(0.305) | TCGA-AX-A1C5-01 | Endometrium | uterine corpus endometrioid carcinoma | Female | <65 | III/IV | Unspecific | Carboplatin | SD |
| WDR82 | SNV | Missense_Mutation | novel | c.269G>C | p.Arg90Pro | p.R90P | Q6UXN9 | protein_coding | deleterious(0) | probably_damaging(0.999) | TCGA-BG-A0MK-01 | Endometrium | uterine corpus endometrioid carcinoma | Female | <65 | I/II | Unknown | Unknown | PD |
| Page: 1 2 3 |
Top |
Related drugs of malignant transformation related genes |
| Identification of chemicals and drugs interact with genes involved in malignant transfromation |
| (DGIdb 4.0) |
| Entrez ID | Symbol | Category | Interaction Types | Drug Claim Name | Drug Name | PMIDs |
| Page: 1 |

Copyright 2023-Present -The University of Texas Health Science Center at Houston |