Schematic overview of the cellular and molecular mechanisms involved in the cancer progression, including the proposed cellular and molecular mechanisms in cancer cells trajectory. AT1: alveolar type 1 cells; AT2: alveolar type 2 cells; AAH: atypical adenomatous hyperplasia; AIS: adenocarcinoma in situ; MIA: minimally invasive adenocarcinoma; IA: invasive adenocarcinoma; EMT: epithelial-mesenchymal transition

Home

Download

Statistics

Help

Contact

Center for Computational Systems Medicine
leaf

Gene summary

leaf

Malignant transformation analysis

leaf

Malignant transformation related pathway analysis

leaf

Cell-cell communication analysis

leaf

Single-cell gene regulatory network inference analysis

leaf

Somatic mutation of malignant transformation related genes

leaf

Related drugs of malignant transformation related genes

Gene: WDR77

Gene summary for WDR77

check button Gene summary.

Gene informationSpeciesHuman
Gene symbol

WDR77

Gene ID

79084

Gene nameWD repeat domain 77
Gene AliasHKMT1069
Cytomap1p13.2
Gene Typeprotein-coding
GO ID

GO:0000003

UniProtAcc

Q9BQA1


Top

Malignant transformation analysis

check button Identification of the aberrant gene expression in precancerous and cancerous lesions by comparing the gene expression of stem-like cells in diseased tissues with normal stem cells
check button Malignant transformation involving gene list.
Entrez IDSymbolReplicatesSpeciesOrganTissueAdj P-valueLog2FCMalignancy
79084WDR77LZE4THumanEsophagusESCC2.97e-083.45e-010.0811
79084WDR77LZE7THumanEsophagusESCC1.30e-075.25e-010.0667
79084WDR77LZE8THumanEsophagusESCC1.49e-032.13e-010.067
79084WDR77LZE20THumanEsophagusESCC5.27e-073.37e-010.0662
79084WDR77LZE24THumanEsophagusESCC1.00e-113.74e-010.0596
79084WDR77P1T-EHumanEsophagusESCC8.01e-055.18e-010.0875
79084WDR77P2T-EHumanEsophagusESCC5.04e-368.28e-010.1177
79084WDR77P4T-EHumanEsophagusESCC3.12e-246.57e-010.1323
79084WDR77P5T-EHumanEsophagusESCC5.78e-256.59e-010.1327
79084WDR77P8T-EHumanEsophagusESCC3.77e-194.12e-010.0889
79084WDR77P9T-EHumanEsophagusESCC3.24e-205.79e-010.1131
79084WDR77P10T-EHumanEsophagusESCC2.55e-235.46e-010.116
79084WDR77P11T-EHumanEsophagusESCC1.36e-175.44e-010.1426
79084WDR77P12T-EHumanEsophagusESCC4.65e-531.14e+000.1122
79084WDR77P15T-EHumanEsophagusESCC2.98e-184.24e-010.1149
79084WDR77P16T-EHumanEsophagusESCC4.10e-265.55e-010.1153
79084WDR77P17T-EHumanEsophagusESCC6.85e-116.16e-010.1278
79084WDR77P19T-EHumanEsophagusESCC5.23e-057.38e-010.1662
79084WDR77P20T-EHumanEsophagusESCC2.70e-225.28e-010.1124
79084WDR77P21T-EHumanEsophagusESCC5.45e-145.17e-010.1617
Page: 1 2 3 4 5 

check button Transcriptomic changes along malignancy continuum.
TissueExpression DynamicsAbbreviation
EsophagusThe image shows the transcriptomic changes along malignancy continuum.log2FC in expression of this searched gene in stem-like cells from each diseased tissue sample relative to stem-like cells in normal samples in each tissue plotted against the malignancy continuum. Samples are colored based on if they are from different disease stage.
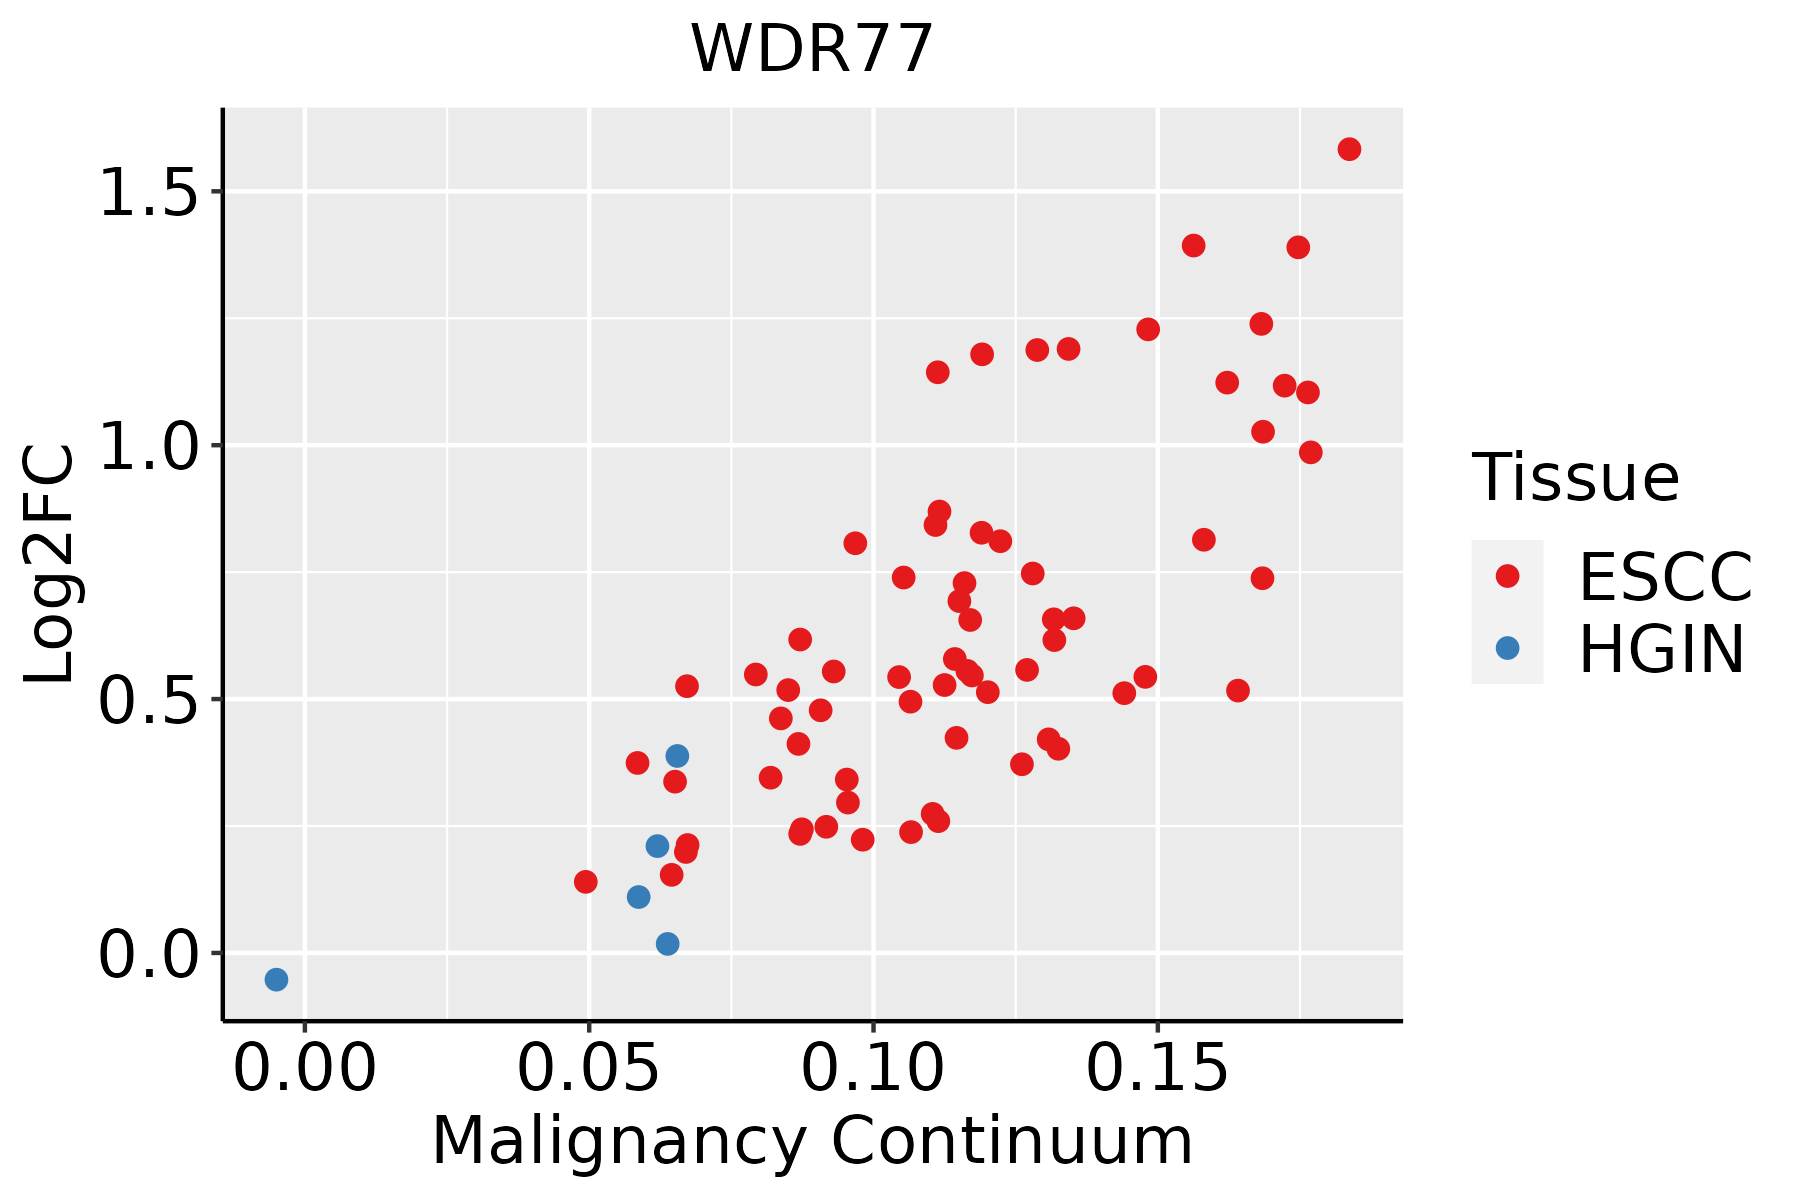
ESCC: Esophageal squamous cell carcinoma
HGIN: High-grade intraepithelial neoplasias
LGIN: Low-grade intraepithelial neoplasias
LiverThe image shows the transcriptomic changes along malignancy continuum.log2FC in expression of this searched gene in stem-like cells from each diseased tissue sample relative to stem-like cells in normal samples in each tissue plotted against the malignancy continuum. Samples are colored based on if they are from different disease stage.HCC: Hepatocellular carcinoma
NAFLD: Non-alcoholic fatty liver disease
Oral CavityThe image shows the transcriptomic changes along malignancy continuum.log2FC in expression of this searched gene in stem-like cells from each diseased tissue sample relative to stem-like cells in normal samples in each tissue plotted against the malignancy continuum. Samples are colored based on if they are from different disease stage.
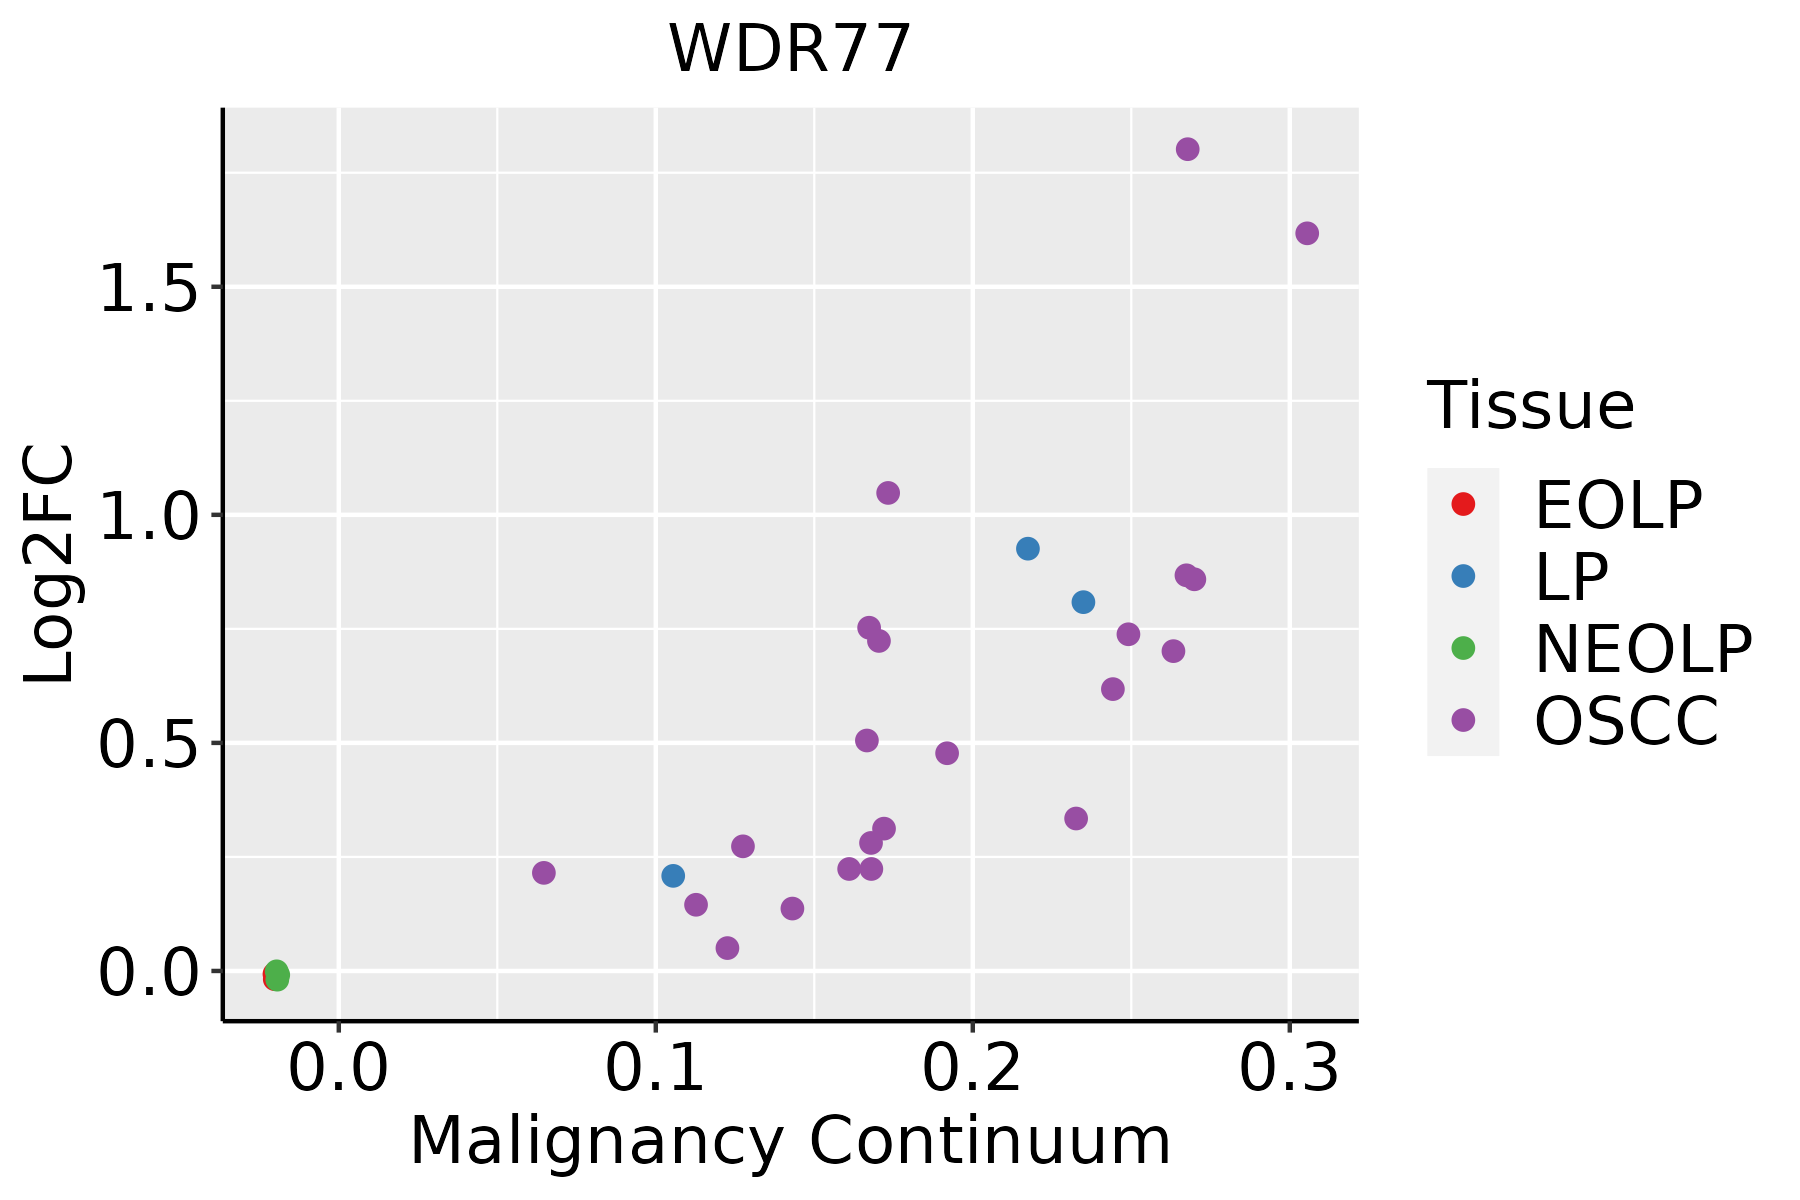
EOLP: Erosive Oral lichen planus
LP: leukoplakia
NEOLP: Non-erosive oral lichen planus
OSCC: Oral squamous cell carcinoma
SkinThe image shows the transcriptomic changes along malignancy continuum.log2FC in expression of this searched gene in stem-like cells from each diseased tissue sample relative to stem-like cells in normal samples in each tissue plotted against the malignancy continuum. Samples are colored based on if they are from different disease stage.
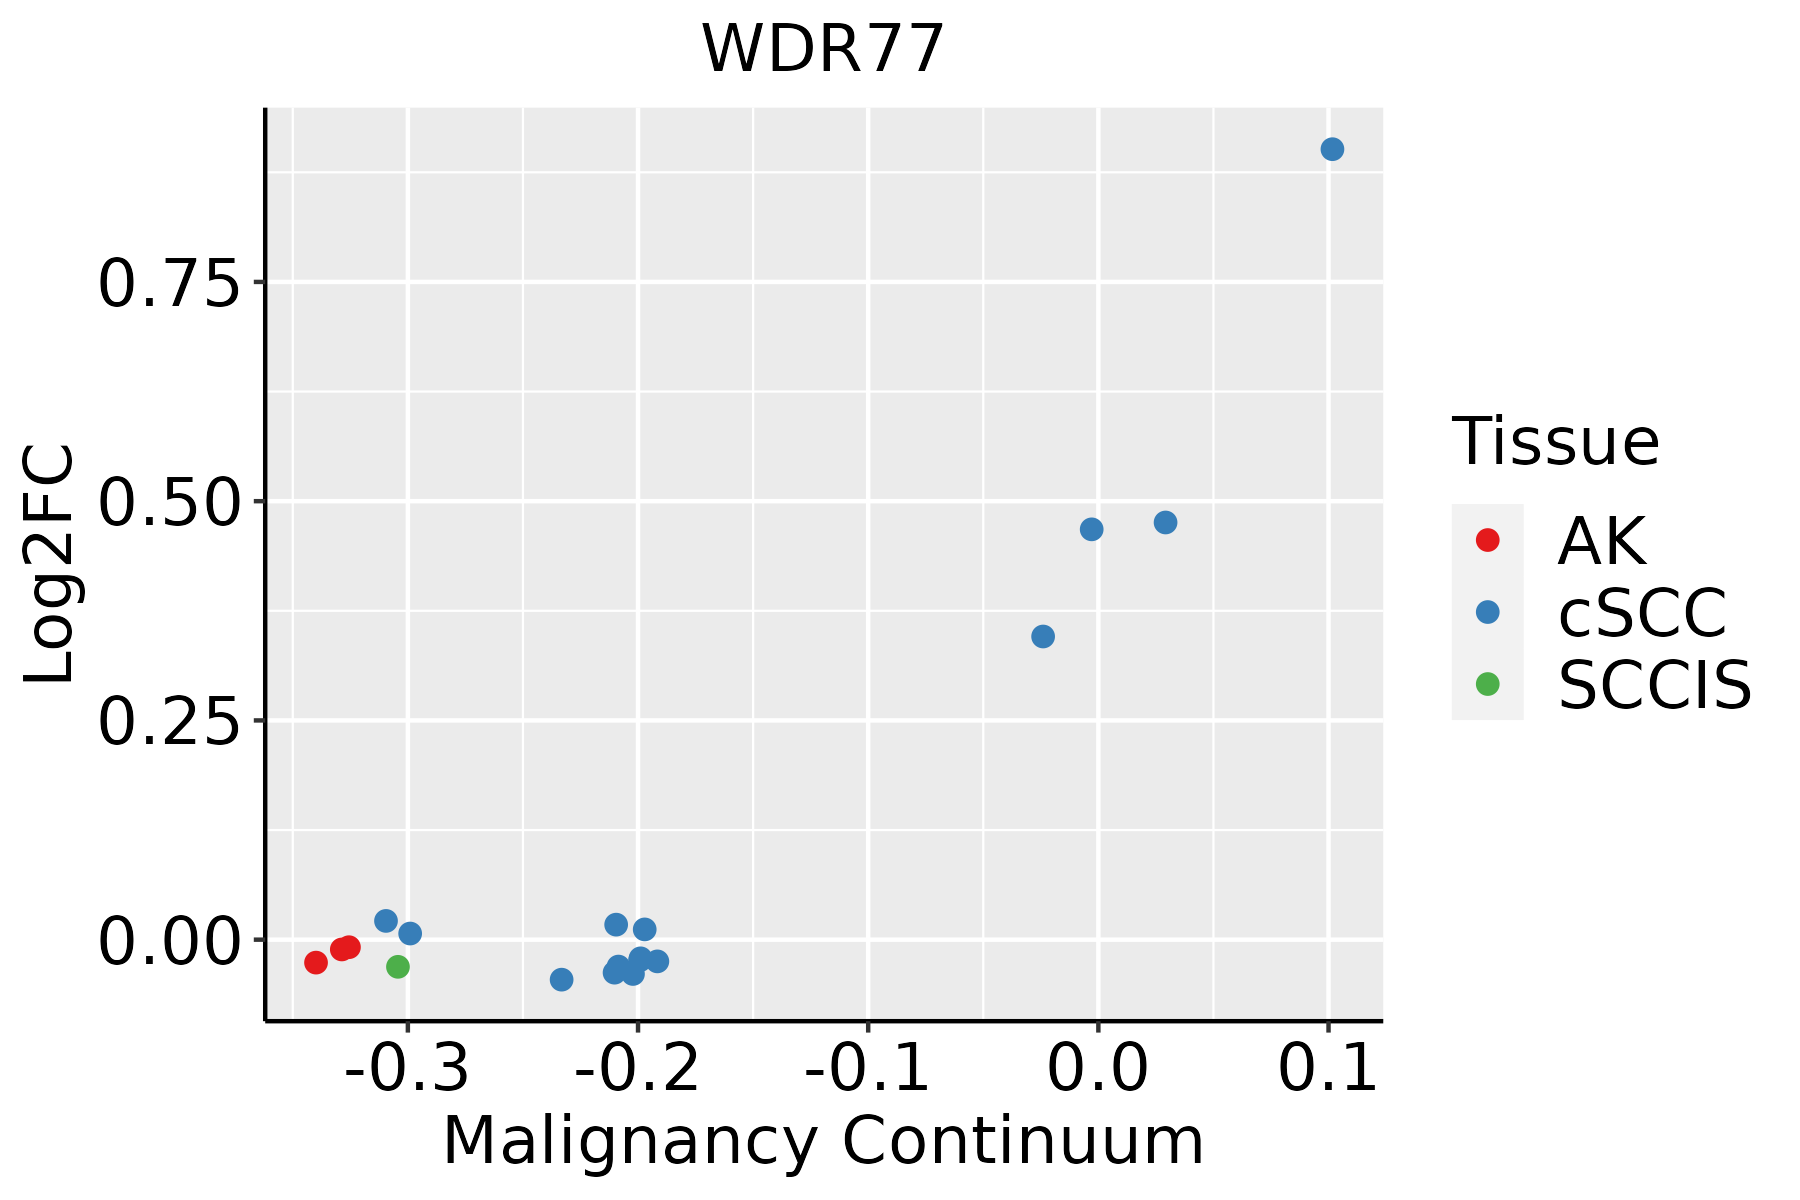
AK: Actinic keratosis
cSCC: Cutaneous squamous cell carcinoma
SCCIS:squamous cell carcinoma in situ
∗log2FC in expression of this searched gene in stem-like cells from each diseased tissue sample relative to stem-like cells in normal samples in each tissue plotted against the malignancy continuum. Samples are colored based on if they are from different disease stage.

Top

Malignant transformation related pathway analysis

check buttonFind out the enriched GO biological processes and KEGG pathways involved in transition from healthy to precancer to cancer
check button Figure of enriched GO biological processes.
TissueDisease StageEnriched GO biological Processes
ColorectumADGO analysis - Figure of enriched GO biological processes: Top 15 enriched GO BP terms are showed in the bar plot of each disease state in each tissue. Each row represents a significant GO biological process which is colored according to the -log10(p.adjust).
ColorectumSERGO analysis - Figure of enriched GO biological processes: Top 15 enriched GO BP terms are showed in the bar plot of each disease state in each tissue. Each row represents a significant GO biological process which is colored according to the -log10(p.adjust).
ColorectumMSSGO analysis - Figure of enriched GO biological processes: Top 15 enriched GO BP terms are showed in the bar plot of each disease state in each tissue. Each row represents a significant GO biological process which is colored according to the -log10(p.adjust).
ColorectumMSI-HGO analysis - Figure of enriched GO biological processes: Top 15 enriched GO BP terms are showed in the bar plot of each disease state in each tissue. Each row represents a significant GO biological process which is colored according to the -log10(p.adjust).
ColorectumFAPGO analysis - Figure of enriched GO biological processes: Top 15 enriched GO BP terms are showed in the bar plot of each disease state in each tissue. Each row represents a significant GO biological process which is colored according to the -log10(p.adjust).
∗Top 15 enriched GO BP terms are showed in the bar plot of each disease state in each tissue. Each row represents a significant GO biological process which is colored according to the -log10(p.adjust).
Page: 1 2 3 4 5 6 7 8 9 

check button Enriched GO biological processes.
GO IDTissueDisease StageDescriptionGene RatioBg Ratiopvaluep.adjustCount
GO:0048732111EsophagusESCCgland development269/8552436/187237.81e-122.95e-10269
GO:0061458110EsophagusESCCreproductive system development247/8552427/187232.24e-073.42e-06247
GO:004860818EsophagusESCCreproductive structure development245/8552424/187232.82e-074.14e-06245
GO:005067318EsophagusESCCepithelial cell proliferation238/8552437/187231.19e-048.20e-04238
GO:00308506EsophagusESCCprostate gland development32/855245/187234.87e-042.70e-0332
GO:005067817EsophagusESCCregulation of epithelial cell proliferation206/8552381/187235.51e-043.02e-03206
GO:00016559EsophagusESCCurogenital system development177/8552338/187237.51e-032.69e-02177
GO:004873222LiverHCCgland development242/7958436/187232.26e-085.28e-07242
GO:00016553LiverHCCurogenital system development170/7958338/187232.15e-031.08e-02170
GO:006145811LiverHCCreproductive system development205/7958427/187231.16e-024.27e-02205
GO:004873220Oral cavityOSCCgland development226/7305436/187232.78e-085.39e-07226
GO:006145817Oral cavityOSCCreproductive system development217/7305427/187233.75e-075.63e-06217
GO:004860816Oral cavityOSCCreproductive structure development214/7305424/187238.58e-071.18e-05214
GO:005067310Oral cavityOSCCepithelial cell proliferation212/7305437/187232.82e-052.61e-04212
GO:005067810Oral cavityOSCCregulation of epithelial cell proliferation180/7305381/187235.88e-043.35e-03180
GO:00016558Oral cavityOSCCurogenital system development160/7305338/187231.03e-035.31e-03160
GO:00308505Oral cavityOSCCprostate gland development27/730545/187233.49e-031.47e-0227
GO:0048732110Oral cavityLPgland development149/4623436/187234.51e-069.17e-05149
GO:006145818Oral cavityLPreproductive system development128/4623427/187236.91e-033.96e-02128
GO:004860817Oral cavityLPreproductive structure development127/4623424/187237.31e-034.08e-02127
Page: 1 2 

check button Enriched KEGG pathways.
Pathway IDTissueDisease StageDescriptionGene RatioBg Ratiopvaluep.adjustqvalueCount
Page: 1 

Top

Cell-cell communication analysis

check buttonIdentification of potential cell-cell interactions between two cell types and their ligand-receptor pairs for different disease states
LigandReceptorLRpairPathwayTissueDisease Stage
Page: 1 

Top

Single-cell gene regulatory network inference analysis

check buttonFind out the significant the regulons (TFs) and the target genes of each regulon across cell types for different disease states
TFCell TypeTissueDisease StageTarget GeneRSSRegulon Activity
∗The dot plots of a searched regulon are shown for all cell subpopulations in each disease state of each tissue based on the regulon specific score inferred using pySCENIC and by calculating the average expression.
Page: 1 

Top

Somatic mutation of malignant transformation related genes

check buttonAnnotation of somatic variants for genes involved in malignant transformation
Hugo SymbolVariant ClassVariant ClassificationdbSNP RSHGVScHGVSpHGVSp ShortSWISSPROTBIOTYPESIFTPolyPhenTumor Sample BarcodeTissueHistologySexAgeStageTherapy TypesDrugsOutcome
WDR77SNVMissense_Mutationnovelc.422T>Cp.Val141Alap.V141AQ9BQA1protein_codingtolerated(0.06)benign(0.08)TCGA-2W-A8YY-01Cervixcervical & endocervical cancerFemale<65I/IIChemotherapycisplatinCR
WDR77SNVMissense_Mutationnovelc.754N>Ap.Ala252Thrp.A252TQ9BQA1protein_codingtolerated(0.63)benign(0)TCGA-A5-A0G2-01Endometriumuterine corpus endometrioid carcinomaFemale<65III/IVUnknownUnknownSD
WDR77SNVMissense_Mutationnovelc.257N>Cp.Leu86Prop.L86PQ9BQA1protein_codingtolerated(0.18)possibly_damaging(0.851)TCGA-A5-A0VQ-01Endometriumuterine corpus endometrioid carcinomaFemale<65I/IIChemotherapycarboplatinSD
WDR77SNVMissense_Mutationnovelc.344T>Cp.Ile115Thrp.I115TQ9BQA1protein_codingtolerated(0.18)possibly_damaging(0.48)TCGA-B5-A1MX-01Endometriumuterine corpus endometrioid carcinomaFemale<65I/IIHormone TherapymegaceSD
WDR77SNVMissense_Mutationnovelc.289N>Ap.Ala97Thrp.A97TQ9BQA1protein_codingdeleterious(0.03)benign(0.232)TCGA-BG-A220-01Endometriumuterine corpus endometrioid carcinomaFemale>=65I/IIUnknownUnknownSD
WDR77SNVMissense_Mutationnovelc.186N>Tp.Lys62Asnp.K62NQ9BQA1protein_codingtolerated(0.32)benign(0.212)TCGA-BK-A6W3-01Endometriumuterine corpus endometrioid carcinomaFemale<65I/IIUnknownUnknownSD
WDR77SNVMissense_Mutationc.573A>Cp.Arg191Serp.R191SQ9BQA1protein_codingdeleterious(0.04)benign(0.25)TCGA-D1-A17Q-01Endometriumuterine corpus endometrioid carcinomaFemale<65I/IIUnknownUnknownSD
WDR77SNVMissense_Mutationnovelc.706A>Tp.Thr236Serp.T236SQ9BQA1protein_codingtolerated(0.71)benign(0)TCGA-EC-A1NJ-01Endometriumuterine corpus endometrioid carcinomaFemale>=65I/IIUnknownUnknownSD
WDR77SNVMissense_Mutationnovelc.187G>Ap.Asp63Asnp.D63NQ9BQA1protein_codingtolerated(0.13)possibly_damaging(0.589)TCGA-EO-A22X-01Endometriumuterine corpus endometrioid carcinomaFemale<65III/IVUnspecificCarboplatinComplete Response
WDR77SNVMissense_Mutationc.844G>Ap.Val282Metp.V282MQ9BQA1protein_codingdeleterious(0)possibly_damaging(0.821)TCGA-50-5946-01Lunglung adenocarcinomaMale<65I/IIUnknownUnknownPD
Page: 1 2 

Top

Related drugs of malignant transformation related genes

check buttonIdentification of chemicals and drugs interact with genes involved in malignant transfromation
(DGIdb 4.0)
Entrez IDSymbolCategoryInteraction TypesDrug Claim NameDrug NamePMIDs
Page: 1