
|
|||||
|
 | |
| |
| |
| |
| |
| |
|
Gene: WDR76 |
Gene summary for WDR76 |
| Gene information | Species | Human | Gene symbol | WDR76 | Gene ID | 79968 |
| Gene name | WD repeat domain 76 | |
| Gene Alias | CDW14 | |
| Cytomap | 15q15.3 | |
| Gene Type | protein-coding | GO ID | GO:0000075 | UniProtAcc | A0A0C4DFX7 |
Top |
Malignant transformation analysis |
| Identification of the aberrant gene expression in precancerous and cancerous lesions by comparing the gene expression of stem-like cells in diseased tissues with normal stem cells |
| Entrez ID | Symbol | Replicates | Species | Organ | Tissue | Adj P-value | Log2FC | Malignancy |
| 79968 | WDR76 | C21 | Human | Oral cavity | OSCC | 7.09e-16 | 7.44e-01 | 0.2678 |
| 79968 | WDR76 | C30 | Human | Oral cavity | OSCC | 8.13e-03 | 3.68e-01 | 0.3055 |
| 79968 | WDR76 | C38 | Human | Oral cavity | OSCC | 7.22e-04 | 4.67e-01 | 0.172 |
| 79968 | WDR76 | C43 | Human | Oral cavity | OSCC | 6.43e-16 | 3.58e-01 | 0.1704 |
| 79968 | WDR76 | C46 | Human | Oral cavity | OSCC | 3.42e-20 | 5.69e-01 | 0.1673 |
| 79968 | WDR76 | C57 | Human | Oral cavity | OSCC | 4.62e-06 | 3.24e-01 | 0.1679 |
| 79968 | WDR76 | C08 | Human | Oral cavity | OSCC | 4.64e-07 | 2.42e-01 | 0.1919 |
| 79968 | WDR76 | LN22 | Human | Oral cavity | OSCC | 3.57e-06 | 7.75e-01 | 0.1733 |
| 79968 | WDR76 | LN46 | Human | Oral cavity | OSCC | 6.86e-18 | 6.43e-01 | 0.1666 |
| 79968 | WDR76 | SYSMH2 | Human | Oral cavity | OSCC | 3.00e-04 | 1.78e-01 | 0.2326 |
| 79968 | WDR76 | SYSMH3 | Human | Oral cavity | OSCC | 1.19e-09 | 2.71e-01 | 0.2442 |
| Page: 1 |
| Tissue | Expression Dynamics | Abbreviation |
| Oral Cavity | 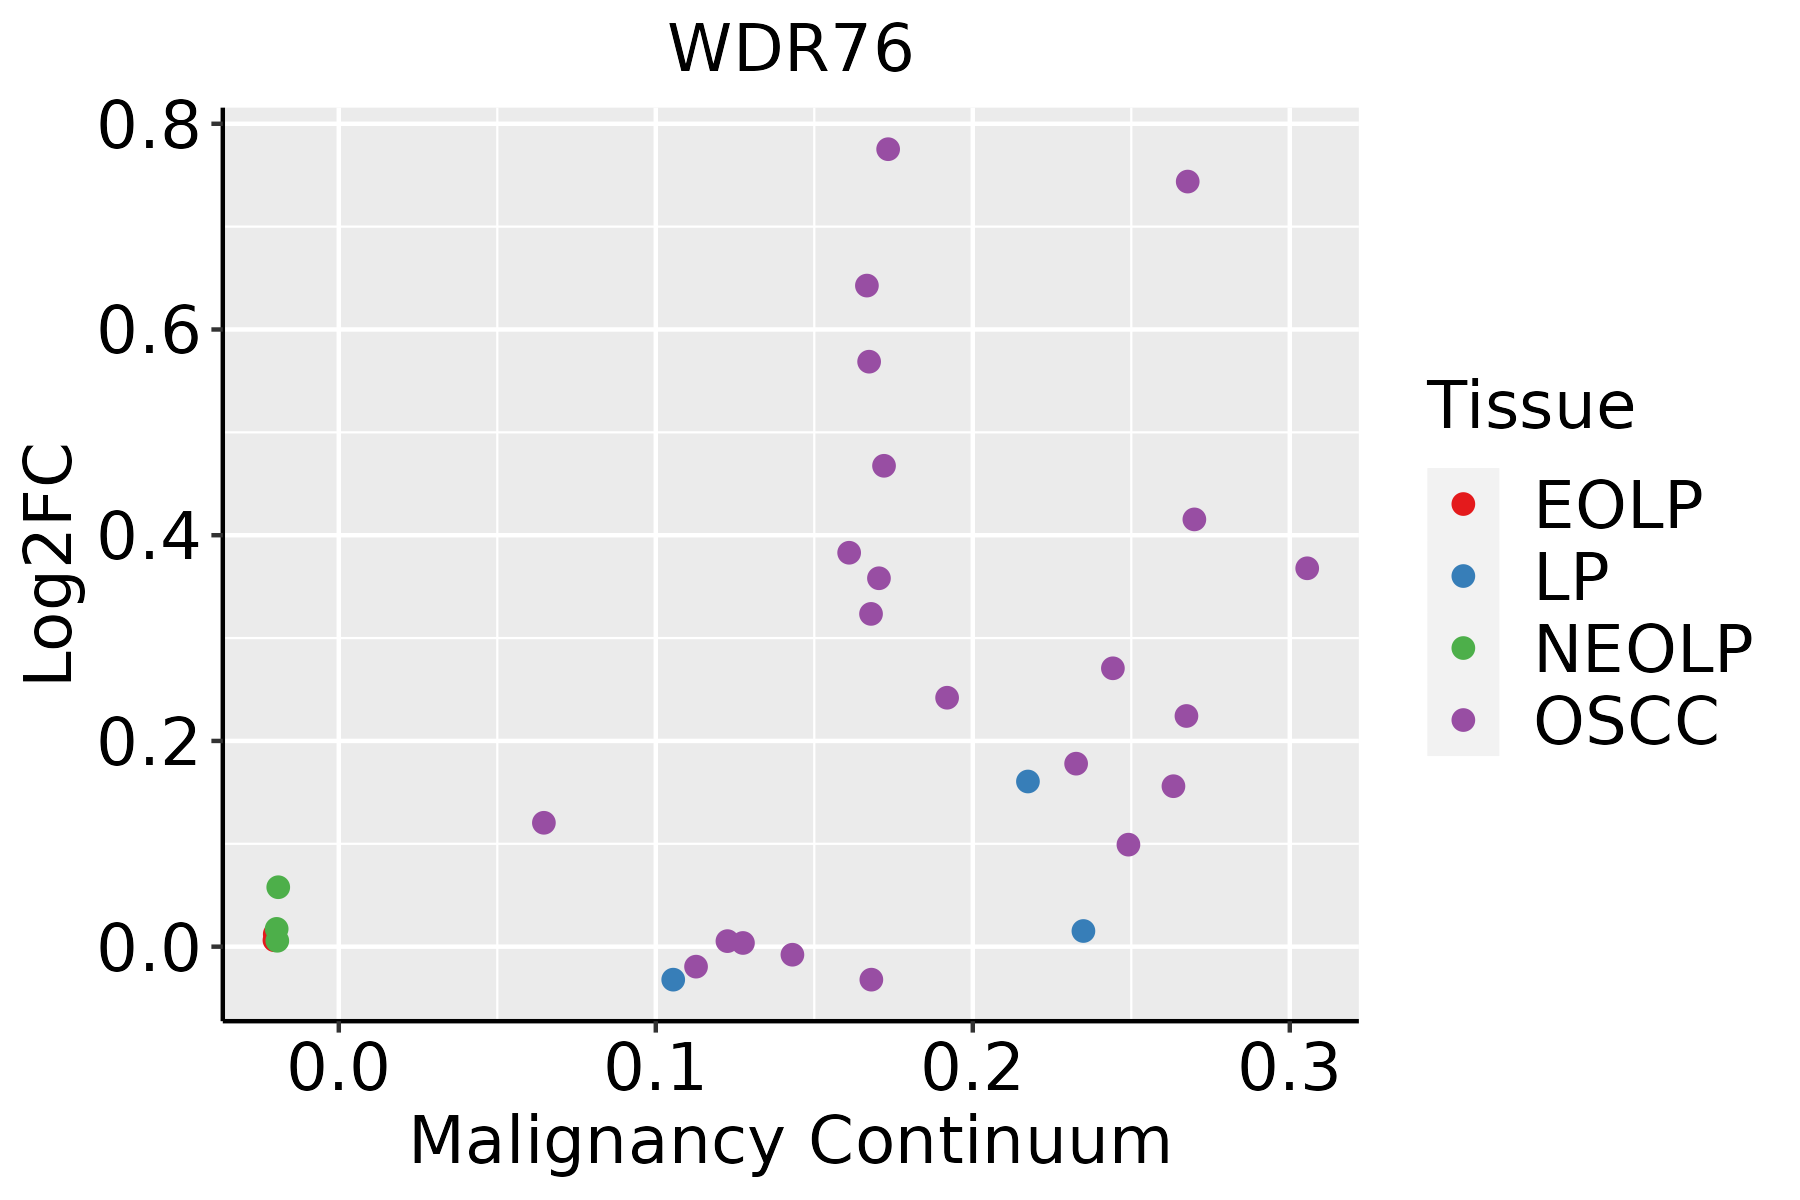 | EOLP: Erosive Oral lichen planus |
| LP: leukoplakia | ||
| NEOLP: Non-erosive oral lichen planus | ||
| OSCC: Oral squamous cell carcinoma |
| ∗log2FC in expression of this searched gene in stem-like cells from each diseased tissue sample relative to stem-like cells in normal samples in each tissue plotted against the malignancy continuum. Samples are colored based on if they are from different disease stage. |
Top |
Malignant transformation related pathway analysis |
| Find out the enriched GO biological processes and KEGG pathways involved in transition from healthy to precancer to cancer |
| Tissue | Disease Stage | Enriched GO biological Processes |
| Colorectum | AD |  |
| Colorectum | SER |  |
| Colorectum | MSS |  |
| Colorectum | MSI-H |  |
| Colorectum | FAP |  |
| ∗Top 15 enriched GO BP terms are showed in the bar plot of each disease state in each tissue. Each row represents a significant GO biological process which is colored according to the -log10(p.adjust). |
| Page: 1 2 3 4 5 6 7 8 9 |
| GO ID | Tissue | Disease Stage | Description | Gene Ratio | Bg Ratio | pvalue | p.adjust | Count |
| GO:200102017 | Oral cavity | OSCC | regulation of response to DNA damage stimulus | 131/7305 | 219/18723 | 3.21e-10 | 8.72e-09 | 131 |
| GO:19019875 | Oral cavity | OSCC | regulation of cell cycle phase transition | 209/7305 | 390/18723 | 2.79e-09 | 6.42e-08 | 209 |
| GO:00457864 | Oral cavity | OSCC | negative regulation of cell cycle | 206/7305 | 385/18723 | 4.28e-09 | 9.55e-08 | 206 |
| GO:00000753 | Oral cavity | OSCC | cell cycle checkpoint | 101/7305 | 169/18723 | 3.53e-08 | 6.68e-07 | 101 |
| GO:00427707 | Oral cavity | OSCC | signal transduction in response to DNA damage | 102/7305 | 172/18723 | 5.27e-08 | 9.68e-07 | 102 |
| GO:19019882 | Oral cavity | OSCC | negative regulation of cell cycle phase transition | 136/7305 | 249/18723 | 3.81e-07 | 5.70e-06 | 136 |
| GO:00109483 | Oral cavity | OSCC | negative regulation of cell cycle process | 155/7305 | 294/18723 | 1.11e-06 | 1.48e-05 | 155 |
| GO:00315704 | Oral cavity | OSCC | DNA integrity checkpoint | 72/7305 | 123/18723 | 8.77e-06 | 9.31e-05 | 72 |
| GO:00000774 | Oral cavity | OSCC | DNA damage checkpoint | 67/7305 | 115/18723 | 2.20e-05 | 2.08e-04 | 67 |
| GO:19019761 | Oral cavity | OSCC | regulation of cell cycle checkpoint | 20/7305 | 33/18723 | 9.78e-03 | 3.45e-02 | 20 |
| Page: 1 |
| Pathway ID | Tissue | Disease Stage | Description | Gene Ratio | Bg Ratio | pvalue | p.adjust | qvalue | Count |
| Page: 1 |
Top |
Cell-cell communication analysis |
| Identification of potential cell-cell interactions between two cell types and their ligand-receptor pairs for different disease states |
| Ligand | Receptor | LRpair | Pathway | Tissue | Disease Stage |
| Page: 1 |
Top |
Single-cell gene regulatory network inference analysis |
| Find out the significant the regulons (TFs) and the target genes of each regulon across cell types for different disease states |
| TF | Cell Type | Tissue | Disease Stage | Target Gene | RSS | Regulon Activity |
| ∗The dot plots of a searched regulon are shown for all cell subpopulations in each disease state of each tissue based on the regulon specific score inferred using pySCENIC and by calculating the average expression. |
| Page: 1 |
Top |
Somatic mutation of malignant transformation related genes |
| Annotation of somatic variants for genes involved in malignant transformation |
| Hugo Symbol | Variant Class | Variant Classification | dbSNP RS | HGVSc | HGVSp | HGVSp Short | SWISSPROT | BIOTYPE | SIFT | PolyPhen | Tumor Sample Barcode | Tissue | Histology | Sex | Age | Stage | Therapy Types | Drugs | Outcome |
| WDR76 | SNV | Missense_Mutation | novel | c.1072N>A | p.Pro358Thr | p.P358T | Q9H967 | protein_coding | deleterious(0.03) | possibly_damaging(0.588) | TCGA-5L-AAT1-01 | Breast | breast invasive carcinoma | Female | <65 | III/IV | Hormone Therapy | letrozol | SD |
| WDR76 | SNV | Missense_Mutation | novel | c.1691N>C | p.Ile564Thr | p.I564T | Q9H967 | protein_coding | deleterious(0.04) | benign(0.006) | TCGA-A7-A6VY-01 | Breast | breast invasive carcinoma | Female | <65 | I/II | Chemotherapy | cyclophosphamide | CR |
| WDR76 | SNV | Missense_Mutation | novel | c.103N>G | p.Leu35Val | p.L35V | Q9H967 | protein_coding | tolerated_low_confidence(0.06) | benign(0.321) | TCGA-A8-A07U-01 | Breast | breast invasive carcinoma | Female | >=65 | III/IV | Chemotherapy | 5-fluorouracil | SD |
| WDR76 | SNV | Missense_Mutation | c.1746G>C | p.Lys582Asn | p.K582N | Q9H967 | protein_coding | deleterious(0) | benign(0.023) | TCGA-AC-A23H-01 | Breast | breast invasive carcinoma | Female | >=65 | I/II | Unknown | Unknown | PD | |
| WDR76 | SNV | Missense_Mutation | novel | c.1323G>T | p.Glu441Asp | p.E441D | Q9H967 | protein_coding | deleterious(0.01) | possibly_damaging(0.521) | TCGA-AN-A046-01 | Breast | breast invasive carcinoma | Female | >=65 | I/II | Unknown | Unknown | SD |
| WDR76 | SNV | Missense_Mutation | c.854N>C | p.Glu285Ala | p.E285A | Q9H967 | protein_coding | tolerated(0.17) | benign(0.003) | TCGA-BH-A0AV-01 | Breast | breast invasive carcinoma | Female | <65 | I/II | Chemotherapy | taxotere | CR | |
| WDR76 | SNV | Missense_Mutation | c.1403G>T | p.Gly468Val | p.G468V | Q9H967 | protein_coding | deleterious(0) | possibly_damaging(0.636) | TCGA-C8-A26Y-01 | Breast | breast invasive carcinoma | Female | >=65 | I/II | Unknown | Unknown | SD | |
| WDR76 | SNV | Missense_Mutation | c.1763N>T | p.Gly588Val | p.G588V | Q9H967 | protein_coding | tolerated(0.5) | benign(0.095) | TCGA-EW-A1P6-01 | Breast | breast invasive carcinoma | Female | <65 | I/II | Chemotherapy | cyclophosphamide | SD | |
| WDR76 | SNV | Missense_Mutation | c.249N>T | p.Lys83Asn | p.K83N | Q9H967 | protein_coding | deleterious(0.04) | benign(0.036) | TCGA-FU-A3HZ-01 | Cervix | cervical & endocervical cancer | Female | <65 | I/II | Chemotherapy | cisplatin | CR | |
| WDR76 | SNV | Missense_Mutation | c.224N>G | p.Ser75Cys | p.S75C | Q9H967 | protein_coding | deleterious(0.03) | possibly_damaging(0.754) | TCGA-IR-A3LA-01 | Cervix | cervical & endocervical cancer | Female | <65 | I/II | Chemotherapy | cisplatin | CR |
| Page: 1 2 3 4 5 6 |
Top |
Related drugs of malignant transformation related genes |
| Identification of chemicals and drugs interact with genes involved in malignant transfromation |
| (DGIdb 4.0) |
| Entrez ID | Symbol | Category | Interaction Types | Drug Claim Name | Drug Name | PMIDs |
| Page: 1 |

Copyright 2023-Present -The University of Texas Health Science Center at Houston |