
|
|||||
|
 | |
| |
| |
| |
| |
| |
|
Gene: WDR75 |
Gene summary for WDR75 |
| Gene information | Species | Human | Gene symbol | WDR75 | Gene ID | 84128 |
| Gene name | WD repeat domain 75 | |
| Gene Alias | NET16 | |
| Cytomap | 2q32.2 | |
| Gene Type | protein-coding | GO ID | GO:0006139 | UniProtAcc | Q8IWA0 |
Top |
Malignant transformation analysis |
| Identification of the aberrant gene expression in precancerous and cancerous lesions by comparing the gene expression of stem-like cells in diseased tissues with normal stem cells |
| Entrez ID | Symbol | Replicates | Species | Organ | Tissue | Adj P-value | Log2FC | Malignancy |
| 84128 | WDR75 | LZE4T | Human | Esophagus | ESCC | 4.18e-04 | 1.95e-01 | 0.0811 |
| 84128 | WDR75 | LZE7T | Human | Esophagus | ESCC | 4.22e-02 | 1.19e-01 | 0.0667 |
| 84128 | WDR75 | LZE20T | Human | Esophagus | ESCC | 1.41e-02 | 7.74e-02 | 0.0662 |
| 84128 | WDR75 | LZE24T | Human | Esophagus | ESCC | 5.53e-05 | 2.66e-01 | 0.0596 |
| 84128 | WDR75 | P2T-E | Human | Esophagus | ESCC | 2.58e-25 | 3.85e-01 | 0.1177 |
| 84128 | WDR75 | P4T-E | Human | Esophagus | ESCC | 1.04e-20 | 6.43e-01 | 0.1323 |
| 84128 | WDR75 | P5T-E | Human | Esophagus | ESCC | 1.33e-16 | 4.22e-01 | 0.1327 |
| 84128 | WDR75 | P8T-E | Human | Esophagus | ESCC | 2.14e-17 | 1.97e-01 | 0.0889 |
| 84128 | WDR75 | P9T-E | Human | Esophagus | ESCC | 4.14e-06 | 1.77e-01 | 0.1131 |
| 84128 | WDR75 | P10T-E | Human | Esophagus | ESCC | 1.23e-15 | 3.28e-01 | 0.116 |
| 84128 | WDR75 | P11T-E | Human | Esophagus | ESCC | 5.38e-09 | 4.02e-01 | 0.1426 |
| 84128 | WDR75 | P12T-E | Human | Esophagus | ESCC | 1.32e-28 | 5.07e-01 | 0.1122 |
| 84128 | WDR75 | P15T-E | Human | Esophagus | ESCC | 8.29e-21 | 5.28e-01 | 0.1149 |
| 84128 | WDR75 | P16T-E | Human | Esophagus | ESCC | 1.47e-23 | 3.22e-01 | 0.1153 |
| 84128 | WDR75 | P20T-E | Human | Esophagus | ESCC | 4.88e-18 | 5.14e-01 | 0.1124 |
| 84128 | WDR75 | P21T-E | Human | Esophagus | ESCC | 2.22e-23 | 4.63e-01 | 0.1617 |
| 84128 | WDR75 | P22T-E | Human | Esophagus | ESCC | 1.42e-36 | 6.54e-01 | 0.1236 |
| 84128 | WDR75 | P23T-E | Human | Esophagus | ESCC | 1.98e-57 | 1.69e+00 | 0.108 |
| 84128 | WDR75 | P24T-E | Human | Esophagus | ESCC | 1.86e-18 | 4.54e-01 | 0.1287 |
| 84128 | WDR75 | P26T-E | Human | Esophagus | ESCC | 3.71e-23 | 3.77e-01 | 0.1276 |
| Page: 1 2 3 4 5 |
| Tissue | Expression Dynamics | Abbreviation |
| Esophagus |  | ESCC: Esophageal squamous cell carcinoma |
| HGIN: High-grade intraepithelial neoplasias | ||
| LGIN: Low-grade intraepithelial neoplasias | ||
| Liver | 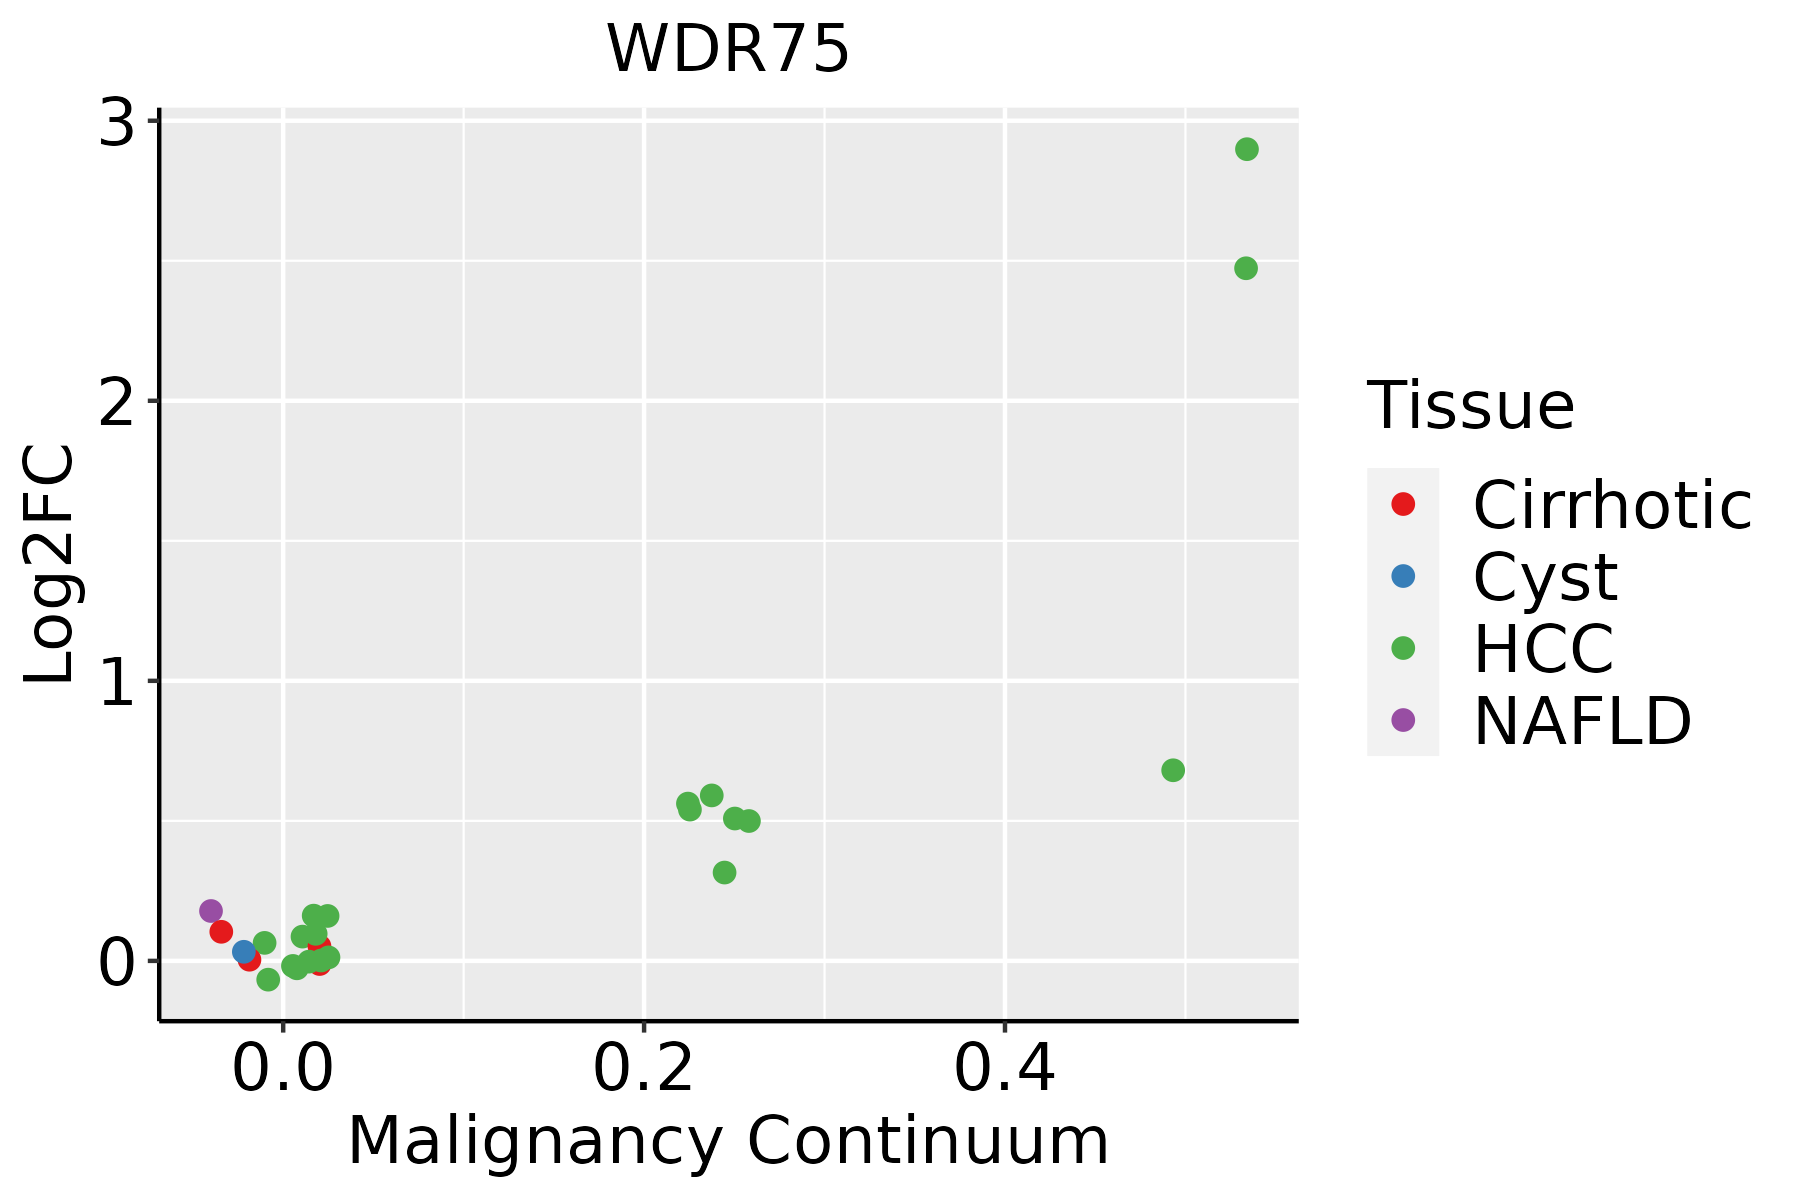 | HCC: Hepatocellular carcinoma |
| NAFLD: Non-alcoholic fatty liver disease | ||
| Oral Cavity | 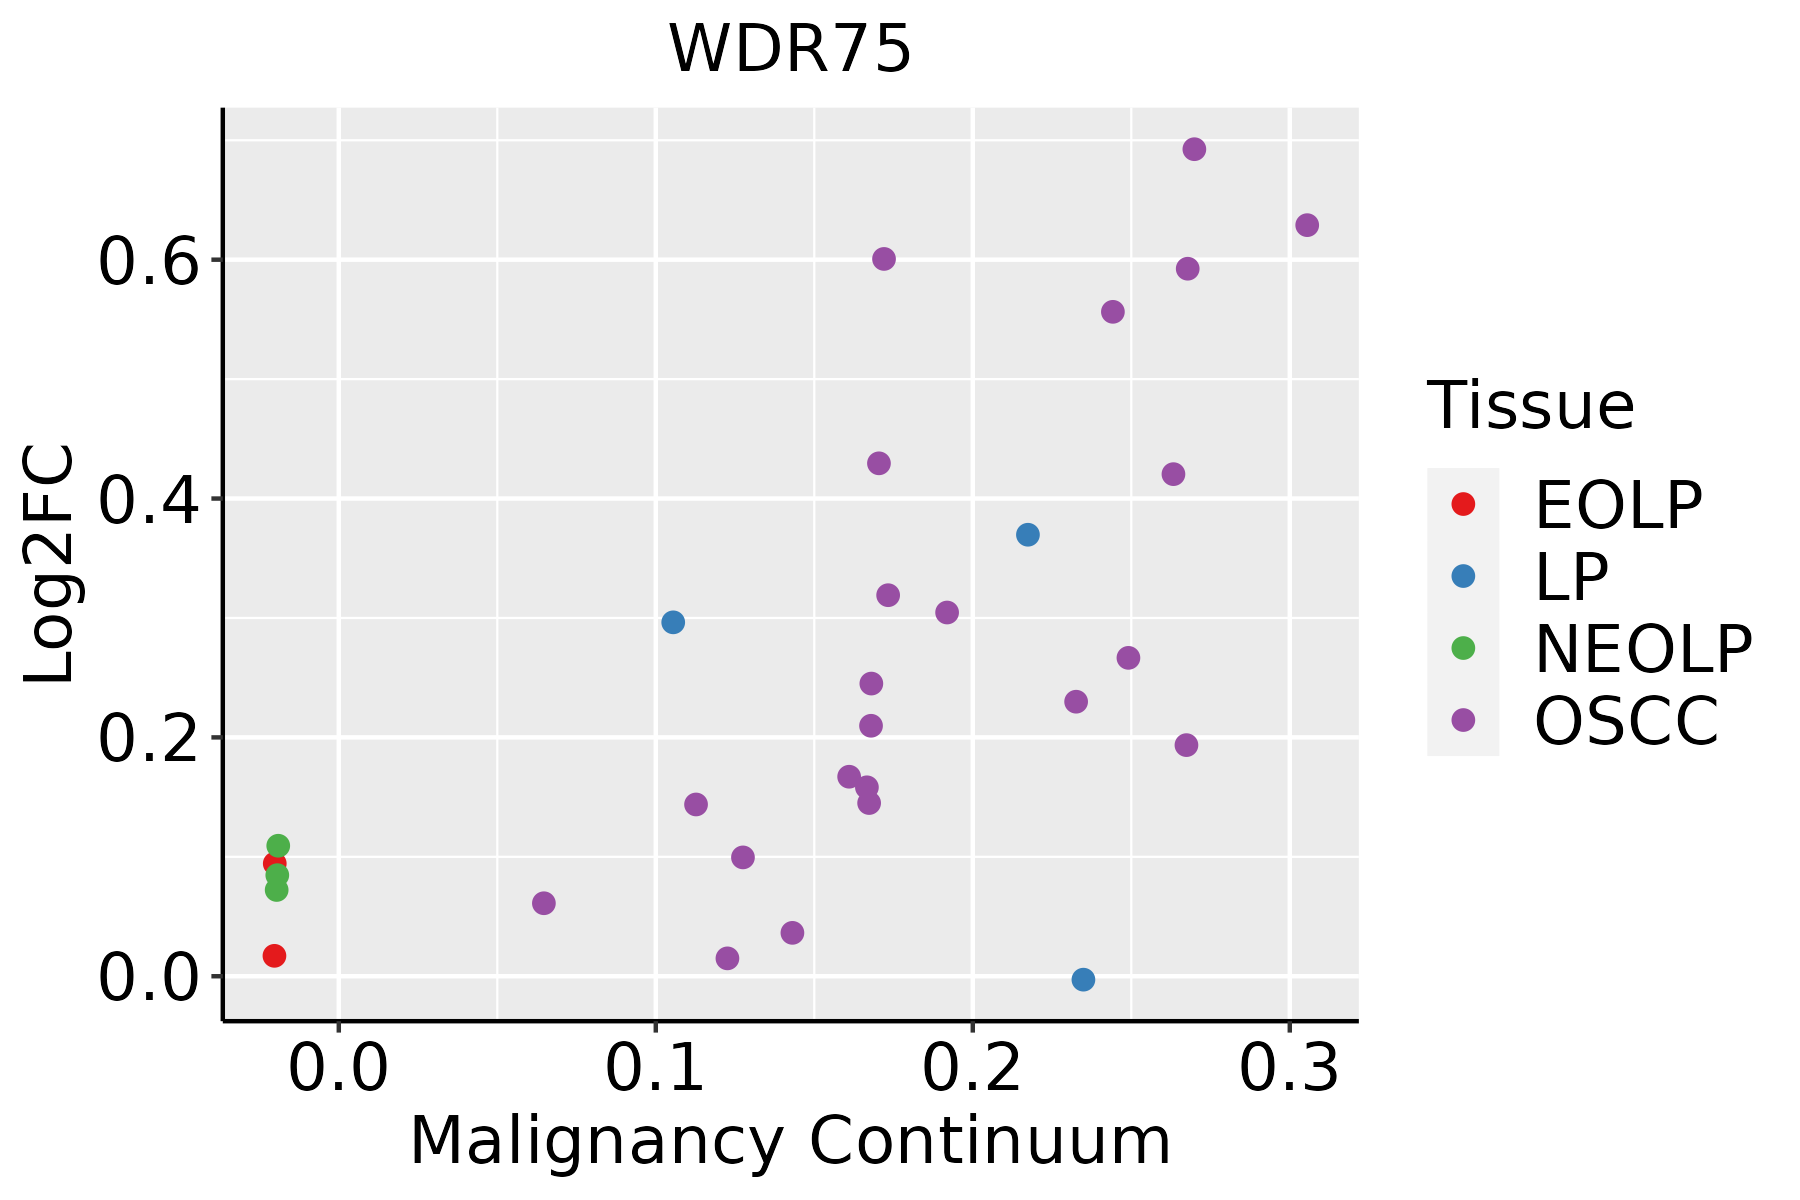 | EOLP: Erosive Oral lichen planus |
| LP: leukoplakia | ||
| NEOLP: Non-erosive oral lichen planus | ||
| OSCC: Oral squamous cell carcinoma | ||
| Skin | 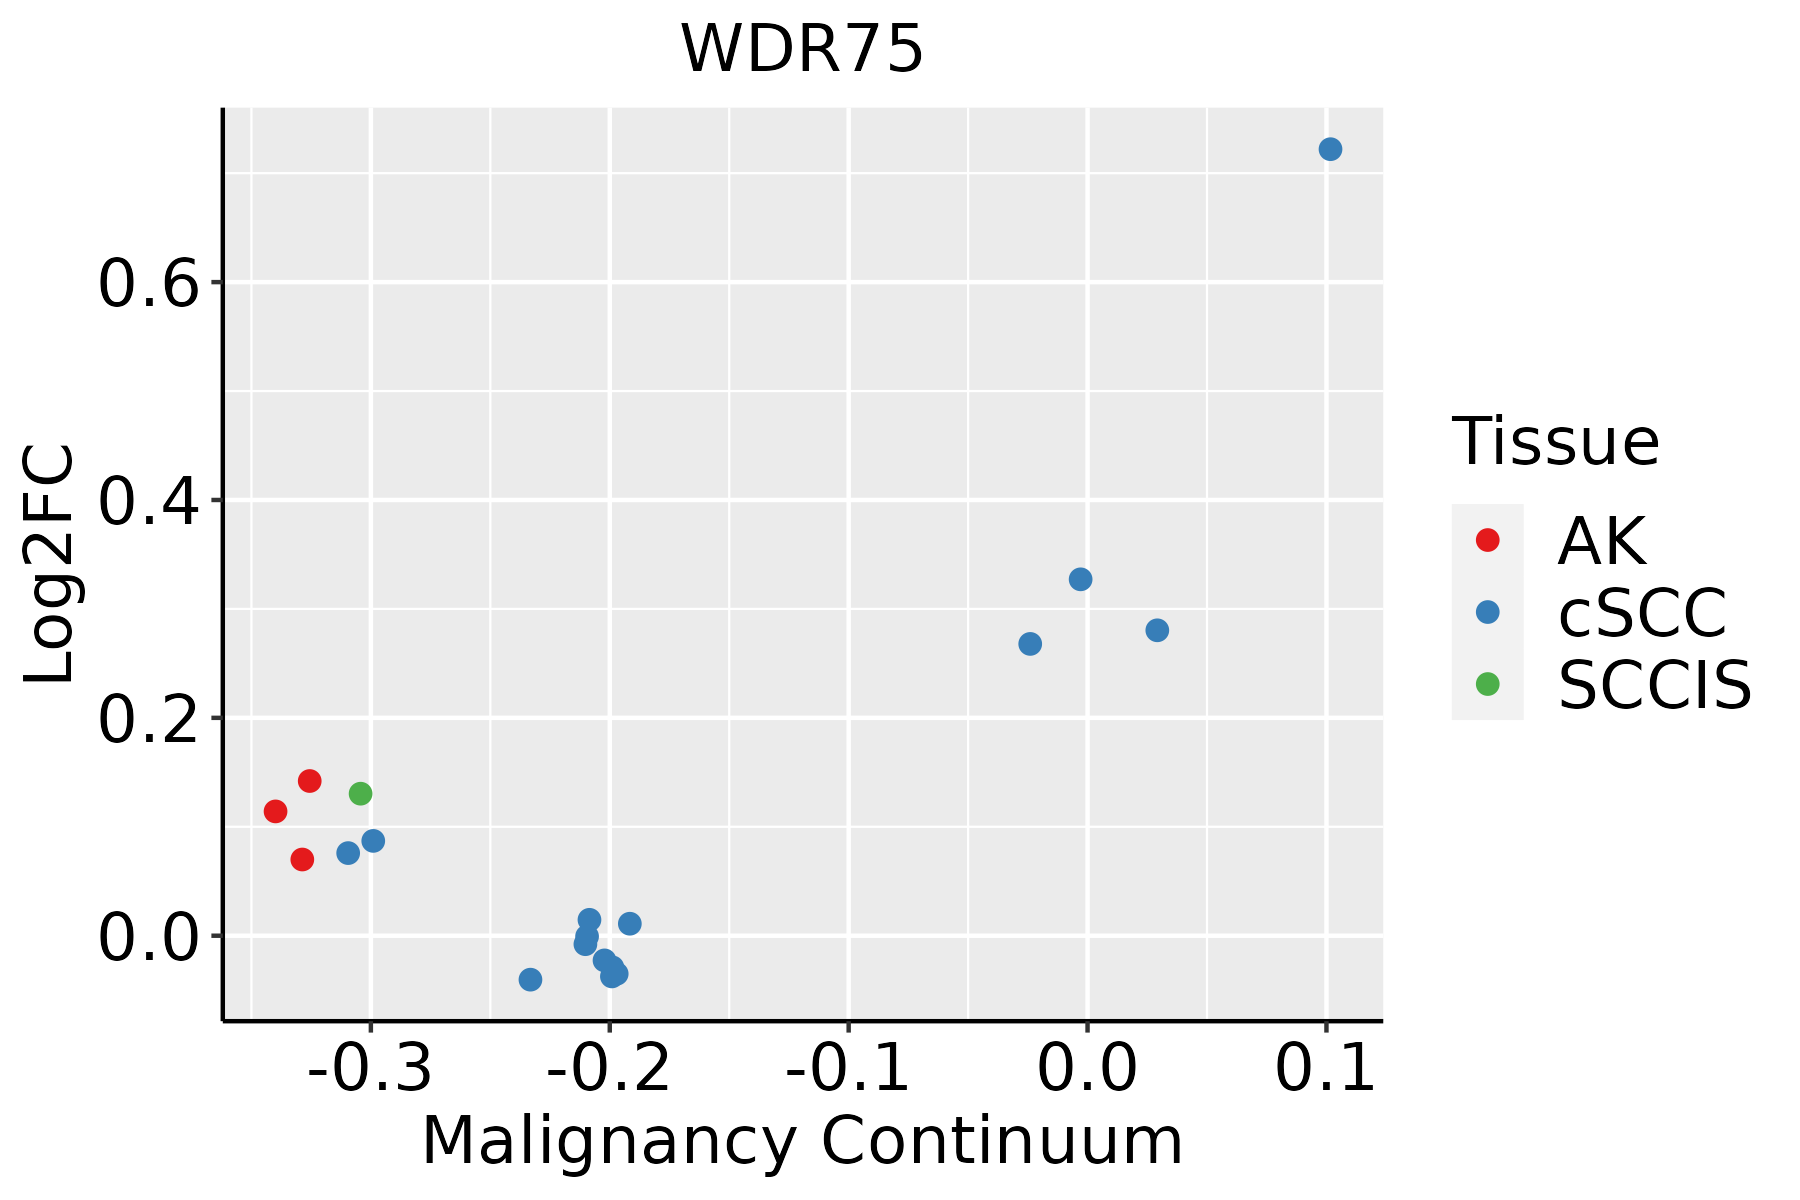 | AK: Actinic keratosis |
| cSCC: Cutaneous squamous cell carcinoma | ||
| SCCIS:squamous cell carcinoma in situ | ||
| Thyroid |  | ATC: Anaplastic thyroid cancer |
| HT: Hashimoto's thyroiditis | ||
| PTC: Papillary thyroid cancer |
| ∗log2FC in expression of this searched gene in stem-like cells from each diseased tissue sample relative to stem-like cells in normal samples in each tissue plotted against the malignancy continuum. Samples are colored based on if they are from different disease stage. |
Top |
Malignant transformation related pathway analysis |
| Find out the enriched GO biological processes and KEGG pathways involved in transition from healthy to precancer to cancer |
| Tissue | Disease Stage | Enriched GO biological Processes |
| Colorectum | AD |  |
| Colorectum | SER |  |
| Colorectum | MSS |  |
| Colorectum | MSI-H |  |
| Colorectum | FAP |  |
| ∗Top 15 enriched GO BP terms are showed in the bar plot of each disease state in each tissue. Each row represents a significant GO biological process which is colored according to the -log10(p.adjust). |
| Page: 1 2 3 4 5 6 7 8 9 |
| GO ID | Tissue | Disease Stage | Description | Gene Ratio | Bg Ratio | pvalue | p.adjust | Count |
| GO:0022613111 | Esophagus | ESCC | ribonucleoprotein complex biogenesis | 365/8552 | 463/18723 | 1.74e-49 | 1.11e-45 | 365 |
| GO:0042254111 | Esophagus | ESCC | ribosome biogenesis | 252/8552 | 299/18723 | 3.27e-44 | 1.04e-40 | 252 |
| GO:003447015 | Esophagus | ESCC | ncRNA processing | 300/8552 | 395/18723 | 3.09e-35 | 3.26e-32 | 300 |
| GO:0016072110 | Esophagus | ESCC | rRNA metabolic process | 197/8552 | 236/18723 | 1.31e-33 | 1.18e-30 | 197 |
| GO:0006364110 | Esophagus | ESCC | rRNA processing | 189/8552 | 225/18723 | 4.88e-33 | 3.87e-30 | 189 |
| GO:003466012 | Esophagus | ESCC | ncRNA metabolic process | 346/8552 | 485/18723 | 4.35e-31 | 2.51e-28 | 346 |
| GO:00063602 | Esophagus | ESCC | transcription by RNA polymerase I | 42/8552 | 55/18723 | 3.41e-06 | 3.78e-05 | 42 |
| GO:00063564 | Esophagus | ESCC | regulation of transcription by RNA polymerase I | 27/8552 | 34/18723 | 6.01e-05 | 4.62e-04 | 27 |
| GO:00459432 | Esophagus | ESCC | positive regulation of transcription by RNA polymerase I | 19/8552 | 23/18723 | 3.12e-04 | 1.85e-03 | 19 |
| GO:2000234 | Esophagus | ESCC | positive regulation of rRNA processing | 9/8552 | 10/18723 | 5.09e-03 | 1.92e-02 | 9 |
| GO:002261322 | Liver | HCC | ribonucleoprotein complex biogenesis | 355/7958 | 463/18723 | 7.76e-52 | 4.92e-48 | 355 |
| GO:004225422 | Liver | HCC | ribosome biogenesis | 246/7958 | 299/18723 | 4.99e-46 | 1.58e-42 | 246 |
| GO:00344702 | Liver | HCC | ncRNA processing | 293/7958 | 395/18723 | 4.26e-38 | 6.76e-35 | 293 |
| GO:001607212 | Liver | HCC | rRNA metabolic process | 193/7958 | 236/18723 | 1.26e-35 | 1.14e-32 | 193 |
| GO:000636421 | Liver | HCC | rRNA processing | 185/7958 | 225/18723 | 8.14e-35 | 6.45e-32 | 185 |
| GO:00346601 | Liver | HCC | ncRNA metabolic process | 332/7958 | 485/18723 | 1.48e-31 | 7.80e-29 | 332 |
| GO:0006360 | Liver | HCC | transcription by RNA polymerase I | 36/7958 | 55/18723 | 4.94e-04 | 3.23e-03 | 36 |
| GO:0006356 | Liver | HCC | regulation of transcription by RNA polymerase I | 24/7958 | 34/18723 | 8.62e-04 | 5.13e-03 | 24 |
| GO:0045943 | Liver | HCC | positive regulation of transcription by RNA polymerase I | 16/7958 | 23/18723 | 8.04e-03 | 3.17e-02 | 16 |
| GO:002261320 | Oral cavity | OSCC | ribonucleoprotein complex biogenesis | 333/7305 | 463/18723 | 8.28e-48 | 5.24e-44 | 333 |
| Page: 1 2 3 |
| Pathway ID | Tissue | Disease Stage | Description | Gene Ratio | Bg Ratio | pvalue | p.adjust | qvalue | Count |
| Page: 1 |
Top |
Cell-cell communication analysis |
| Identification of potential cell-cell interactions between two cell types and their ligand-receptor pairs for different disease states |
| Ligand | Receptor | LRpair | Pathway | Tissue | Disease Stage |
| Page: 1 |
Top |
Single-cell gene regulatory network inference analysis |
| Find out the significant the regulons (TFs) and the target genes of each regulon across cell types for different disease states |
| TF | Cell Type | Tissue | Disease Stage | Target Gene | RSS | Regulon Activity |
| ∗The dot plots of a searched regulon are shown for all cell subpopulations in each disease state of each tissue based on the regulon specific score inferred using pySCENIC and by calculating the average expression. |
| Page: 1 |
Top |
Somatic mutation of malignant transformation related genes |
| Annotation of somatic variants for genes involved in malignant transformation |
| Hugo Symbol | Variant Class | Variant Classification | dbSNP RS | HGVSc | HGVSp | HGVSp Short | SWISSPROT | BIOTYPE | SIFT | PolyPhen | Tumor Sample Barcode | Tissue | Histology | Sex | Age | Stage | Therapy Types | Drugs | Outcome |
| WDR75 | SNV | Missense_Mutation | novel | c.364G>A | p.Glu122Lys | p.E122K | Q8IWA0 | protein_coding | tolerated(0.65) | benign(0.014) | TCGA-5L-AAT1-01 | Breast | breast invasive carcinoma | Female | <65 | III/IV | Hormone Therapy | letrozol | SD |
| WDR75 | SNV | Missense_Mutation | rs146243526 | c.2434N>A | p.Glu812Lys | p.E812K | Q8IWA0 | protein_coding | tolerated(0.16) | benign(0.162) | TCGA-AC-A23H-01 | Breast | breast invasive carcinoma | Female | >=65 | I/II | Unknown | Unknown | PD |
| WDR75 | SNV | Missense_Mutation | c.1559T>C | p.Ile520Thr | p.I520T | Q8IWA0 | protein_coding | tolerated(0.63) | benign(0.01) | TCGA-AR-A0U2-01 | Breast | breast invasive carcinoma | Female | <65 | III/IV | Hormone Therapy | tamoxiphen | PD | |
| WDR75 | insertion | Frame_Shift_Ins | novel | c.2342_2343insTTCAGATG | p.Glu784ValfsTer20 | p.E784Vfs*20 | Q8IWA0 | protein_coding | TCGA-AC-A23H-01 | Breast | breast invasive carcinoma | Female | >=65 | I/II | Unknown | Unknown | PD | ||
| WDR75 | SNV | Missense_Mutation | c.1092N>C | p.Gln364His | p.Q364H | Q8IWA0 | protein_coding | tolerated(0.41) | benign(0.007) | TCGA-DR-A0ZM-01 | Cervix | cervical & endocervical cancer | Female | <65 | III/IV | Unspecific | Cisplatin | SD | |
| WDR75 | SNV | Missense_Mutation | novel | c.745N>C | p.Asp249His | p.D249H | Q8IWA0 | protein_coding | deleterious(0.02) | benign(0.313) | TCGA-JW-A5VL-01 | Cervix | cervical & endocervical cancer | Female | <65 | I/II | Unknown | Unknown | SD |
| WDR75 | SNV | Missense_Mutation | rs528766591 | c.803N>A | p.Arg268His | p.R268H | Q8IWA0 | protein_coding | tolerated(0.12) | benign(0.006) | TCGA-A6-5659-01 | Colorectum | colon adenocarcinoma | Male | >=65 | I/II | Unknown | Unknown | SD |
| WDR75 | SNV | Missense_Mutation | c.1715N>A | p.Ser572Asn | p.S572N | Q8IWA0 | protein_coding | tolerated(0.06) | benign(0.165) | TCGA-AA-3856-01 | Colorectum | colon adenocarcinoma | Male | <65 | I/II | Unknown | Unknown | SD | |
| WDR75 | SNV | Missense_Mutation | c.1532C>T | p.Ser511Phe | p.S511F | Q8IWA0 | protein_coding | deleterious(0) | probably_damaging(0.996) | TCGA-AA-3977-01 | Colorectum | colon adenocarcinoma | Male | >=65 | I/II | Unknown | Unknown | SD | |
| WDR75 | SNV | Missense_Mutation | c.1532C>A | p.Ser511Tyr | p.S511Y | Q8IWA0 | protein_coding | deleterious(0) | probably_damaging(0.996) | TCGA-AA-3984-01 | Colorectum | colon adenocarcinoma | Female | <65 | I/II | Unknown | Unknown | SD |
| Page: 1 2 3 4 5 6 |
Top |
Related drugs of malignant transformation related genes |
| Identification of chemicals and drugs interact with genes involved in malignant transfromation |
| (DGIdb 4.0) |
| Entrez ID | Symbol | Category | Interaction Types | Drug Claim Name | Drug Name | PMIDs |
| Page: 1 |

Copyright 2023-Present -The University of Texas Health Science Center at Houston |