
|
|||||
|
 | |
| |
| |
| |
| |
| |
|
Gene: WDR73 |
Gene summary for WDR73 |
| Gene information | Species | Human | Gene symbol | WDR73 | Gene ID | 84942 |
| Gene name | WD repeat domain 73 | |
| Gene Alias | GAMOS | |
| Cytomap | 15q25.2 | |
| Gene Type | protein-coding | GO ID | GO:0000226 | UniProtAcc | Q5RKY8 |
Top |
Malignant transformation analysis |
| Identification of the aberrant gene expression in precancerous and cancerous lesions by comparing the gene expression of stem-like cells in diseased tissues with normal stem cells |
| Entrez ID | Symbol | Replicates | Species | Organ | Tissue | Adj P-value | Log2FC | Malignancy |
| 84942 | WDR73 | LZE4T | Human | Esophagus | ESCC | 1.90e-02 | 9.19e-02 | 0.0811 |
| 84942 | WDR73 | LZE7T | Human | Esophagus | ESCC | 5.06e-05 | 2.95e-01 | 0.0667 |
| 84942 | WDR73 | LZE24T | Human | Esophagus | ESCC | 7.21e-11 | 1.73e-01 | 0.0596 |
| 84942 | WDR73 | P1T-E | Human | Esophagus | ESCC | 1.17e-11 | 4.40e-01 | 0.0875 |
| 84942 | WDR73 | P2T-E | Human | Esophagus | ESCC | 6.49e-18 | 3.70e-01 | 0.1177 |
| 84942 | WDR73 | P4T-E | Human | Esophagus | ESCC | 3.89e-24 | 4.15e-01 | 0.1323 |
| 84942 | WDR73 | P5T-E | Human | Esophagus | ESCC | 9.54e-11 | 1.07e-01 | 0.1327 |
| 84942 | WDR73 | P8T-E | Human | Esophagus | ESCC | 4.83e-17 | 2.95e-01 | 0.0889 |
| 84942 | WDR73 | P9T-E | Human | Esophagus | ESCC | 4.87e-13 | 2.51e-01 | 0.1131 |
| 84942 | WDR73 | P10T-E | Human | Esophagus | ESCC | 2.96e-21 | 4.10e-01 | 0.116 |
| 84942 | WDR73 | P11T-E | Human | Esophagus | ESCC | 4.86e-04 | 1.53e-01 | 0.1426 |
| 84942 | WDR73 | P12T-E | Human | Esophagus | ESCC | 1.74e-11 | 2.08e-01 | 0.1122 |
| 84942 | WDR73 | P15T-E | Human | Esophagus | ESCC | 1.52e-17 | 3.61e-01 | 0.1149 |
| 84942 | WDR73 | P16T-E | Human | Esophagus | ESCC | 2.95e-23 | 4.56e-01 | 0.1153 |
| 84942 | WDR73 | P20T-E | Human | Esophagus | ESCC | 6.11e-06 | 1.07e-01 | 0.1124 |
| 84942 | WDR73 | P21T-E | Human | Esophagus | ESCC | 4.16e-05 | 8.69e-02 | 0.1617 |
| 84942 | WDR73 | P22T-E | Human | Esophagus | ESCC | 3.19e-12 | 1.71e-01 | 0.1236 |
| 84942 | WDR73 | P23T-E | Human | Esophagus | ESCC | 4.37e-21 | 3.74e-01 | 0.108 |
| 84942 | WDR73 | P24T-E | Human | Esophagus | ESCC | 3.71e-12 | 1.27e-01 | 0.1287 |
| 84942 | WDR73 | P26T-E | Human | Esophagus | ESCC | 2.00e-14 | 2.05e-01 | 0.1276 |
| Page: 1 2 3 4 5 |
| Tissue | Expression Dynamics | Abbreviation |
| Esophagus |  | ESCC: Esophageal squamous cell carcinoma |
| HGIN: High-grade intraepithelial neoplasias | ||
| LGIN: Low-grade intraepithelial neoplasias | ||
| Liver | 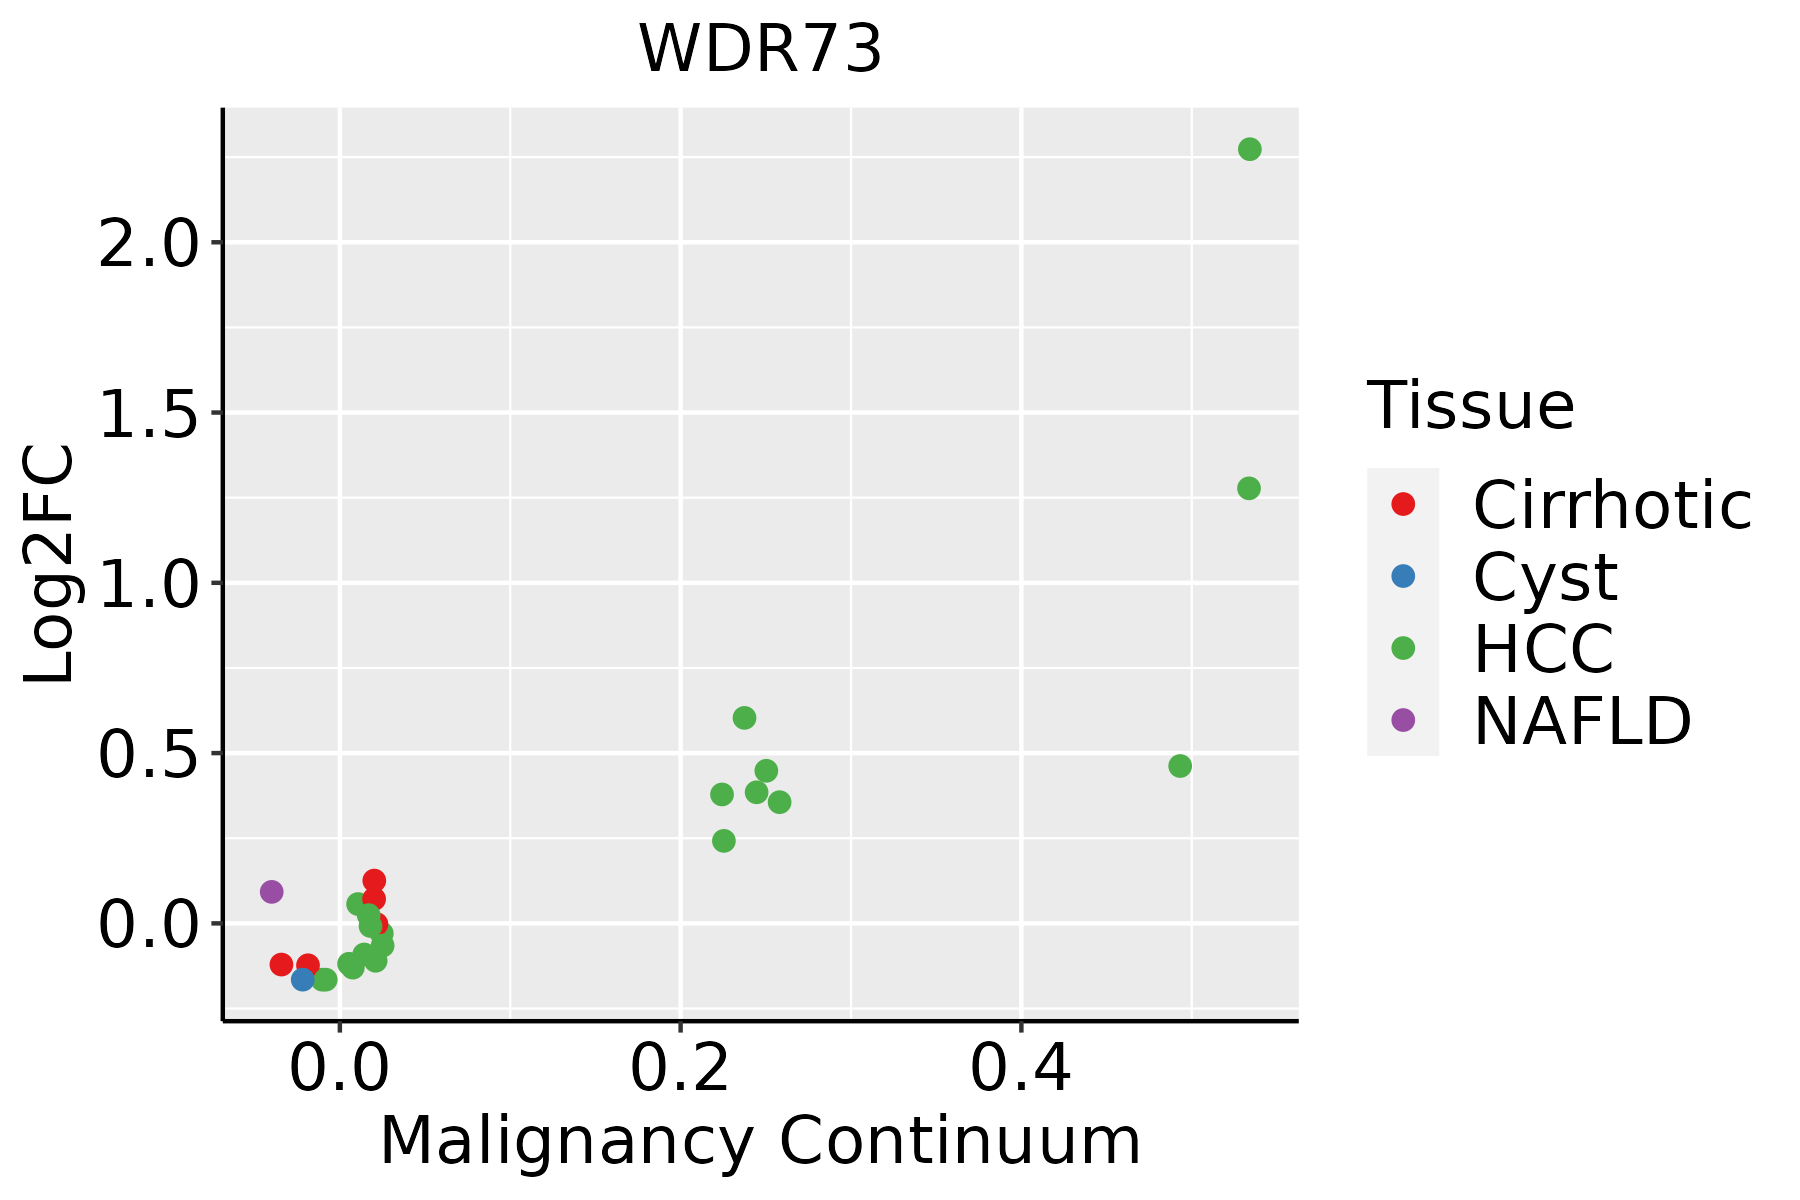 | HCC: Hepatocellular carcinoma |
| NAFLD: Non-alcoholic fatty liver disease | ||
| Oral Cavity |  | EOLP: Erosive Oral lichen planus |
| LP: leukoplakia | ||
| NEOLP: Non-erosive oral lichen planus | ||
| OSCC: Oral squamous cell carcinoma | ||
| Thyroid | 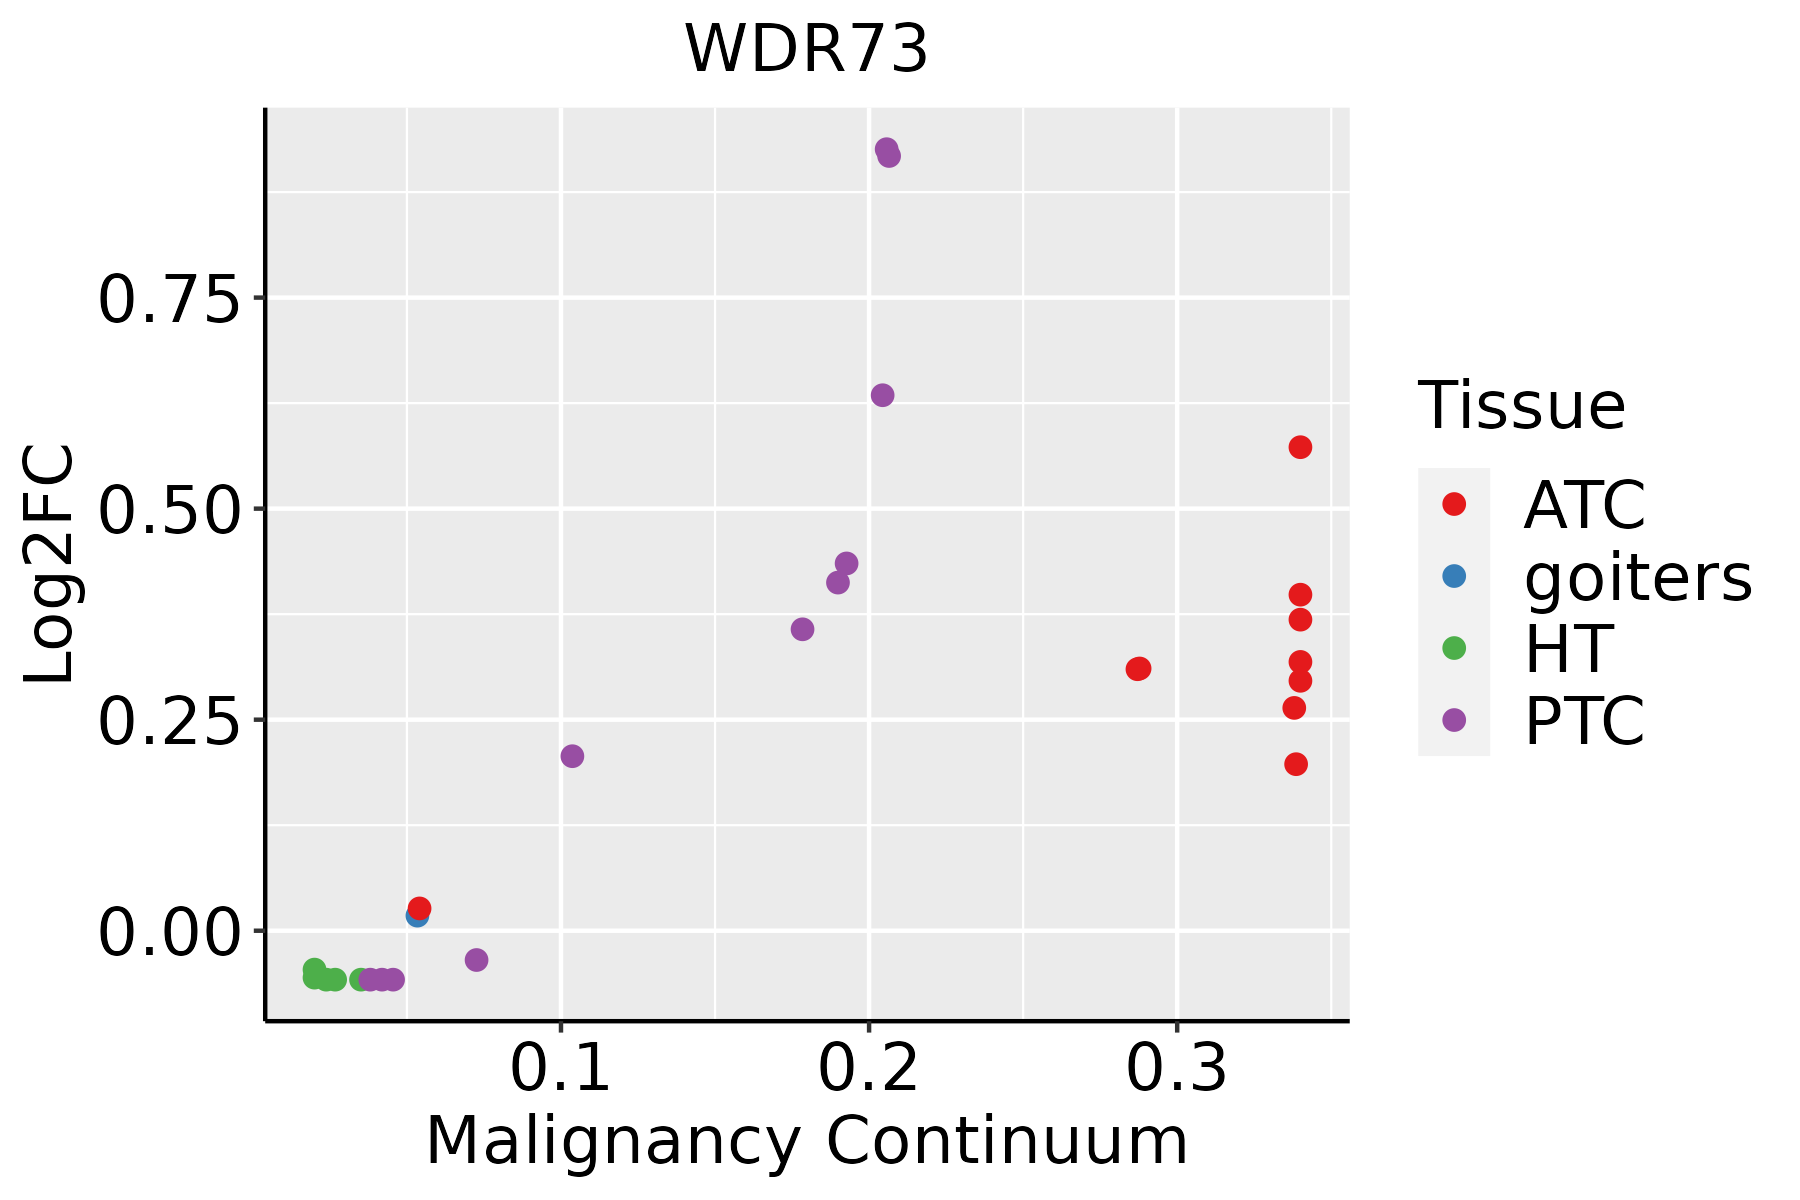 | ATC: Anaplastic thyroid cancer |
| HT: Hashimoto's thyroiditis | ||
| PTC: Papillary thyroid cancer |
| ∗log2FC in expression of this searched gene in stem-like cells from each diseased tissue sample relative to stem-like cells in normal samples in each tissue plotted against the malignancy continuum. Samples are colored based on if they are from different disease stage. |
Top |
Malignant transformation related pathway analysis |
| Find out the enriched GO biological processes and KEGG pathways involved in transition from healthy to precancer to cancer |
| Tissue | Disease Stage | Enriched GO biological Processes |
| Colorectum | AD |  |
| Colorectum | SER |  |
| Colorectum | MSS |  |
| Colorectum | MSI-H |  |
| Colorectum | FAP |  |
| ∗Top 15 enriched GO BP terms are showed in the bar plot of each disease state in each tissue. Each row represents a significant GO biological process which is colored according to the -log10(p.adjust). |
| Page: 1 2 3 4 5 6 7 8 9 |
| GO ID | Tissue | Disease Stage | Description | Gene Ratio | Bg Ratio | pvalue | p.adjust | Count |
| GO:000699713 | Esophagus | ESCC | nucleus organization | 96/8552 | 133/18723 | 4.66e-10 | 1.21e-08 | 96 |
| GO:00311227 | Esophagus | ESCC | cytoplasmic microtubule organization | 38/8552 | 56/18723 | 6.60e-04 | 3.50e-03 | 38 |
| GO:0006997 | Liver | Cirrhotic | nucleus organization | 48/4634 | 133/18723 | 2.27e-03 | 1.38e-02 | 48 |
| GO:00069971 | Liver | HCC | nucleus organization | 82/7958 | 133/18723 | 6.32e-06 | 7.72e-05 | 82 |
| GO:00311222 | Liver | HCC | cytoplasmic microtubule organization | 35/7958 | 56/18723 | 2.00e-03 | 1.01e-02 | 35 |
| GO:00069974 | Oral cavity | OSCC | nucleus organization | 85/7305 | 133/18723 | 5.12e-09 | 1.12e-07 | 85 |
| GO:00311226 | Oral cavity | OSCC | cytoplasmic microtubule organization | 39/7305 | 56/18723 | 3.29e-06 | 3.93e-05 | 39 |
| GO:00311229 | Thyroid | PTC | cytoplasmic microtubule organization | 34/5968 | 56/18723 | 8.20e-06 | 9.42e-05 | 34 |
| GO:00069977 | Thyroid | PTC | nucleus organization | 65/5968 | 133/18723 | 3.16e-05 | 3.01e-04 | 65 |
| GO:003112215 | Thyroid | ATC | cytoplasmic microtubule organization | 34/6293 | 56/18723 | 2.92e-05 | 2.45e-04 | 34 |
| GO:000699714 | Thyroid | ATC | nucleus organization | 65/6293 | 133/18723 | 1.87e-04 | 1.26e-03 | 65 |
| Page: 1 |
| Pathway ID | Tissue | Disease Stage | Description | Gene Ratio | Bg Ratio | pvalue | p.adjust | qvalue | Count |
| Page: 1 |
Top |
Cell-cell communication analysis |
| Identification of potential cell-cell interactions between two cell types and their ligand-receptor pairs for different disease states |
| Ligand | Receptor | LRpair | Pathway | Tissue | Disease Stage |
| Page: 1 |
Top |
Single-cell gene regulatory network inference analysis |
| Find out the significant the regulons (TFs) and the target genes of each regulon across cell types for different disease states |
| TF | Cell Type | Tissue | Disease Stage | Target Gene | RSS | Regulon Activity |
| ∗The dot plots of a searched regulon are shown for all cell subpopulations in each disease state of each tissue based on the regulon specific score inferred using pySCENIC and by calculating the average expression. |
| Page: 1 |
Top |
Somatic mutation of malignant transformation related genes |
| Annotation of somatic variants for genes involved in malignant transformation |
| Hugo Symbol | Variant Class | Variant Classification | dbSNP RS | HGVSc | HGVSp | HGVSp Short | SWISSPROT | BIOTYPE | SIFT | PolyPhen | Tumor Sample Barcode | Tissue | Histology | Sex | Age | Stage | Therapy Types | Drugs | Outcome |
| WDR73 | SNV | Missense_Mutation | novel | c.208C>A | p.Pro70Thr | p.P70T | Q6P4I2 | protein_coding | deleterious(0) | probably_damaging(0.988) | TCGA-A8-A092-01 | Breast | breast invasive carcinoma | Female | <65 | III/IV | Chemotherapy | paclitaxel | CR |
| WDR73 | SNV | Missense_Mutation | rs764013056 | c.230G>A | p.Arg77His | p.R77H | Q6P4I2 | protein_coding | tolerated(0.12) | benign(0.001) | TCGA-A8-A09Z-01 | Breast | breast invasive carcinoma | Female | >=65 | I/II | Unknown | Unknown | SD |
| WDR73 | SNV | Missense_Mutation | novel | c.1048N>G | p.His350Asp | p.H350D | Q6P4I2 | protein_coding | deleterious(0) | probably_damaging(0.997) | TCGA-B6-A0IA-01 | Breast | breast invasive carcinoma | Female | <65 | I/II | Unknown | Unknown | SD |
| WDR73 | insertion | Nonsense_Mutation | novel | c.206_207insGTGAGTGCACAAGTGTGTGCA | p.Phe69delinsLeuTerValHisLysCysValHis | p.F69delinsL*VHKCVH | Q6P4I2 | protein_coding | TCGA-A8-A092-01 | Breast | breast invasive carcinoma | Female | <65 | III/IV | Chemotherapy | paclitaxel | CR | ||
| WDR73 | insertion | Nonsense_Mutation | novel | c.827_828insTTATCTGTAAAATGAGGATAGTAAGAACTA | p.Pro276_Glu277insTyrLeuTerAsnGluAspSerLysAsnTer | p.P276_E277insYL*NEDSKN* | Q6P4I2 | protein_coding | TCGA-B6-A0I5-01 | Breast | breast invasive carcinoma | Female | <65 | I/II | Unknown | Unknown | SD | ||
| WDR73 | SNV | Missense_Mutation | c.345G>C | p.Glu115Asp | p.E115D | Q6P4I2 | protein_coding | tolerated(0.17) | probably_damaging(0.99) | TCGA-DR-A0ZM-01 | Cervix | cervical & endocervical cancer | Female | <65 | III/IV | Unspecific | Cisplatin | SD | |
| WDR73 | SNV | Missense_Mutation | novel | c.222N>G | p.Phe74Leu | p.F74L | Q6P4I2 | protein_coding | tolerated(0.08) | probably_damaging(0.994) | TCGA-VS-A9UP-01 | Cervix | cervical & endocervical cancer | Female | <65 | I/II | Chemotherapy | cisplatin | PD |
| WDR73 | SNV | Missense_Mutation | c.403C>A | p.Leu135Ile | p.L135I | Q6P4I2 | protein_coding | tolerated(0.43) | possibly_damaging(0.528) | TCGA-AA-A010-01 | Colorectum | colon adenocarcinoma | Female | <65 | I/II | Chemotherapy | folinic | CR | |
| WDR73 | SNV | Missense_Mutation | rs370117772 | c.590N>T | p.Ser197Leu | p.S197L | Q6P4I2 | protein_coding | deleterious(0.03) | probably_damaging(0.996) | TCGA-F5-6814-01 | Colorectum | rectum adenocarcinoma | Male | <65 | I/II | Unknown | Unknown | SD |
| WDR73 | deletion | Frame_Shift_Del | c.143delA | p.Lys48ArgfsTer7 | p.K48Rfs*7 | Q6P4I2 | protein_coding | TCGA-G4-6309-01 | Colorectum | colon adenocarcinoma | Female | <65 | III/IV | Chemotherapy | xeloda | PD |
| Page: 1 2 |
Top |
Related drugs of malignant transformation related genes |
| Identification of chemicals and drugs interact with genes involved in malignant transfromation |
| (DGIdb 4.0) |
| Entrez ID | Symbol | Category | Interaction Types | Drug Claim Name | Drug Name | PMIDs |
| Page: 1 |

Copyright 2023-Present -The University of Texas Health Science Center at Houston |