
|
|||||
|
 | |
| |
| |
| |
| |
| |
|
Gene: WDR70 |
Gene summary for WDR70 |
| Gene information | Species | Human | Gene symbol | WDR70 | Gene ID | 55100 |
| Gene name | WD repeat domain 70 | |
| Gene Alias | WDR70 | |
| Cytomap | 5p13.2 | |
| Gene Type | protein-coding | GO ID | GO:0000729 | UniProtAcc | Q9NW82 |
Top |
Malignant transformation analysis |
| Identification of the aberrant gene expression in precancerous and cancerous lesions by comparing the gene expression of stem-like cells in diseased tissues with normal stem cells |
| Entrez ID | Symbol | Replicates | Species | Organ | Tissue | Adj P-value | Log2FC | Malignancy |
| 55100 | WDR70 | CCI_1 | Human | Cervix | CC | 7.54e-10 | 9.61e-01 | 0.528 |
| 55100 | WDR70 | CCI_3 | Human | Cervix | CC | 1.51e-17 | 1.16e+00 | 0.516 |
| 55100 | WDR70 | HTA11_3410_2000001011 | Human | Colorectum | AD | 1.17e-18 | -5.76e-01 | 0.0155 |
| 55100 | WDR70 | HTA11_2487_2000001011 | Human | Colorectum | SER | 6.74e-05 | -4.21e-01 | -0.1808 |
| 55100 | WDR70 | HTA11_3361_2000001011 | Human | Colorectum | AD | 4.37e-06 | -5.82e-01 | -0.1207 |
| 55100 | WDR70 | HTA11_696_2000001011 | Human | Colorectum | AD | 1.06e-05 | -4.07e-01 | -0.1464 |
| 55100 | WDR70 | HTA11_7862_2000001011 | Human | Colorectum | AD | 7.08e-04 | -5.10e-01 | -0.0179 |
| 55100 | WDR70 | HTA11_866_3004761011 | Human | Colorectum | AD | 3.92e-11 | -5.12e-01 | 0.096 |
| 55100 | WDR70 | HTA11_8622_2000001021 | Human | Colorectum | SER | 1.10e-02 | -6.34e-01 | 0.0528 |
| 55100 | WDR70 | HTA11_7696_3000711011 | Human | Colorectum | AD | 6.87e-11 | -4.55e-01 | 0.0674 |
| 55100 | WDR70 | HTA11_99999970781_79442 | Human | Colorectum | MSS | 7.90e-08 | -4.79e-01 | 0.294 |
| 55100 | WDR70 | HTA11_99999971662_82457 | Human | Colorectum | MSS | 3.35e-02 | -3.42e-01 | 0.3859 |
| 55100 | WDR70 | HTA11_99999973899_84307 | Human | Colorectum | MSS | 3.62e-06 | -6.00e-01 | 0.2585 |
| 55100 | WDR70 | HTA11_99999974143_84620 | Human | Colorectum | MSS | 1.65e-22 | -6.76e-01 | 0.3005 |
| 55100 | WDR70 | A015-C-203 | Human | Colorectum | FAP | 1.48e-26 | -3.74e-01 | -0.1294 |
| 55100 | WDR70 | A014-C-040 | Human | Colorectum | FAP | 1.68e-02 | -2.58e-01 | -0.1184 |
| 55100 | WDR70 | A002-C-201 | Human | Colorectum | FAP | 3.53e-09 | -2.11e-01 | 0.0324 |
| 55100 | WDR70 | A001-C-119 | Human | Colorectum | FAP | 1.07e-03 | -1.89e-01 | -0.1557 |
| 55100 | WDR70 | A001-C-108 | Human | Colorectum | FAP | 1.63e-14 | -2.84e-02 | -0.0272 |
| 55100 | WDR70 | A002-C-205 | Human | Colorectum | FAP | 2.76e-21 | -1.78e-01 | -0.1236 |
| Page: 1 2 3 4 5 6 7 8 9 |
| Tissue | Expression Dynamics | Abbreviation |
| Cervix |  | CC: Cervix cancer |
| HSIL_HPV: HPV-infected high-grade squamous intraepithelial lesions | ||
| N_HPV: HPV-infected normal cervix | ||
| Colorectum (GSE201348) |  | FAP: Familial adenomatous polyposis |
| CRC: Colorectal cancer | ||
| Colorectum (HTA11) |  | AD: Adenomas |
| SER: Sessile serrated lesions | ||
| MSI-H: Microsatellite-high colorectal cancer | ||
| MSS: Microsatellite stable colorectal cancer | ||
| Endometrium |  | AEH: Atypical endometrial hyperplasia |
| EEC: Endometrioid Cancer | ||
| Esophagus | 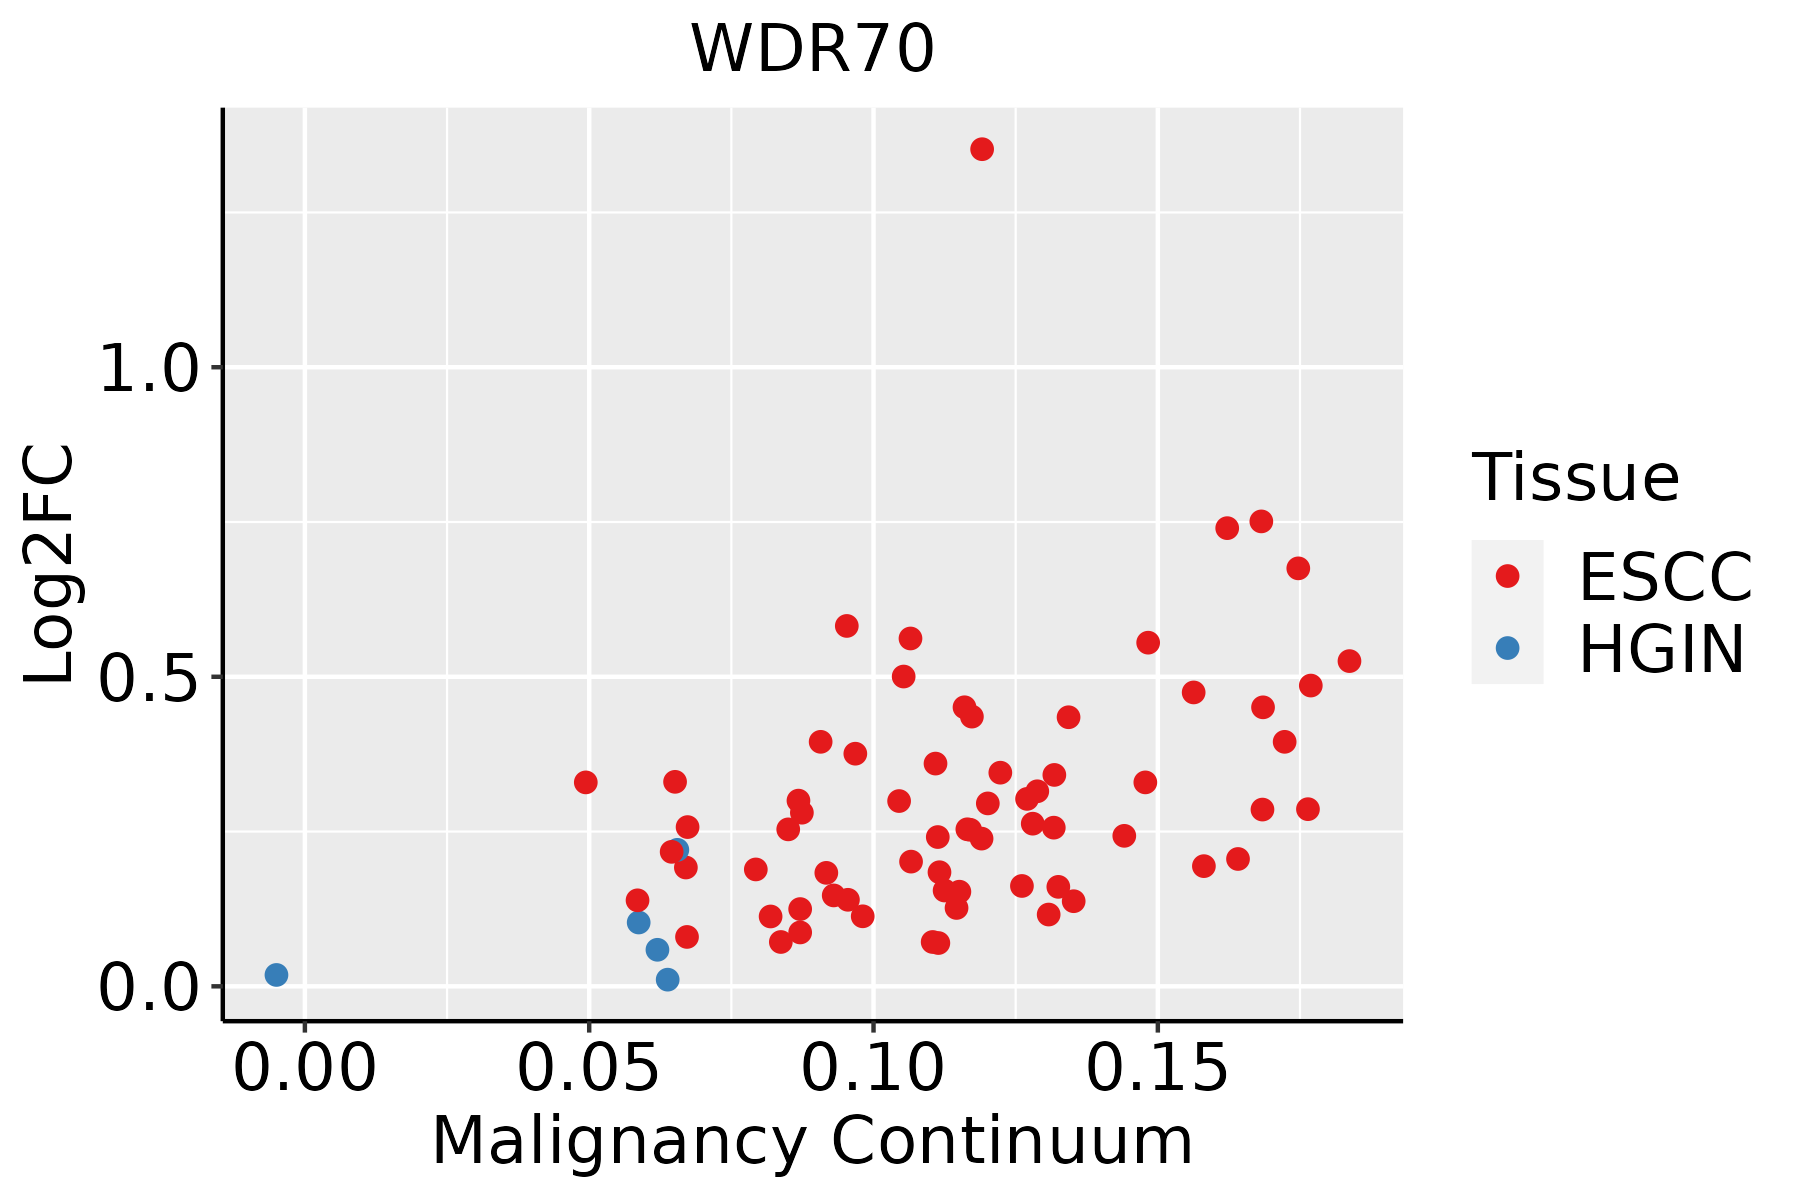 | ESCC: Esophageal squamous cell carcinoma |
| HGIN: High-grade intraepithelial neoplasias | ||
| LGIN: Low-grade intraepithelial neoplasias | ||
| Liver |  | HCC: Hepatocellular carcinoma |
| NAFLD: Non-alcoholic fatty liver disease | ||
| Lung |  | AAH: Atypical adenomatous hyperplasia |
| AIS: Adenocarcinoma in situ | ||
| IAC: Invasive lung adenocarcinoma | ||
| MIA: Minimally invasive adenocarcinoma | ||
| Oral Cavity | 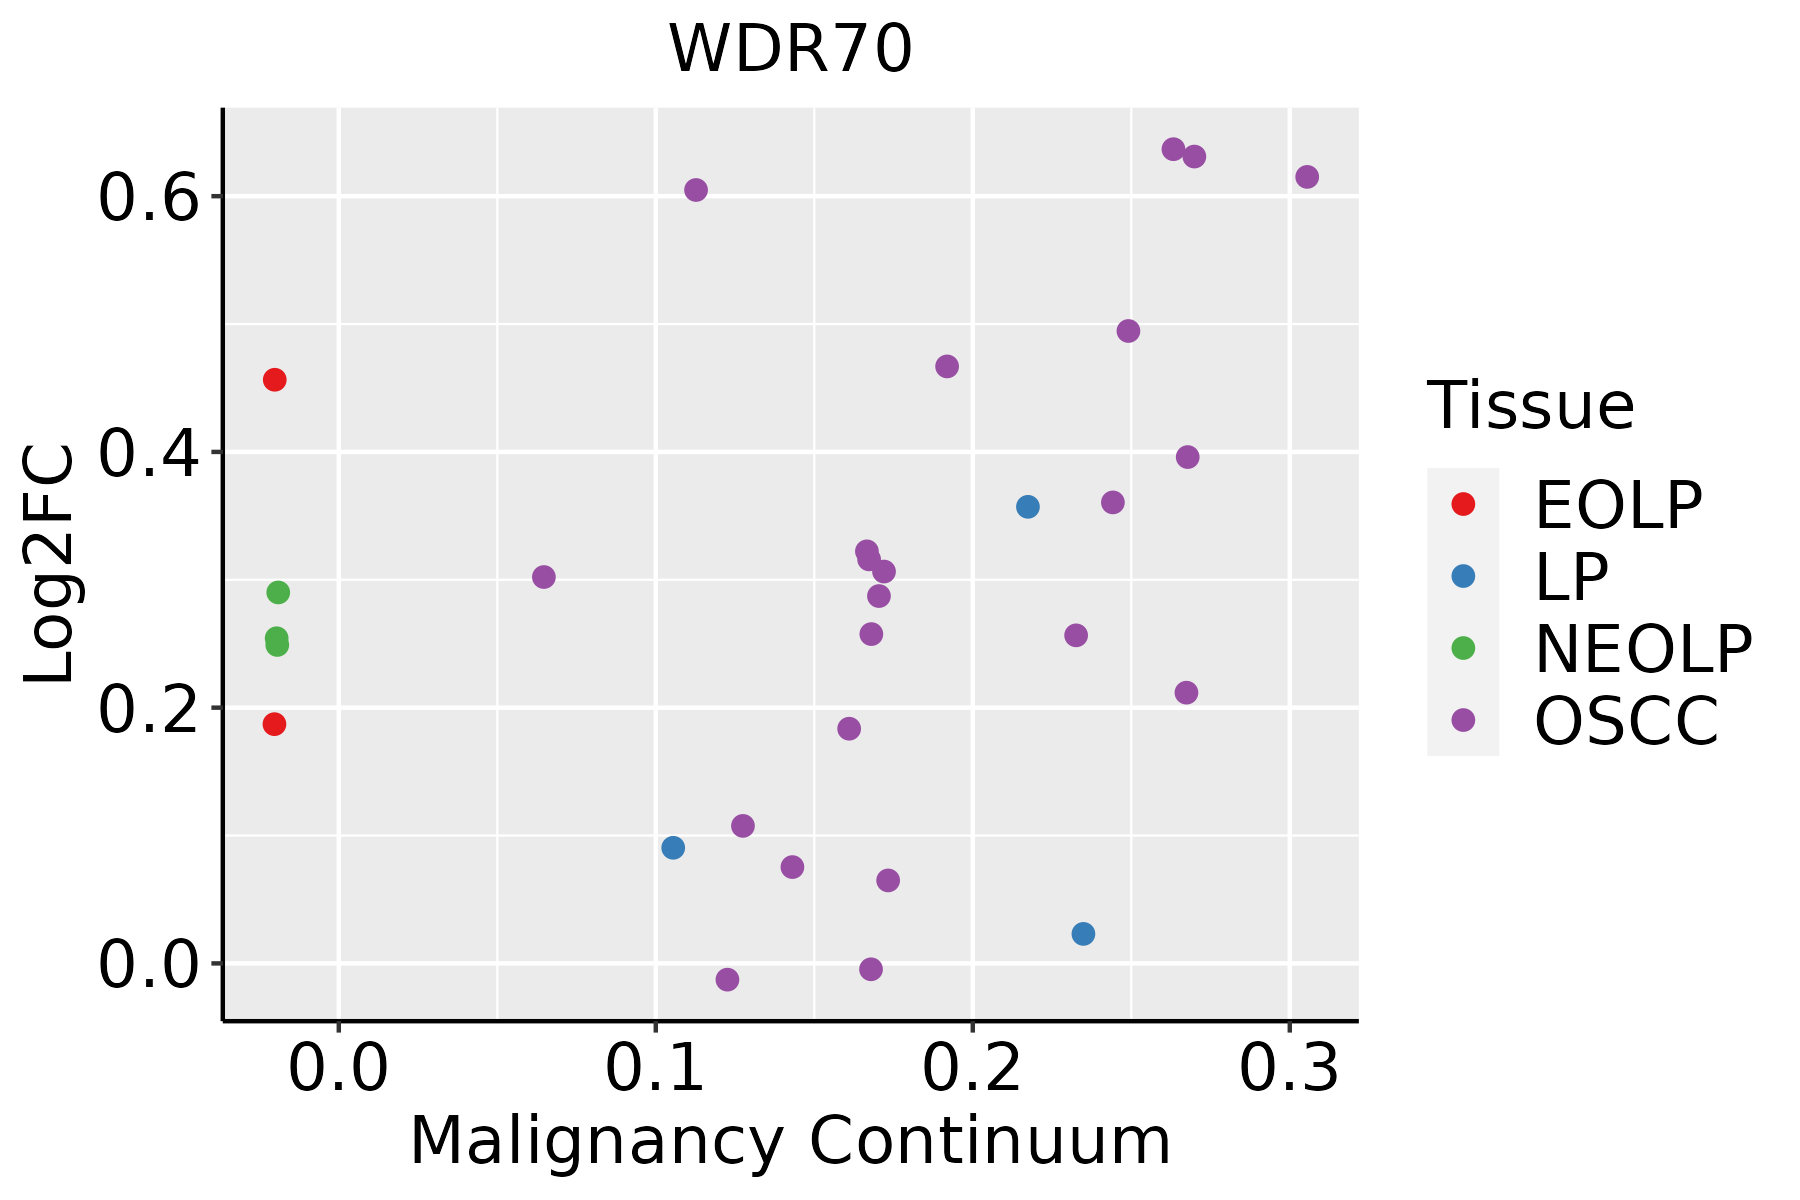 | EOLP: Erosive Oral lichen planus |
| LP: leukoplakia | ||
| NEOLP: Non-erosive oral lichen planus | ||
| OSCC: Oral squamous cell carcinoma | ||
| Skin | 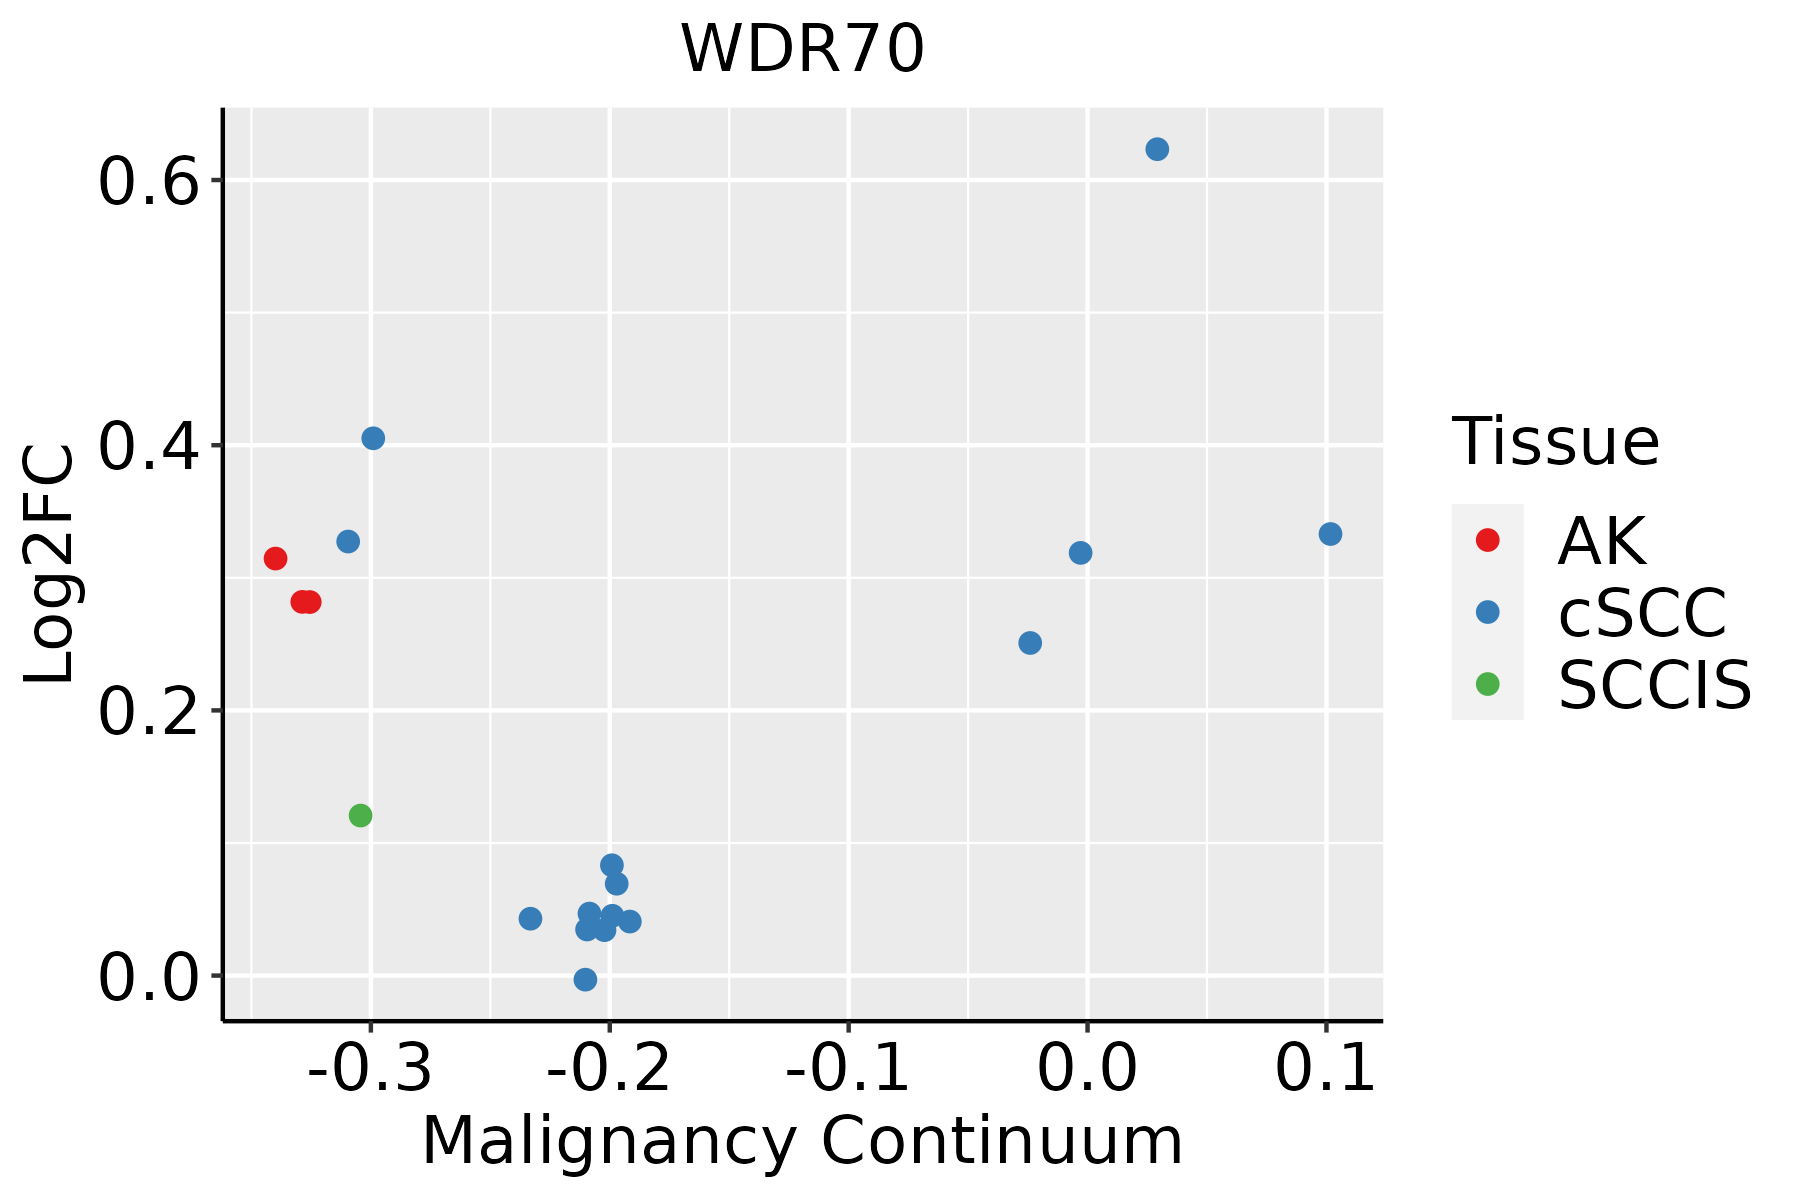 | AK: Actinic keratosis |
| cSCC: Cutaneous squamous cell carcinoma | ||
| SCCIS:squamous cell carcinoma in situ | ||
| Thyroid |  | ATC: Anaplastic thyroid cancer |
| HT: Hashimoto's thyroiditis | ||
| PTC: Papillary thyroid cancer |
| ∗log2FC in expression of this searched gene in stem-like cells from each diseased tissue sample relative to stem-like cells in normal samples in each tissue plotted against the malignancy continuum. Samples are colored based on if they are from different disease stage. |
Top |
Malignant transformation related pathway analysis |
| Find out the enriched GO biological processes and KEGG pathways involved in transition from healthy to precancer to cancer |
| Tissue | Disease Stage | Enriched GO biological Processes |
| Colorectum | AD |  |
| Colorectum | SER |  |
| Colorectum | MSS |  |
| Colorectum | MSI-H |  |
| Colorectum | FAP |  |
| ∗Top 15 enriched GO BP terms are showed in the bar plot of each disease state in each tissue. Each row represents a significant GO biological process which is colored according to the -log10(p.adjust). |
| Page: 1 2 3 4 5 6 7 8 9 |
| GO ID | Tissue | Disease Stage | Description | Gene Ratio | Bg Ratio | pvalue | p.adjust | Count |
| GO:190332010 | Cervix | CC | regulation of protein modification by small protein conjugation or removal | 66/2311 | 242/18723 | 2.31e-10 | 3.46e-08 | 66 |
| GO:003139610 | Cervix | CC | regulation of protein ubiquitination | 59/2311 | 210/18723 | 5.90e-10 | 7.51e-08 | 59 |
| GO:00165705 | Cervix | CC | histone modification | 84/2311 | 463/18723 | 1.70e-04 | 2.01e-03 | 84 |
| GO:00310565 | Cervix | CC | regulation of histone modification | 33/2311 | 152/18723 | 7.97e-04 | 7.00e-03 | 33 |
| GO:00510528 | Cervix | CC | regulation of DNA metabolic process | 65/2311 | 359/18723 | 9.25e-04 | 7.84e-03 | 65 |
| GO:1903320 | Colorectum | AD | regulation of protein modification by small protein conjugation or removal | 86/3918 | 242/18723 | 9.43e-08 | 4.65e-06 | 86 |
| GO:0051052 | Colorectum | AD | regulation of DNA metabolic process | 116/3918 | 359/18723 | 2.47e-07 | 1.00e-05 | 116 |
| GO:0031396 | Colorectum | AD | regulation of protein ubiquitination | 72/3918 | 210/18723 | 4.50e-06 | 1.21e-04 | 72 |
| GO:0031056 | Colorectum | AD | regulation of histone modification | 45/3918 | 152/18723 | 7.05e-03 | 4.31e-02 | 45 |
| GO:19033201 | Colorectum | SER | regulation of protein modification by small protein conjugation or removal | 70/2897 | 242/18723 | 6.84e-08 | 4.42e-06 | 70 |
| GO:00313961 | Colorectum | SER | regulation of protein ubiquitination | 62/2897 | 210/18723 | 1.69e-07 | 9.71e-06 | 62 |
| GO:00510521 | Colorectum | SER | regulation of DNA metabolic process | 83/2897 | 359/18723 | 8.03e-05 | 1.77e-03 | 83 |
| GO:00310561 | Colorectum | SER | regulation of histone modification | 37/2897 | 152/18723 | 2.80e-03 | 2.50e-02 | 37 |
| GO:19033202 | Colorectum | MSS | regulation of protein modification by small protein conjugation or removal | 82/3467 | 242/18723 | 7.49e-09 | 4.63e-07 | 82 |
| GO:00510522 | Colorectum | MSS | regulation of DNA metabolic process | 108/3467 | 359/18723 | 5.86e-08 | 3.10e-06 | 108 |
| GO:00313962 | Colorectum | MSS | regulation of protein ubiquitination | 70/3467 | 210/18723 | 1.88e-07 | 8.26e-06 | 70 |
| GO:0016570 | Colorectum | MSS | histone modification | 113/3467 | 463/18723 | 8.37e-04 | 8.68e-03 | 113 |
| GO:0006302 | Colorectum | MSS | double-strand break repair | 64/3467 | 251/18723 | 3.58e-03 | 2.65e-02 | 64 |
| GO:00310562 | Colorectum | MSS | regulation of histone modification | 41/3467 | 152/18723 | 6.41e-03 | 4.27e-02 | 41 |
| GO:0016574 | Colorectum | MSS | histone ubiquitination | 16/3467 | 47/18723 | 8.22e-03 | 4.99e-02 | 16 |
| Page: 1 2 3 4 5 6 7 |
| Pathway ID | Tissue | Disease Stage | Description | Gene Ratio | Bg Ratio | pvalue | p.adjust | qvalue | Count |
| Page: 1 |
Top |
Cell-cell communication analysis |
| Identification of potential cell-cell interactions between two cell types and their ligand-receptor pairs for different disease states |
| Ligand | Receptor | LRpair | Pathway | Tissue | Disease Stage |
| Page: 1 |
Top |
Single-cell gene regulatory network inference analysis |
| Find out the significant the regulons (TFs) and the target genes of each regulon across cell types for different disease states |
| TF | Cell Type | Tissue | Disease Stage | Target Gene | RSS | Regulon Activity |
| ∗The dot plots of a searched regulon are shown for all cell subpopulations in each disease state of each tissue based on the regulon specific score inferred using pySCENIC and by calculating the average expression. |
| Page: 1 |
Top |
Somatic mutation of malignant transformation related genes |
| Annotation of somatic variants for genes involved in malignant transformation |
| Hugo Symbol | Variant Class | Variant Classification | dbSNP RS | HGVSc | HGVSp | HGVSp Short | SWISSPROT | BIOTYPE | SIFT | PolyPhen | Tumor Sample Barcode | Tissue | Histology | Sex | Age | Stage | Therapy Types | Drugs | Outcome |
| WDR70 | insertion | Nonsense_Mutation | novel | c.456_457insAGCCTCCCGAGTAGCTGGGATTAAAGGCATGCGCTACCACGCCT | p.Ala153SerfsTer8 | p.A153Sfs*8 | Q9NW82 | protein_coding | TCGA-BH-A0B1-01 | Breast | breast invasive carcinoma | Female | >=65 | I/II | Chemotherapy | adriamycin | SD | ||
| WDR70 | SNV | Missense_Mutation | c.1750N>G | p.Leu584Val | p.L584V | Q9NW82 | protein_coding | deleterious(0) | probably_damaging(0.994) | TCGA-EA-A3Y4-01 | Cervix | cervical & endocervical cancer | Female | <65 | I/II | Unknown | Unknown | SD | |
| WDR70 | SNV | Missense_Mutation | novel | c.1272N>G | p.Phe424Leu | p.F424L | Q9NW82 | protein_coding | deleterious(0.04) | benign(0.112) | TCGA-JW-A5VL-01 | Cervix | cervical & endocervical cancer | Female | <65 | I/II | Unknown | Unknown | SD |
| WDR70 | SNV | Missense_Mutation | c.1175T>C | p.Val392Ala | p.V392A | Q9NW82 | protein_coding | tolerated(0.58) | benign(0.003) | TCGA-AA-3713-01 | Colorectum | colon adenocarcinoma | Male | >=65 | III/IV | Chemotherapy | 5-fluorouracil | PR | |
| WDR70 | SNV | Missense_Mutation | c.1196A>G | p.Asp399Gly | p.D399G | Q9NW82 | protein_coding | deleterious(0) | probably_damaging(0.991) | TCGA-AA-3966-01 | Colorectum | colon adenocarcinoma | Female | >=65 | I/II | Unknown | Unknown | SD | |
| WDR70 | SNV | Missense_Mutation | c.164N>A | p.Arg55His | p.R55H | Q9NW82 | protein_coding | deleterious(0.01) | possibly_damaging(0.474) | TCGA-AZ-4615-01 | Colorectum | colon adenocarcinoma | Male | >=65 | III/IV | Chemotherapy | xeloda | PD | |
| WDR70 | SNV | Missense_Mutation | c.1883N>G | p.Gln628Arg | p.Q628R | Q9NW82 | protein_coding | deleterious(0) | probably_damaging(0.994) | TCGA-AZ-4615-01 | Colorectum | colon adenocarcinoma | Male | >=65 | III/IV | Chemotherapy | xeloda | PD | |
| WDR70 | SNV | Missense_Mutation | novel | c.1328C>T | p.Ser443Phe | p.S443F | Q9NW82 | protein_coding | deleterious(0) | probably_damaging(0.915) | TCGA-AG-A002-01 | Colorectum | rectum adenocarcinoma | Male | <65 | I/II | Unknown | Unknown | SD |
| WDR70 | SNV | Missense_Mutation | c.602G>A | p.Gly201Glu | p.G201E | Q9NW82 | protein_coding | deleterious(0) | probably_damaging(0.992) | TCGA-EI-6883-01 | Colorectum | rectum adenocarcinoma | Male | <65 | I/II | Chemotherapy | 5fluorouracil+leucovorin | SD | |
| WDR70 | deletion | Frame_Shift_Del | c.991delN | p.Val333SerfsTer15 | p.V333Sfs*15 | Q9NW82 | protein_coding | TCGA-AA-3672-01 | Colorectum | colon adenocarcinoma | Female | >=65 | III/IV | Unknown | Unknown | SD |
| Page: 1 2 3 4 5 6 7 8 |
Top |
Related drugs of malignant transformation related genes |
| Identification of chemicals and drugs interact with genes involved in malignant transfromation |
| (DGIdb 4.0) |
| Entrez ID | Symbol | Category | Interaction Types | Drug Claim Name | Drug Name | PMIDs |
| Page: 1 |

Copyright 2023-Present -The University of Texas Health Science Center at Houston |