
|
|||||
|
 | |
| |
| |
| |
| |
| |
|
Gene: WDR66 |
Gene summary for WDR66 |
| Gene information | Species | Human | Gene symbol | WDR66 | Gene ID | 144406 |
| Gene name | cilia and flagella associated protein 251 | |
| Gene Alias | CaM-IP4 | |
| Cytomap | 12q24.31 | |
| Gene Type | protein-coding | GO ID | GO:0000003 | UniProtAcc | Q8TBY9 |
Top |
Malignant transformation analysis |
| Identification of the aberrant gene expression in precancerous and cancerous lesions by comparing the gene expression of stem-like cells in diseased tissues with normal stem cells |
| Entrez ID | Symbol | Replicates | Species | Organ | Tissue | Adj P-value | Log2FC | Malignancy |
| 144406 | WDR66 | Tumor | Human | Cervix | CC | 7.57e-38 | 6.06e-01 | 0.1241 |
| 144406 | WDR66 | sample1 | Human | Cervix | CC | 7.41e-03 | 3.07e-01 | 0.0959 |
| 144406 | WDR66 | sample3 | Human | Cervix | CC | 6.49e-35 | 5.89e-01 | 0.1387 |
| 144406 | WDR66 | T1 | Human | Cervix | CC | 4.13e-04 | 2.23e-01 | 0.0918 |
| 144406 | WDR66 | T3 | Human | Cervix | CC | 8.27e-42 | 6.23e-01 | 0.1389 |
| 144406 | WDR66 | LZE2T | Human | Esophagus | ESCC | 7.81e-06 | 4.33e-01 | 0.082 |
| 144406 | WDR66 | LZE4T | Human | Esophagus | ESCC | 5.69e-16 | 5.59e-01 | 0.0811 |
| 144406 | WDR66 | LZE22T | Human | Esophagus | ESCC | 2.34e-02 | 3.37e-01 | 0.068 |
| 144406 | WDR66 | LZE24T | Human | Esophagus | ESCC | 2.99e-03 | 2.44e-01 | 0.0596 |
| 144406 | WDR66 | LZE6T | Human | Esophagus | ESCC | 2.99e-05 | 5.56e-01 | 0.0845 |
| 144406 | WDR66 | P2T-E | Human | Esophagus | ESCC | 1.25e-09 | 6.18e-02 | 0.1177 |
| 144406 | WDR66 | P4T-E | Human | Esophagus | ESCC | 8.35e-08 | 2.11e-01 | 0.1323 |
| 144406 | WDR66 | P5T-E | Human | Esophagus | ESCC | 1.18e-40 | 9.00e-01 | 0.1327 |
| 144406 | WDR66 | P8T-E | Human | Esophagus | ESCC | 2.98e-15 | 3.96e-01 | 0.0889 |
| 144406 | WDR66 | P9T-E | Human | Esophagus | ESCC | 5.21e-07 | 2.73e-01 | 0.1131 |
| 144406 | WDR66 | P10T-E | Human | Esophagus | ESCC | 2.86e-26 | 6.22e-01 | 0.116 |
| 144406 | WDR66 | P11T-E | Human | Esophagus | ESCC | 9.99e-11 | 6.98e-01 | 0.1426 |
| 144406 | WDR66 | P12T-E | Human | Esophagus | ESCC | 8.09e-18 | 2.20e-01 | 0.1122 |
| 144406 | WDR66 | P15T-E | Human | Esophagus | ESCC | 1.32e-33 | 9.22e-01 | 0.1149 |
| 144406 | WDR66 | P17T-E | Human | Esophagus | ESCC | 1.90e-08 | 5.86e-01 | 0.1278 |
| Page: 1 2 3 4 5 |
| Tissue | Expression Dynamics | Abbreviation |
| Cervix |  | CC: Cervix cancer |
| HSIL_HPV: HPV-infected high-grade squamous intraepithelial lesions | ||
| N_HPV: HPV-infected normal cervix | ||
| Esophagus | 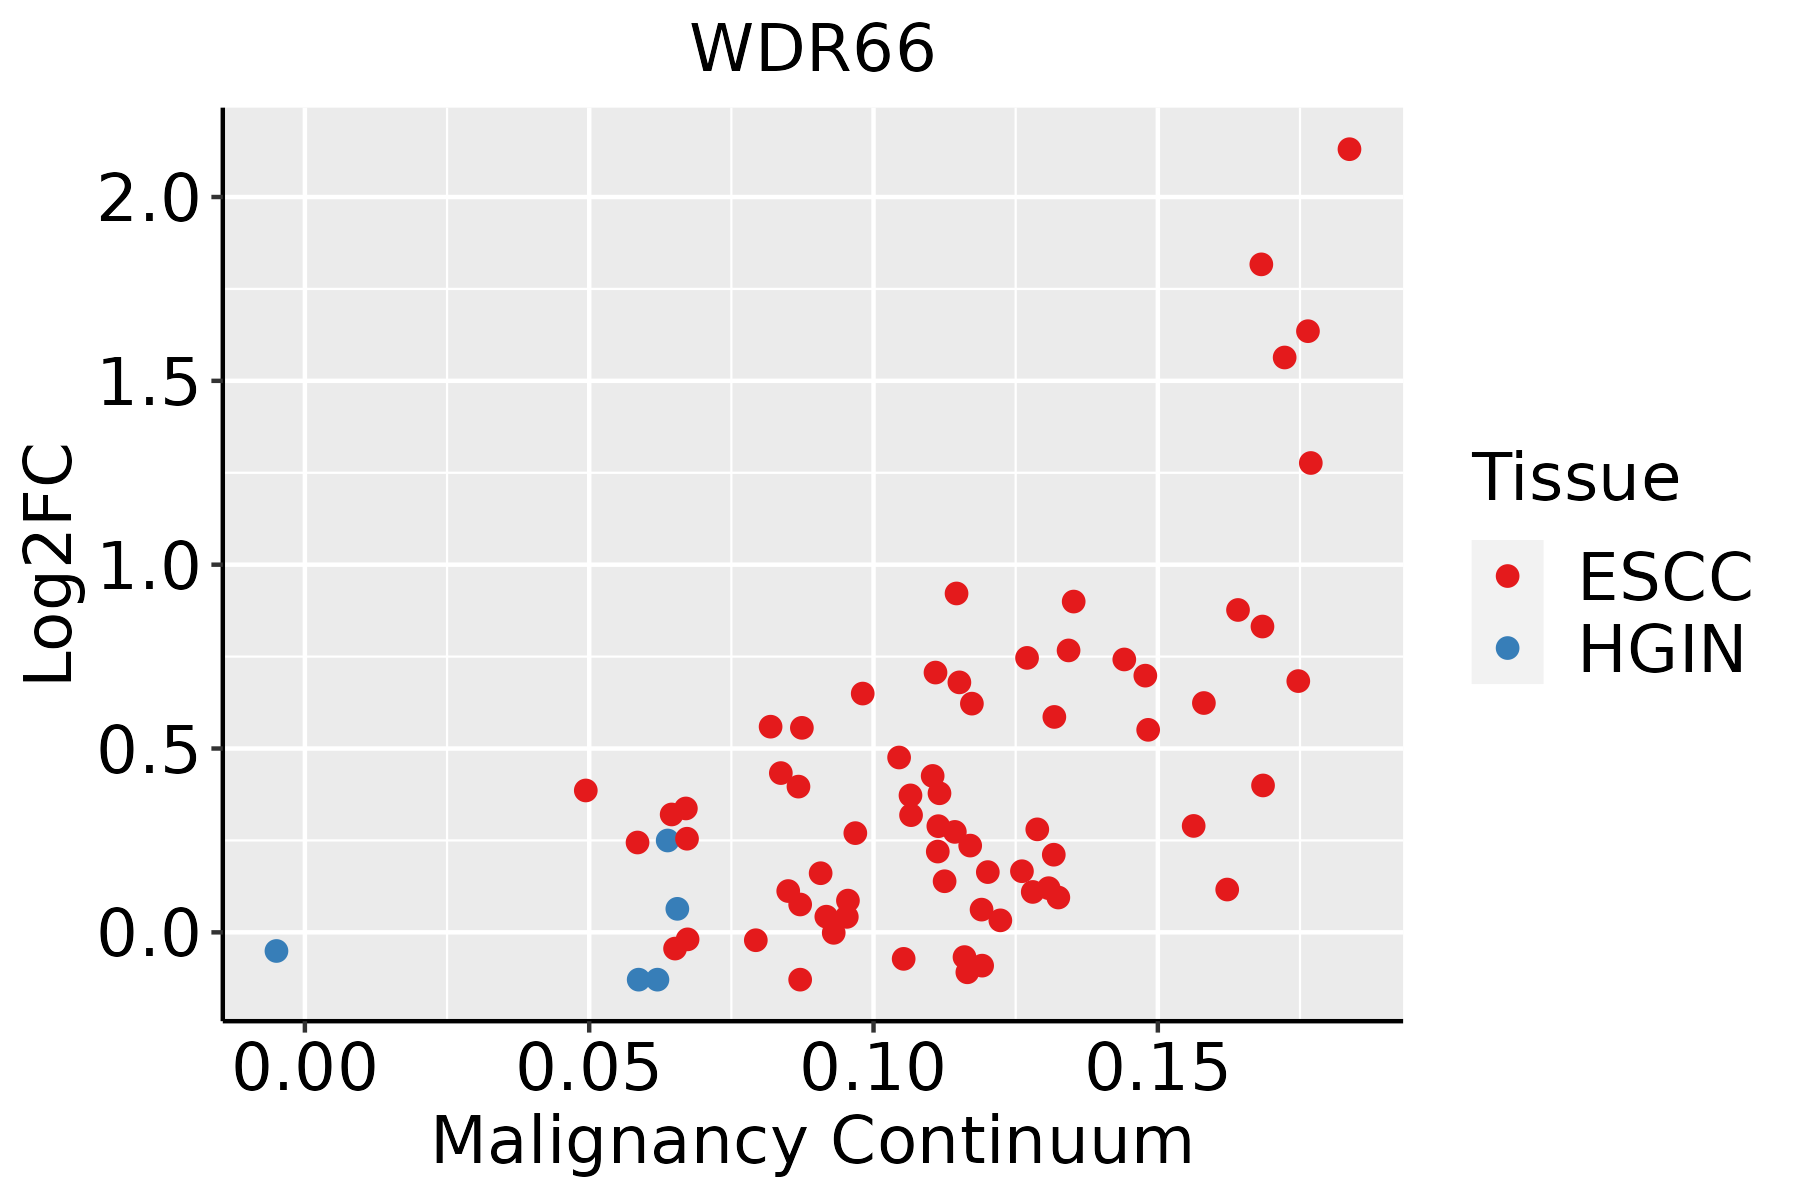 | ESCC: Esophageal squamous cell carcinoma |
| HGIN: High-grade intraepithelial neoplasias | ||
| LGIN: Low-grade intraepithelial neoplasias | ||
| Oral Cavity | 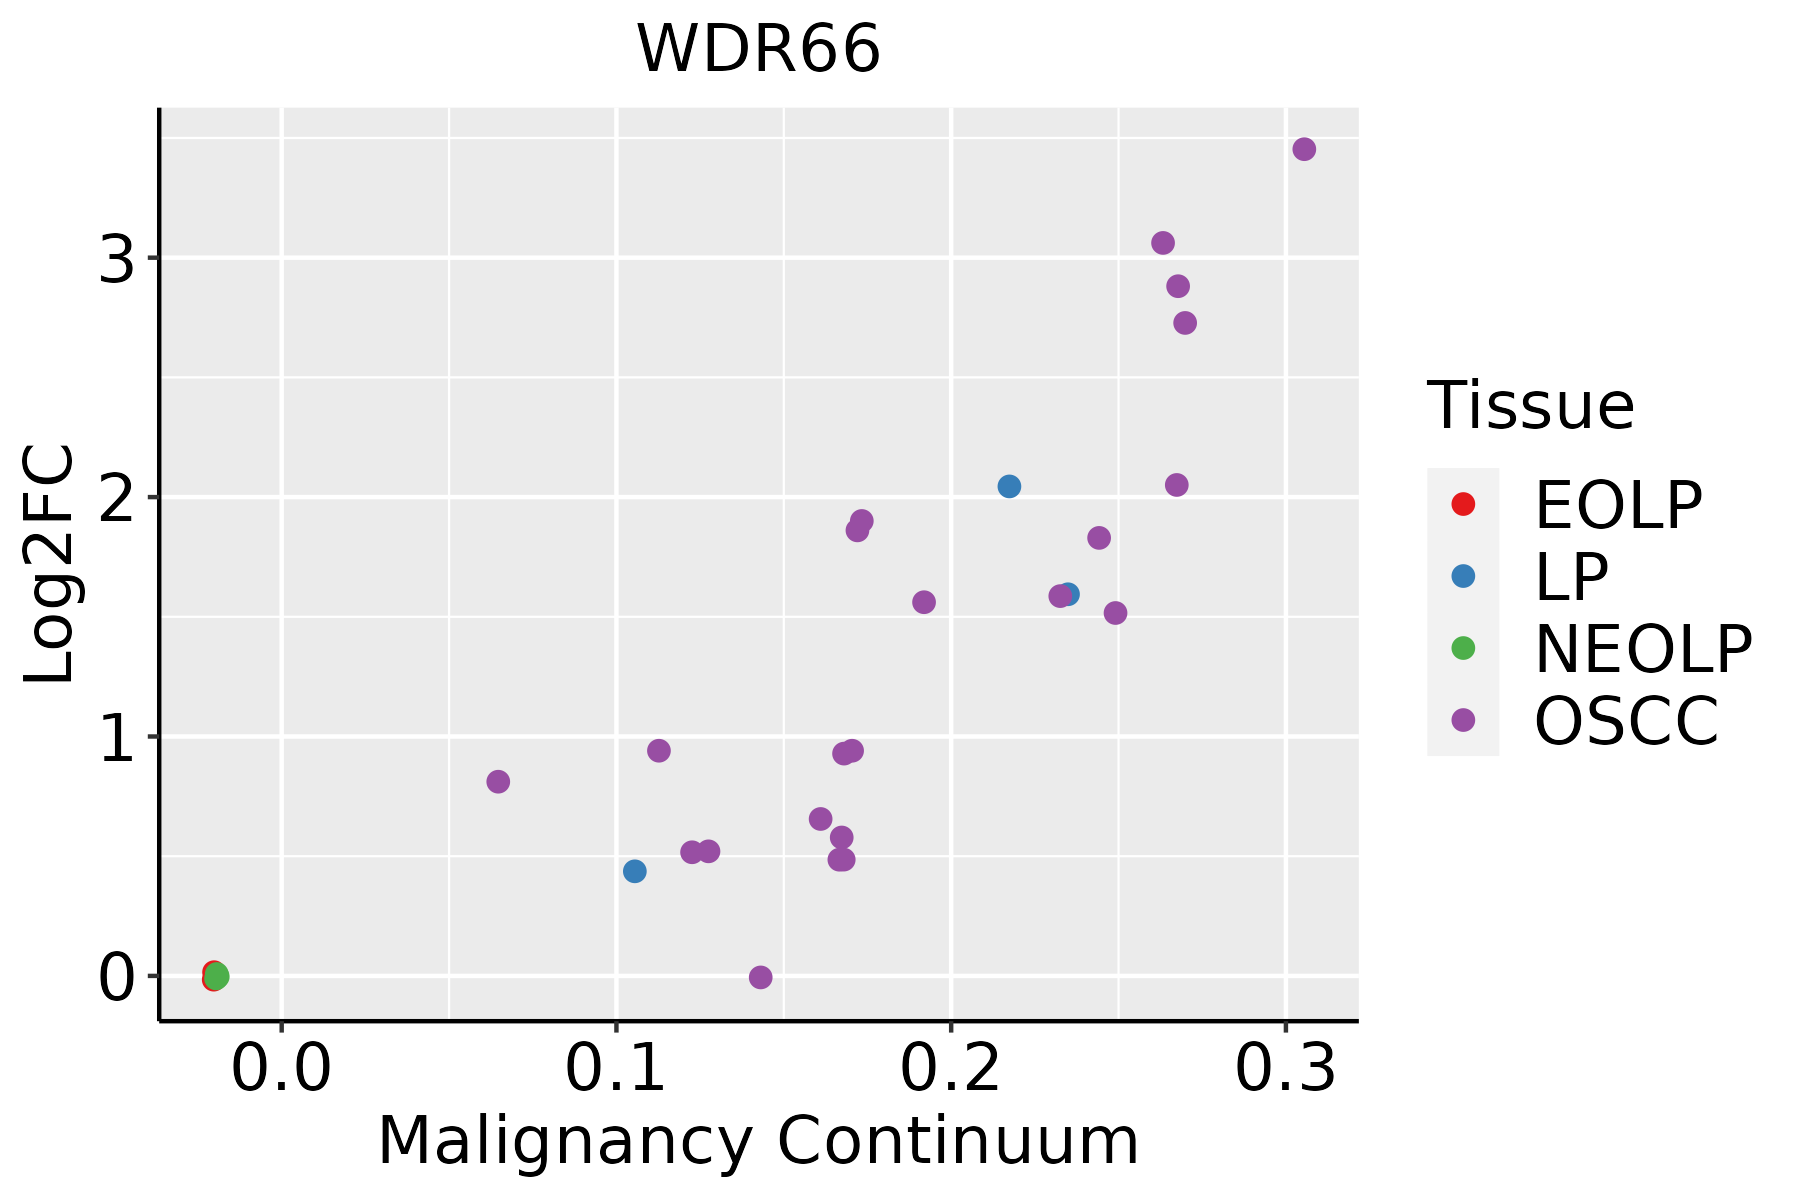 | EOLP: Erosive Oral lichen planus |
| LP: leukoplakia | ||
| NEOLP: Non-erosive oral lichen planus | ||
| OSCC: Oral squamous cell carcinoma | ||
| Skin | 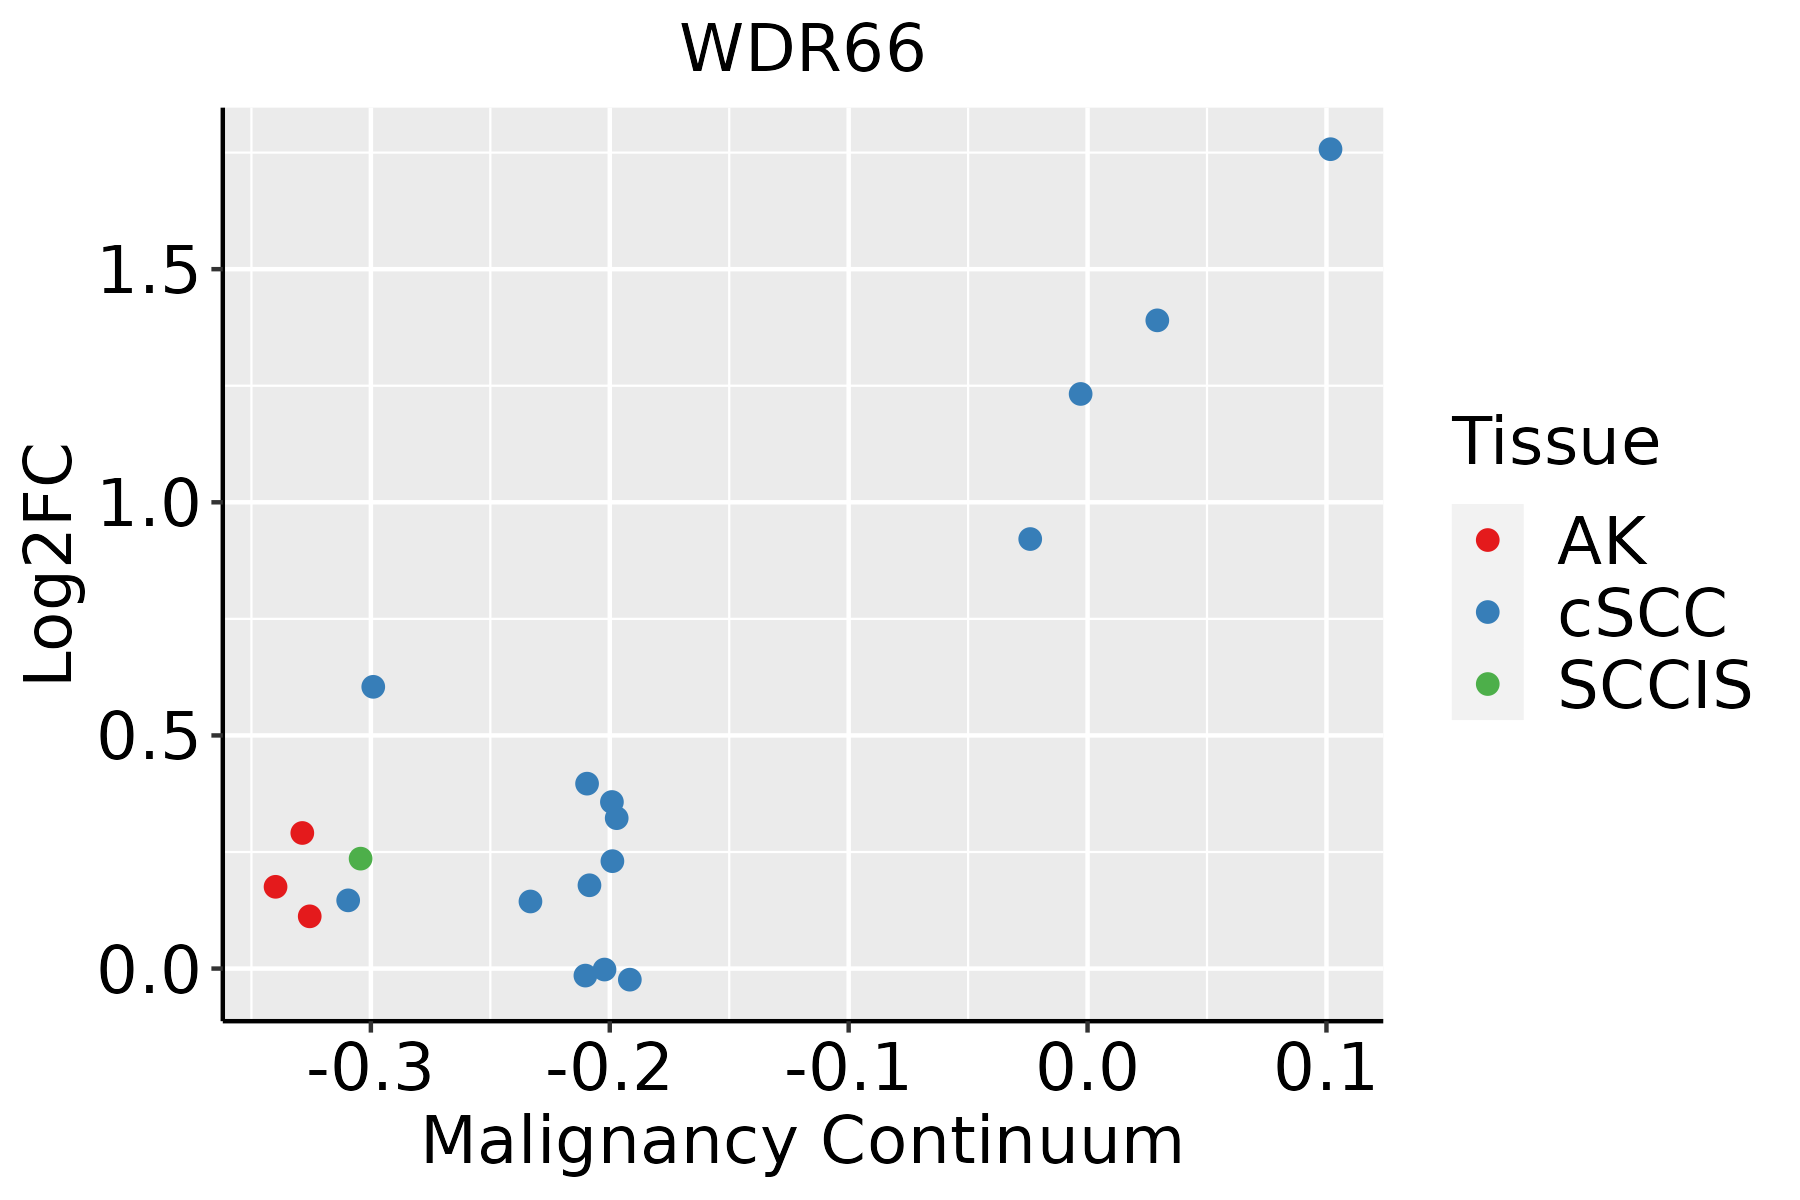 | AK: Actinic keratosis |
| cSCC: Cutaneous squamous cell carcinoma | ||
| SCCIS:squamous cell carcinoma in situ |
| ∗log2FC in expression of this searched gene in stem-like cells from each diseased tissue sample relative to stem-like cells in normal samples in each tissue plotted against the malignancy continuum. Samples are colored based on if they are from different disease stage. |
Top |
Malignant transformation related pathway analysis |
| Find out the enriched GO biological processes and KEGG pathways involved in transition from healthy to precancer to cancer |
| Tissue | Disease Stage | Enriched GO biological Processes |
| Colorectum | AD |  |
| Colorectum | SER |  |
| Colorectum | MSS |  |
| Colorectum | MSI-H |  |
| Colorectum | FAP |  |
| ∗Top 15 enriched GO BP terms are showed in the bar plot of each disease state in each tissue. Each row represents a significant GO biological process which is colored according to the -log10(p.adjust). |
| Page: 1 2 3 4 5 6 7 8 9 |
| GO ID | Tissue | Disease Stage | Description | Gene Ratio | Bg Ratio | pvalue | p.adjust | Count |
| Page: 1 |
| Pathway ID | Tissue | Disease Stage | Description | Gene Ratio | Bg Ratio | pvalue | p.adjust | qvalue | Count |
| Page: 1 |
Top |
Cell-cell communication analysis |
| Identification of potential cell-cell interactions between two cell types and their ligand-receptor pairs for different disease states |
| Ligand | Receptor | LRpair | Pathway | Tissue | Disease Stage |
| Page: 1 |
Top |
Single-cell gene regulatory network inference analysis |
| Find out the significant the regulons (TFs) and the target genes of each regulon across cell types for different disease states |
| TF | Cell Type | Tissue | Disease Stage | Target Gene | RSS | Regulon Activity |
| ∗The dot plots of a searched regulon are shown for all cell subpopulations in each disease state of each tissue based on the regulon specific score inferred using pySCENIC and by calculating the average expression. |
| Page: 1 |
Top |
Somatic mutation of malignant transformation related genes |
| Annotation of somatic variants for genes involved in malignant transformation |
| Hugo Symbol | Variant Class | Variant Classification | dbSNP RS | HGVSc | HGVSp | HGVSp Short | SWISSPROT | BIOTYPE | SIFT | PolyPhen | Tumor Sample Barcode | Tissue | Histology | Sex | Age | Stage | Therapy Types | Drugs | Outcome |
| WDR66 | SNV | Missense_Mutation | c.2888N>T | p.Ser963Phe | p.S963F | Q8TBY9 | protein_coding | deleterious(0.05) | benign(0.091) | TCGA-A2-A0EY-01 | Breast | breast invasive carcinoma | Female | <65 | I/II | Chemotherapy | adriamycin | SD | |
| WDR66 | SNV | Missense_Mutation | c.2579G>A | p.Arg860His | p.R860H | Q8TBY9 | protein_coding | tolerated(0.14) | benign(0.006) | TCGA-A8-A06X-01 | Breast | breast invasive carcinoma | Female | >=65 | I/II | Unknown | Unknown | SD | |
| WDR66 | SNV | Missense_Mutation | novel | c.730N>G | p.Thr244Ala | p.T244A | Q8TBY9 | protein_coding | tolerated(1) | benign(0) | TCGA-AR-A0TV-01 | Breast | breast invasive carcinoma | Female | >=65 | I/II | Unknown | Unknown | SD |
| WDR66 | SNV | Missense_Mutation | c.2911N>C | p.Asp971His | p.D971H | Q8TBY9 | protein_coding | deleterious(0.02) | benign(0.424) | TCGA-AR-A255-01 | Breast | breast invasive carcinoma | Female | <65 | I/II | Targeted Molecular therapy | trastuzumab | SD | |
| WDR66 | SNV | Missense_Mutation | novel | c.1575N>G | p.Phe525Leu | p.F525L | Q8TBY9 | protein_coding | deleterious(0.01) | benign(0.309) | TCGA-BH-A2L8-01 | Breast | breast invasive carcinoma | Female | <65 | I/II | Chemotherapy | cytoxan | CR |
| WDR66 | SNV | Missense_Mutation | c.2344N>A | p.Leu782Met | p.L782M | Q8TBY9 | protein_coding | deleterious(0) | probably_damaging(0.997) | TCGA-D8-A1XK-01 | Breast | breast invasive carcinoma | Female | <65 | I/II | Chemotherapy | doxorubicine+cyclophosphamide | SD | |
| WDR66 | SNV | Missense_Mutation | c.3001N>A | p.Glu1001Lys | p.E1001K | Q8TBY9 | protein_coding | tolerated(0.07) | benign(0.01) | TCGA-D8-A1Y1-01 | Breast | breast invasive carcinoma | Female | >=65 | III/IV | Hormone Therapy | tamoxiphen | PD | |
| WDR66 | SNV | Missense_Mutation | rs745790305 | c.3230N>T | p.Thr1077Ile | p.T1077I | Q8TBY9 | protein_coding | deleterious(0.03) | benign(0.127) | TCGA-GI-A2C9-01 | Breast | breast invasive carcinoma | Female | <65 | I/II | Unspecific | SD | |
| WDR66 | SNV | Missense_Mutation | c.1649N>T | p.Ser550Leu | p.S550L | Q8TBY9 | protein_coding | deleterious(0.02) | benign(0.007) | TCGA-GM-A2D9-01 | Breast | breast invasive carcinoma | Female | >=65 | I/II | Hormone Therapy | arimidex | SD | |
| WDR66 | SNV | Missense_Mutation | novel | c.1052N>T | p.Ala351Val | p.A351V | Q8TBY9 | protein_coding | deleterious(0.02) | possibly_damaging(0.703) | TCGA-2W-A8YY-01 | Cervix | cervical & endocervical cancer | Female | <65 | I/II | Chemotherapy | cisplatin | CR |
| Page: 1 2 3 4 5 6 7 8 9 10 11 12 13 14 15 |
Top |
Related drugs of malignant transformation related genes |
| Identification of chemicals and drugs interact with genes involved in malignant transfromation |
| (DGIdb 4.0) |
| Entrez ID | Symbol | Category | Interaction Types | Drug Claim Name | Drug Name | PMIDs |
| Page: 1 |

Copyright 2023-Present -The University of Texas Health Science Center at Houston |