
|
|||||
|
 | |
| |
| |
| |
| |
| |
|
Gene: WDR61 |
Gene summary for WDR61 |
| Gene information | Species | Human | Gene symbol | WDR61 | Gene ID | 80349 |
| Gene name | WD repeat domain 61 | |
| Gene Alias | REC14 | |
| Cytomap | 15q25.1 | |
| Gene Type | protein-coding | GO ID | GO:0002376 | UniProtAcc | Q9GZS3 |
Top |
Malignant transformation analysis |
| Identification of the aberrant gene expression in precancerous and cancerous lesions by comparing the gene expression of stem-like cells in diseased tissues with normal stem cells |
| Entrez ID | Symbol | Replicates | Species | Organ | Tissue | Adj P-value | Log2FC | Malignancy |
| 80349 | WDR61 | LZE2T | Human | Esophagus | ESCC | 1.93e-04 | 6.57e-01 | 0.082 |
| 80349 | WDR61 | LZE4T | Human | Esophagus | ESCC | 1.50e-18 | 6.44e-01 | 0.0811 |
| 80349 | WDR61 | LZE7T | Human | Esophagus | ESCC | 5.04e-09 | 6.29e-01 | 0.0667 |
| 80349 | WDR61 | LZE8T | Human | Esophagus | ESCC | 4.73e-08 | 3.51e-01 | 0.067 |
| 80349 | WDR61 | LZE20T | Human | Esophagus | ESCC | 5.43e-05 | 2.02e-01 | 0.0662 |
| 80349 | WDR61 | LZE22T | Human | Esophagus | ESCC | 1.34e-03 | 3.70e-01 | 0.068 |
| 80349 | WDR61 | LZE24D1 | Human | Esophagus | HGIN | 3.33e-02 | 5.58e-01 | 0.054 |
| 80349 | WDR61 | LZE24T | Human | Esophagus | ESCC | 2.87e-11 | 3.12e-01 | 0.0596 |
| 80349 | WDR61 | LZE21T | Human | Esophagus | ESCC | 8.69e-05 | 4.08e-01 | 0.0655 |
| 80349 | WDR61 | LZE6T | Human | Esophagus | ESCC | 1.58e-08 | 5.07e-01 | 0.0845 |
| 80349 | WDR61 | P1T-E | Human | Esophagus | ESCC | 4.62e-11 | 7.06e-01 | 0.0875 |
| 80349 | WDR61 | P2T-E | Human | Esophagus | ESCC | 3.51e-35 | 5.74e-01 | 0.1177 |
| 80349 | WDR61 | P4T-E | Human | Esophagus | ESCC | 4.25e-41 | 1.02e+00 | 0.1323 |
| 80349 | WDR61 | P5T-E | Human | Esophagus | ESCC | 6.18e-17 | 4.20e-01 | 0.1327 |
| 80349 | WDR61 | P8T-E | Human | Esophagus | ESCC | 7.01e-44 | 7.77e-01 | 0.0889 |
| 80349 | WDR61 | P9T-E | Human | Esophagus | ESCC | 1.05e-28 | 7.18e-01 | 0.1131 |
| 80349 | WDR61 | P10T-E | Human | Esophagus | ESCC | 3.85e-55 | 1.01e+00 | 0.116 |
| 80349 | WDR61 | P11T-E | Human | Esophagus | ESCC | 2.43e-16 | 5.64e-01 | 0.1426 |
| 80349 | WDR61 | P12T-E | Human | Esophagus | ESCC | 3.68e-62 | 1.02e+00 | 0.1122 |
| 80349 | WDR61 | P15T-E | Human | Esophagus | ESCC | 8.57e-61 | 1.30e+00 | 0.1149 |
| Page: 1 2 3 4 5 6 7 |
| Tissue | Expression Dynamics | Abbreviation |
| Esophagus | 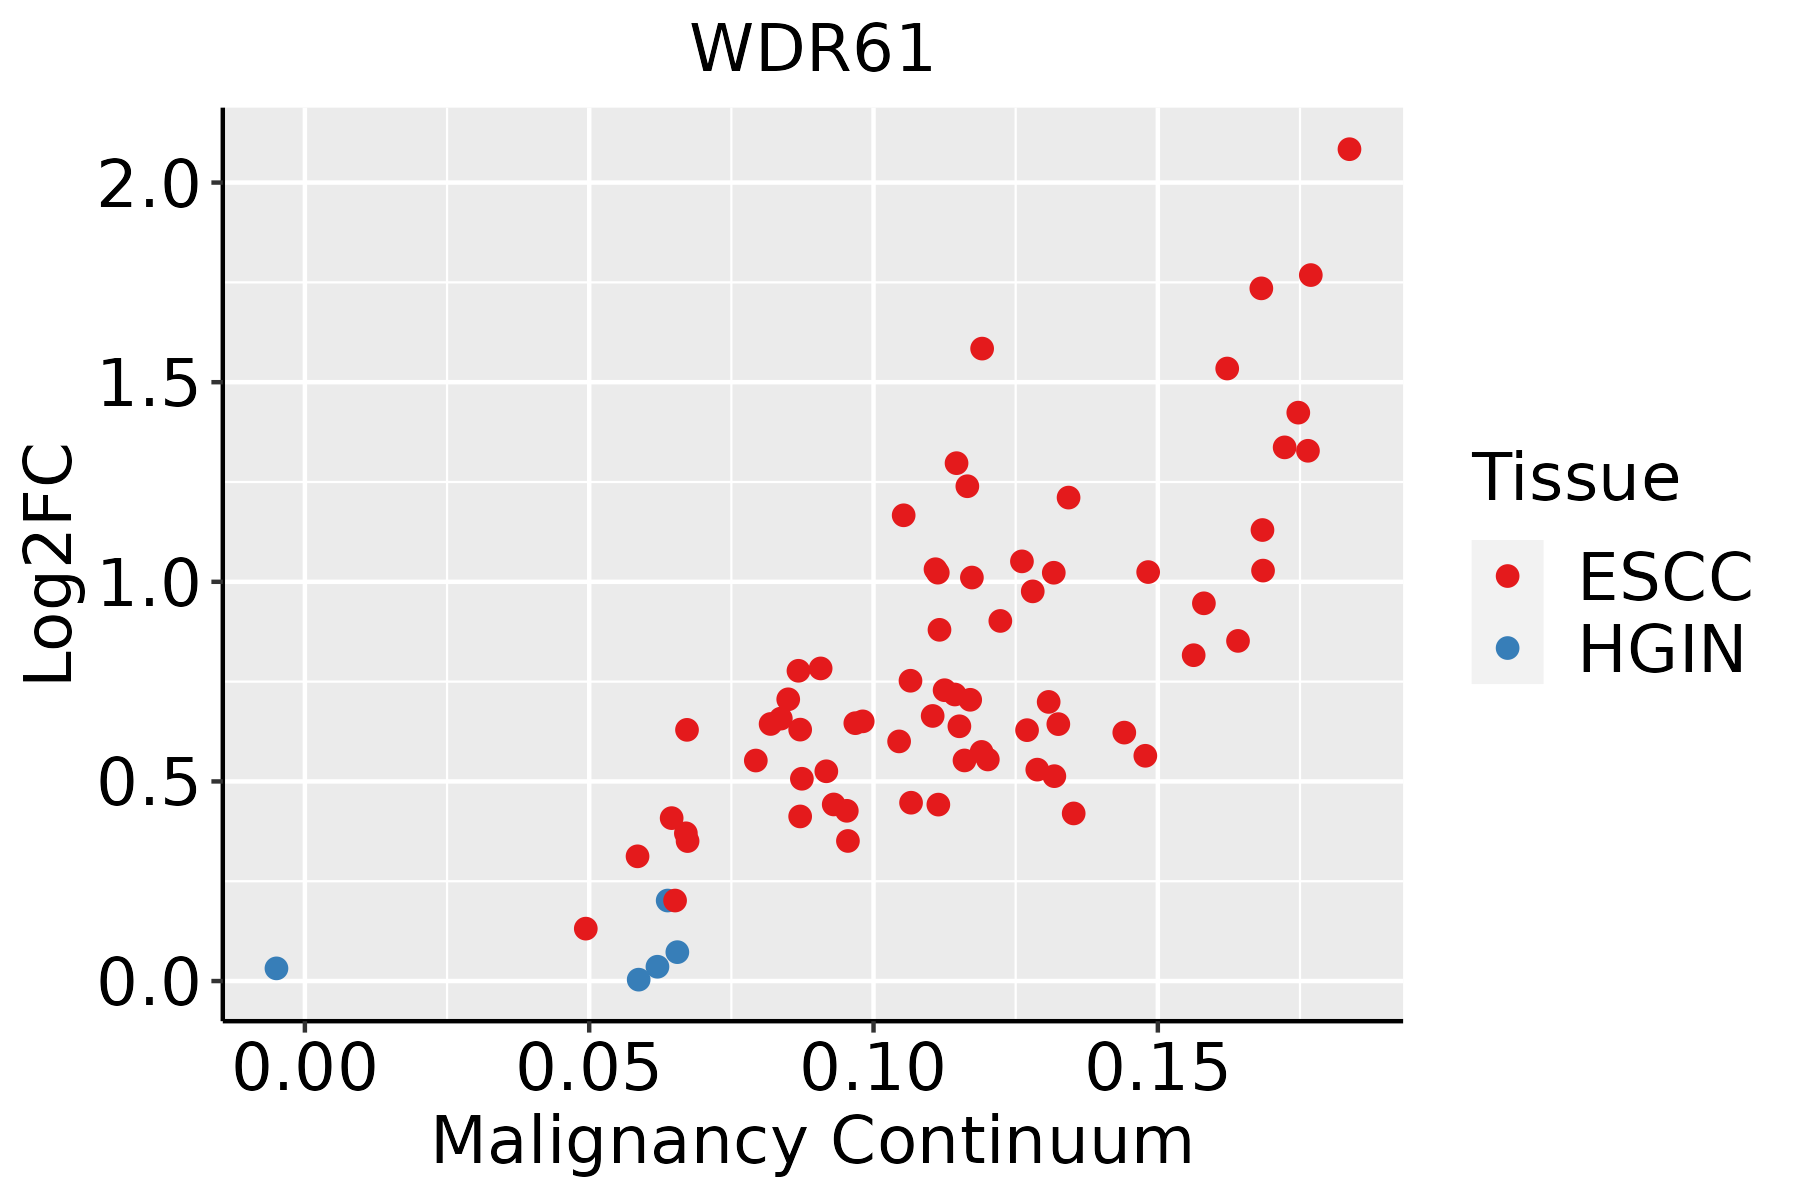 | ESCC: Esophageal squamous cell carcinoma |
| HGIN: High-grade intraepithelial neoplasias | ||
| LGIN: Low-grade intraepithelial neoplasias | ||
| Liver | 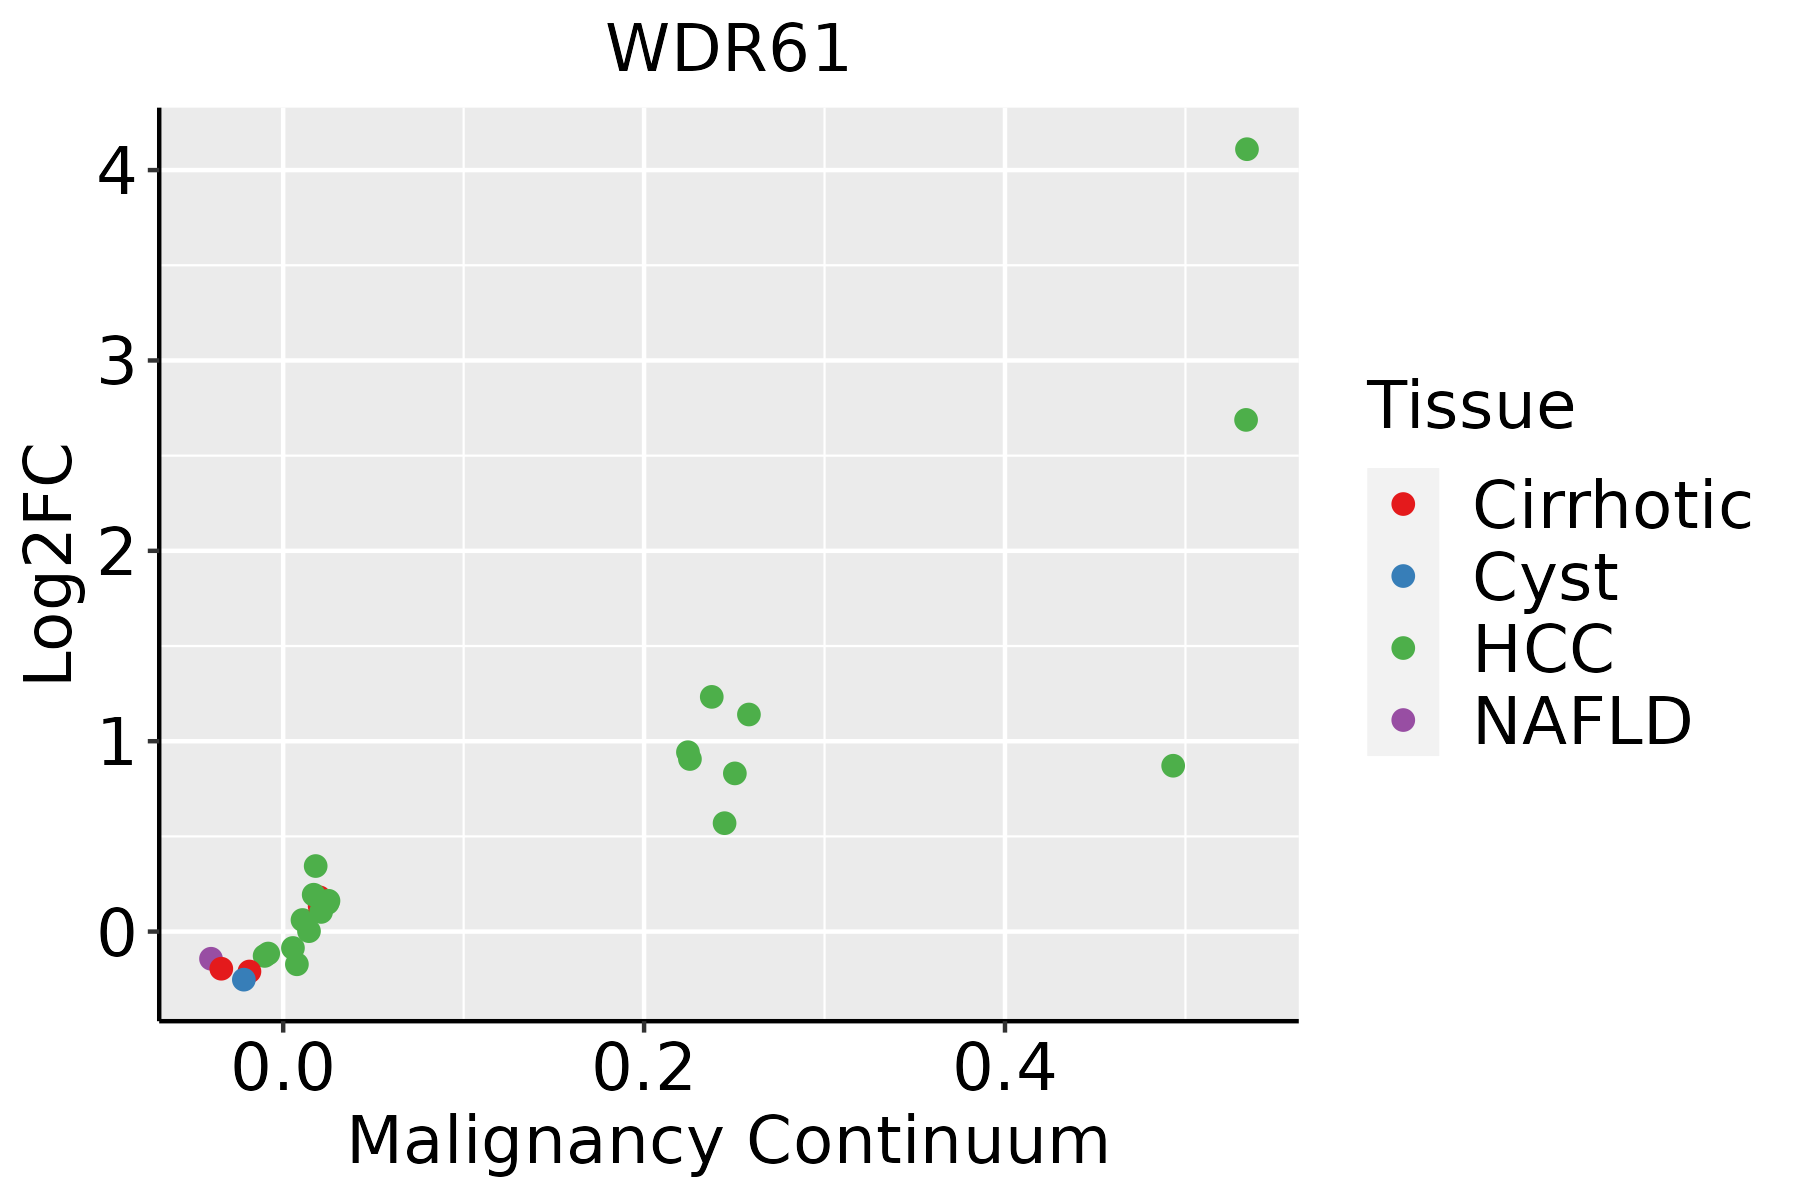 | HCC: Hepatocellular carcinoma |
| NAFLD: Non-alcoholic fatty liver disease | ||
| Oral Cavity |  | EOLP: Erosive Oral lichen planus |
| LP: leukoplakia | ||
| NEOLP: Non-erosive oral lichen planus | ||
| OSCC: Oral squamous cell carcinoma | ||
| Prostate | 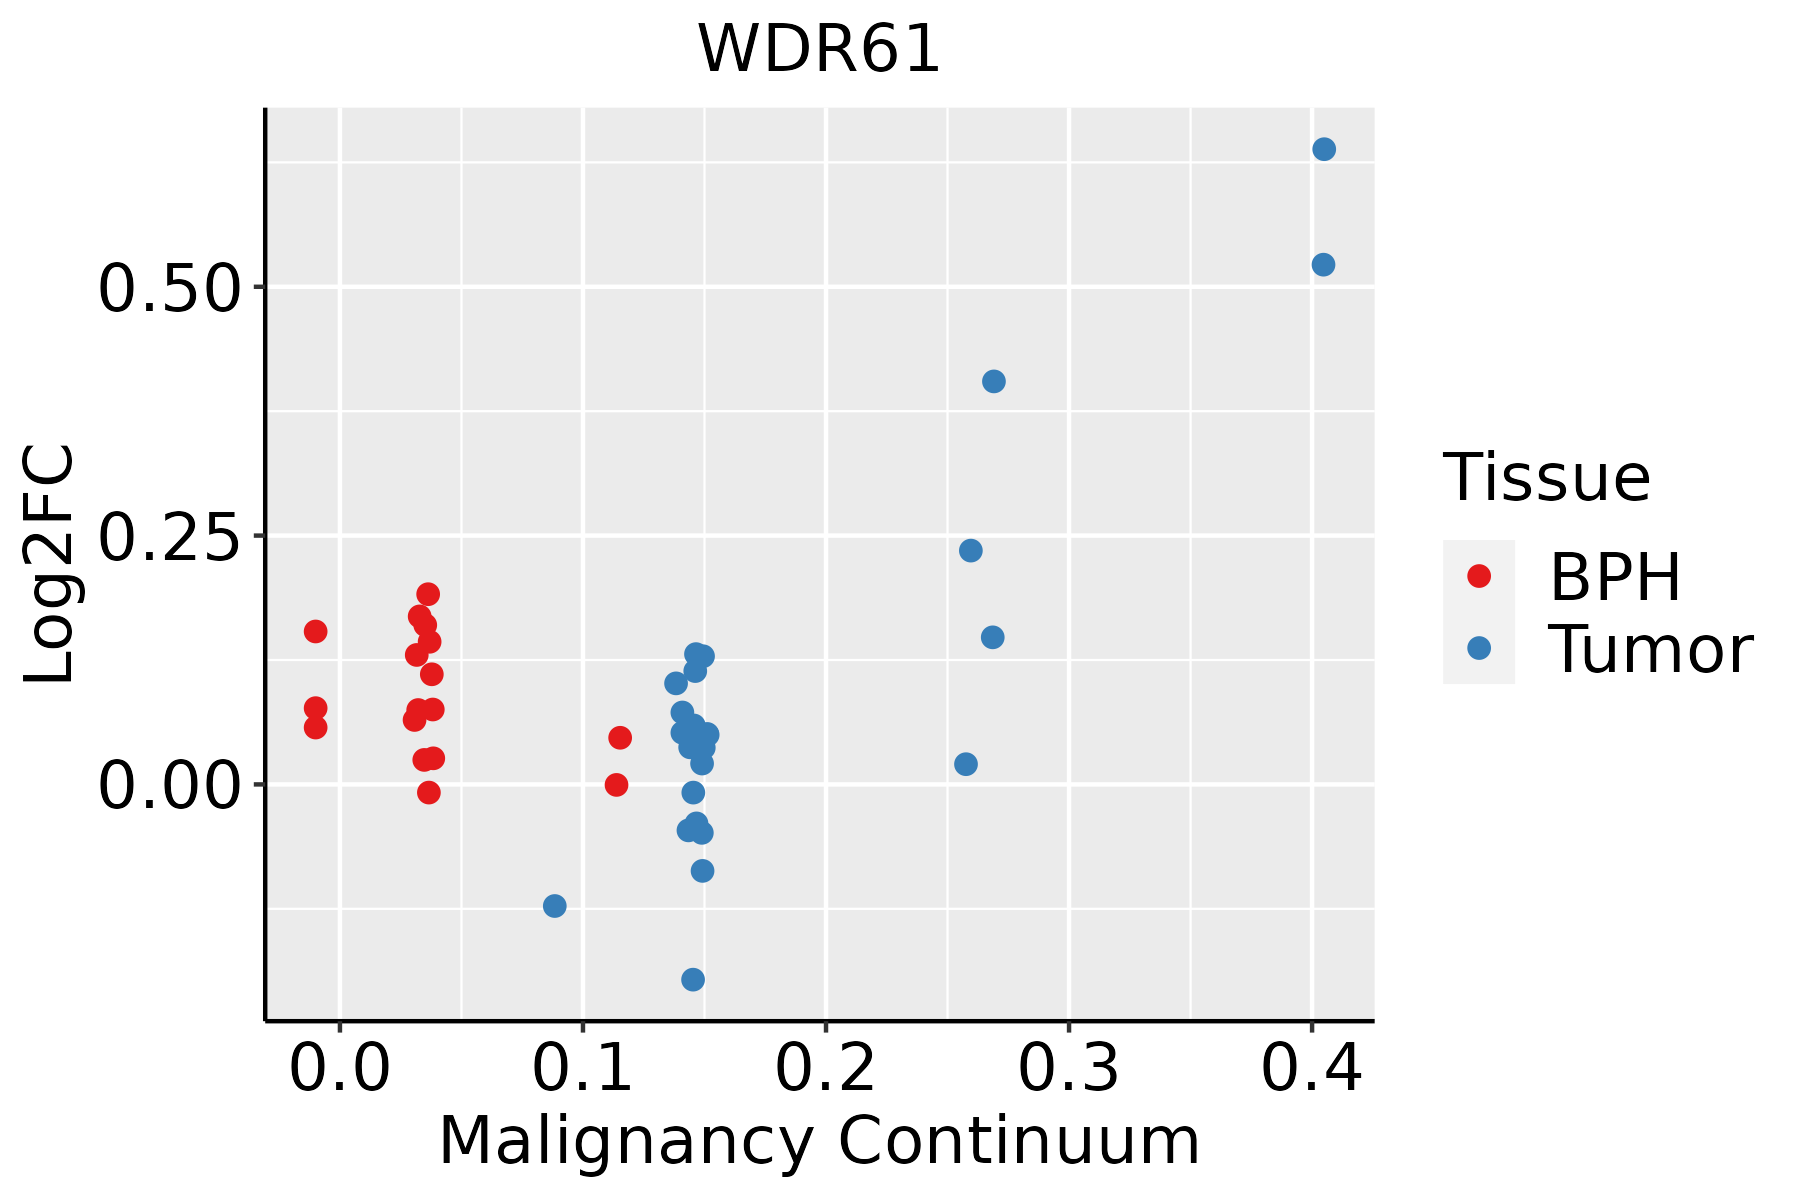 | BPH: Benign Prostatic Hyperplasia |
| Skin | 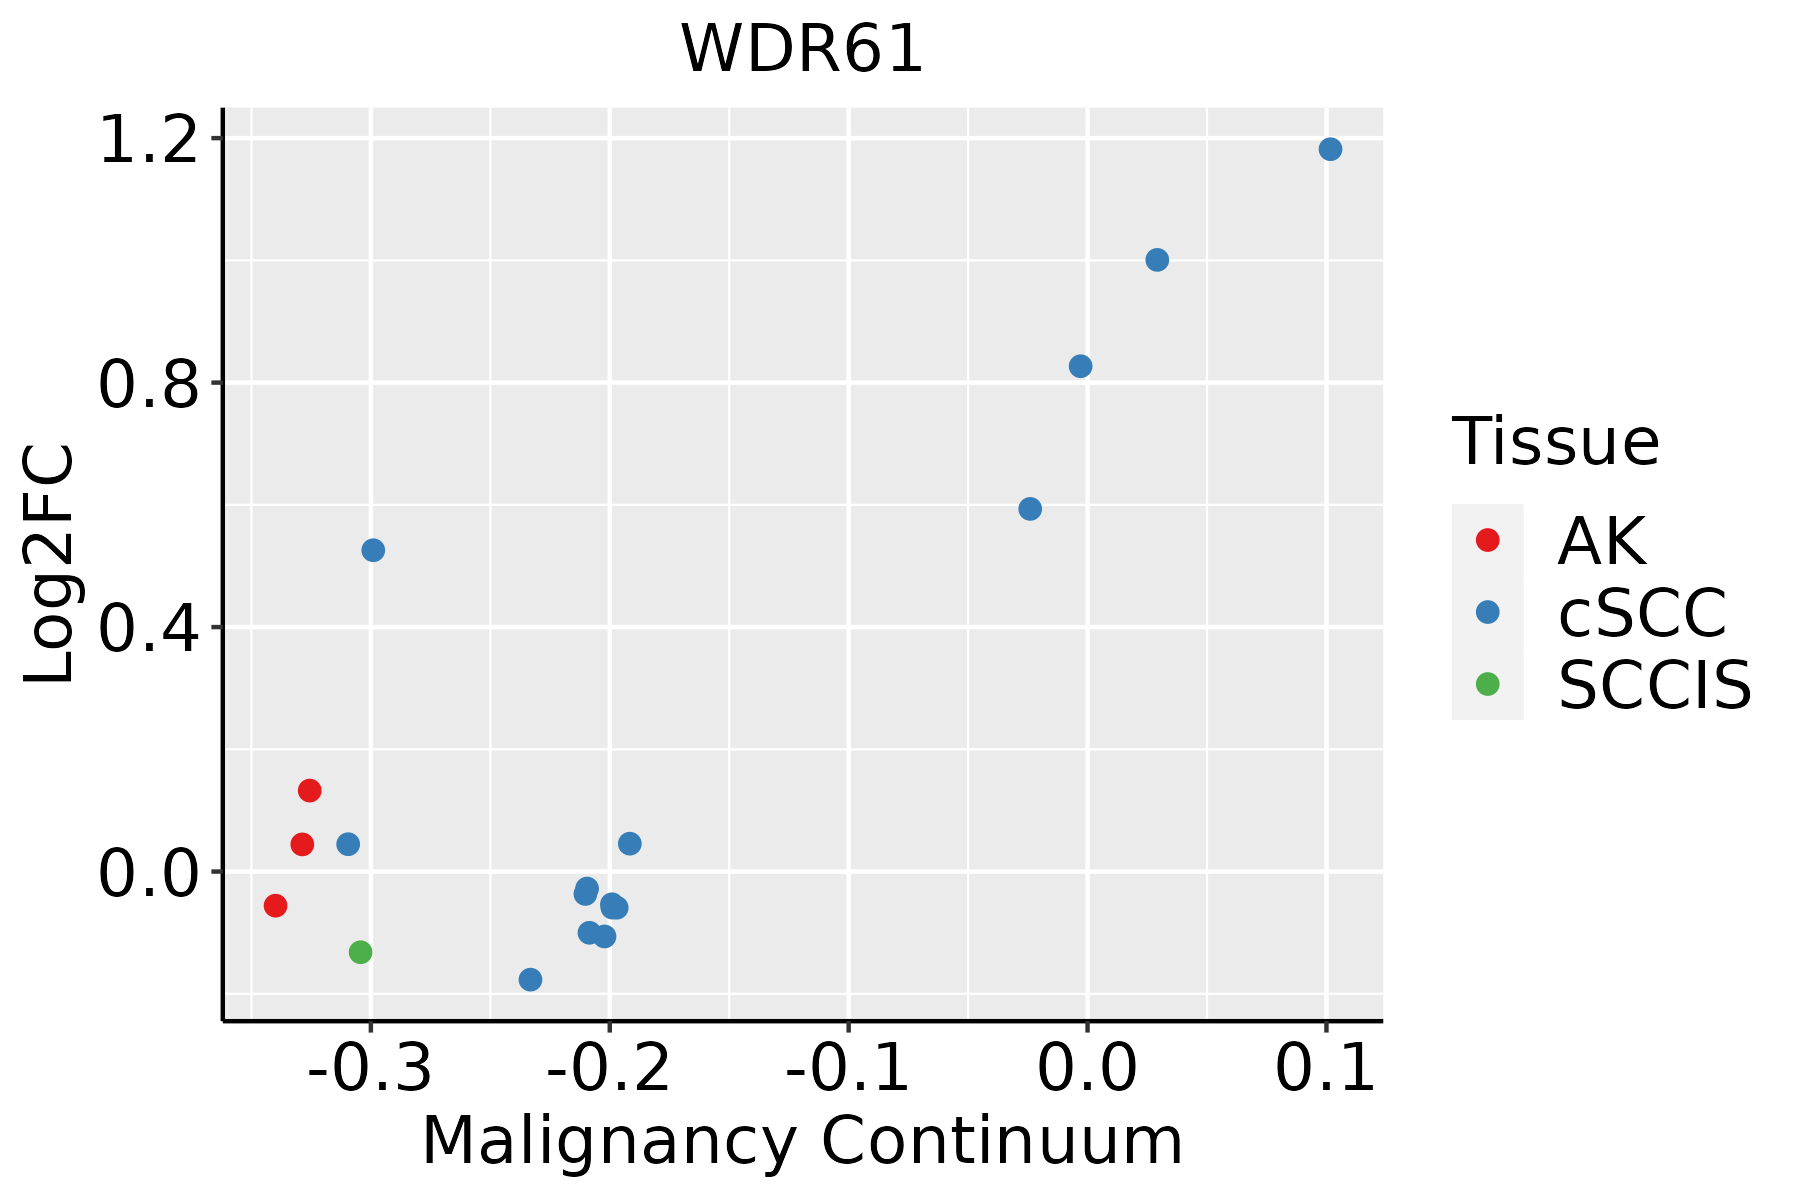 | AK: Actinic keratosis |
| cSCC: Cutaneous squamous cell carcinoma | ||
| SCCIS:squamous cell carcinoma in situ | ||
| Thyroid |  | ATC: Anaplastic thyroid cancer |
| HT: Hashimoto's thyroiditis | ||
| PTC: Papillary thyroid cancer |
| ∗log2FC in expression of this searched gene in stem-like cells from each diseased tissue sample relative to stem-like cells in normal samples in each tissue plotted against the malignancy continuum. Samples are colored based on if they are from different disease stage. |
Top |
Malignant transformation related pathway analysis |
| Find out the enriched GO biological processes and KEGG pathways involved in transition from healthy to precancer to cancer |
| Tissue | Disease Stage | Enriched GO biological Processes |
| Colorectum | AD |  |
| Colorectum | SER |  |
| Colorectum | MSS |  |
| Colorectum | MSI-H |  |
| Colorectum | FAP |  |
| ∗Top 15 enriched GO BP terms are showed in the bar plot of each disease state in each tissue. Each row represents a significant GO biological process which is colored according to the -log10(p.adjust). |
| Page: 1 2 3 4 5 6 7 8 9 |
| GO ID | Tissue | Disease Stage | Description | Gene Ratio | Bg Ratio | pvalue | p.adjust | Count |
| GO:001657015 | Esophagus | ESCC | histone modification | 323/8552 | 463/18723 | 2.61e-26 | 7.88e-24 | 323 |
| GO:001820514 | Esophagus | ESCC | peptidyl-lysine modification | 259/8552 | 376/18723 | 3.90e-20 | 5.26e-18 | 259 |
| GO:000635414 | Esophagus | ESCC | DNA-templated transcription, elongation | 76/8552 | 91/18723 | 8.35e-14 | 4.11e-12 | 76 |
| GO:001605517 | Esophagus | ESCC | Wnt signaling pathway | 268/8552 | 444/18723 | 2.32e-10 | 6.58e-09 | 268 |
| GO:019873817 | Esophagus | ESCC | cell-cell signaling by wnt | 269/8552 | 446/18723 | 2.41e-10 | 6.79e-09 | 269 |
| GO:00434143 | Esophagus | ESCC | macromolecule methylation | 199/8552 | 316/18723 | 3.44e-10 | 9.57e-09 | 199 |
| GO:0030099111 | Esophagus | ESCC | myeloid cell differentiation | 232/8552 | 381/18723 | 1.22e-09 | 2.90e-08 | 232 |
| GO:000636814 | Esophagus | ESCC | transcription elongation from RNA polymerase II promoter | 56/8552 | 69/18723 | 1.40e-09 | 3.30e-08 | 56 |
| GO:003105614 | Esophagus | ESCC | regulation of histone modification | 106/8552 | 152/18723 | 1.52e-09 | 3.55e-08 | 106 |
| GO:00322592 | Esophagus | ESCC | methylation | 222/8552 | 364/18723 | 2.26e-09 | 5.09e-08 | 222 |
| GO:000647914 | Esophagus | ESCC | protein methylation | 115/8552 | 181/18723 | 9.07e-07 | 1.16e-05 | 115 |
| GO:000821314 | Esophagus | ESCC | protein alkylation | 115/8552 | 181/18723 | 9.07e-07 | 1.16e-05 | 115 |
| GO:00310583 | Esophagus | ESCC | positive regulation of histone modification | 65/8552 | 92/18723 | 1.04e-06 | 1.31e-05 | 65 |
| GO:00165718 | Esophagus | ESCC | histone methylation | 89/8552 | 141/18723 | 2.17e-05 | 1.87e-04 | 89 |
| GO:003496814 | Esophagus | ESCC | histone lysine methylation | 72/8552 | 115/18723 | 1.85e-04 | 1.18e-03 | 72 |
| GO:1903706110 | Esophagus | ESCC | regulation of hemopoiesis | 201/8552 | 367/18723 | 2.60e-04 | 1.58e-03 | 201 |
| GO:003106013 | Esophagus | ESCC | regulation of histone methylation | 46/8552 | 69/18723 | 3.46e-04 | 2.03e-03 | 46 |
| GO:001802214 | Esophagus | ESCC | peptidyl-lysine methylation | 79/8552 | 131/18723 | 5.17e-04 | 2.86e-03 | 79 |
| GO:0045637111 | Esophagus | ESCC | regulation of myeloid cell differentiation | 118/8552 | 210/18723 | 1.35e-03 | 6.43e-03 | 118 |
| GO:003106211 | Esophagus | ESCC | positive regulation of histone methylation | 28/8552 | 41/18723 | 2.88e-03 | 1.21e-02 | 28 |
| Page: 1 2 3 4 5 6 7 8 9 10 11 |
| Pathway ID | Tissue | Disease Stage | Description | Gene Ratio | Bg Ratio | pvalue | p.adjust | qvalue | Count |
| hsa0301824 | Esophagus | ESCC | RNA degradation | 62/4205 | 79/8465 | 1.18e-07 | 9.39e-07 | 4.81e-07 | 62 |
| hsa0301834 | Esophagus | ESCC | RNA degradation | 62/4205 | 79/8465 | 1.18e-07 | 9.39e-07 | 4.81e-07 | 62 |
| hsa03018 | Liver | Cirrhotic | RNA degradation | 44/2530 | 79/8465 | 1.43e-06 | 1.65e-05 | 1.02e-05 | 44 |
| hsa030181 | Liver | Cirrhotic | RNA degradation | 44/2530 | 79/8465 | 1.43e-06 | 1.65e-05 | 1.02e-05 | 44 |
| hsa030182 | Liver | HCC | RNA degradation | 58/4020 | 79/8465 | 2.29e-06 | 2.19e-05 | 1.22e-05 | 58 |
| hsa030183 | Liver | HCC | RNA degradation | 58/4020 | 79/8465 | 2.29e-06 | 2.19e-05 | 1.22e-05 | 58 |
| hsa030189 | Oral cavity | OSCC | RNA degradation | 59/3704 | 79/8465 | 2.05e-08 | 1.91e-07 | 9.70e-08 | 59 |
| hsa0301814 | Oral cavity | OSCC | RNA degradation | 59/3704 | 79/8465 | 2.05e-08 | 1.91e-07 | 9.70e-08 | 59 |
| hsa0301823 | Oral cavity | LP | RNA degradation | 39/2418 | 79/8465 | 6.98e-05 | 4.38e-04 | 2.83e-04 | 39 |
| hsa0301833 | Oral cavity | LP | RNA degradation | 39/2418 | 79/8465 | 6.98e-05 | 4.38e-04 | 2.83e-04 | 39 |
| hsa030188 | Prostate | BPH | RNA degradation | 29/1718 | 79/8465 | 5.17e-04 | 2.67e-03 | 1.65e-03 | 29 |
| hsa0301813 | Prostate | BPH | RNA degradation | 29/1718 | 79/8465 | 5.17e-04 | 2.67e-03 | 1.65e-03 | 29 |
| hsa0301822 | Prostate | Tumor | RNA degradation | 30/1791 | 79/8465 | 4.48e-04 | 2.35e-03 | 1.46e-03 | 30 |
| hsa0301832 | Prostate | Tumor | RNA degradation | 30/1791 | 79/8465 | 4.48e-04 | 2.35e-03 | 1.46e-03 | 30 |
| Page: 1 |
Top |
Cell-cell communication analysis |
| Identification of potential cell-cell interactions between two cell types and their ligand-receptor pairs for different disease states |
| Ligand | Receptor | LRpair | Pathway | Tissue | Disease Stage |
| Page: 1 |
Top |
Single-cell gene regulatory network inference analysis |
| Find out the significant the regulons (TFs) and the target genes of each regulon across cell types for different disease states |
| TF | Cell Type | Tissue | Disease Stage | Target Gene | RSS | Regulon Activity |
| ∗The dot plots of a searched regulon are shown for all cell subpopulations in each disease state of each tissue based on the regulon specific score inferred using pySCENIC and by calculating the average expression. |
| Page: 1 |
Top |
Somatic mutation of malignant transformation related genes |
| Annotation of somatic variants for genes involved in malignant transformation |
| Hugo Symbol | Variant Class | Variant Classification | dbSNP RS | HGVSc | HGVSp | HGVSp Short | SWISSPROT | BIOTYPE | SIFT | PolyPhen | Tumor Sample Barcode | Tissue | Histology | Sex | Age | Stage | Therapy Types | Drugs | Outcome |
| WDR61 | SNV | Missense_Mutation | c.156N>C | p.Glu52Asp | p.E52D | Q9GZS3 | protein_coding | tolerated(0.55) | benign(0) | TCGA-D8-A27G-01 | Breast | breast invasive carcinoma | Female | >=65 | I/II | Unknown | Unknown | SD | |
| WDR61 | deletion | Frame_Shift_Del | novel | c.783delN | p.Gly262GlufsTer19 | p.G262Efs*19 | Q9GZS3 | protein_coding | TCGA-EW-A2FV-01 | Breast | breast invasive carcinoma | Female | <65 | III/IV | Chemotherapy | docetaxel | SD | ||
| WDR61 | deletion | Frame_Shift_Del | c.576delC | p.Ile193PhefsTer4 | p.I193Ffs*4 | Q9GZS3 | protein_coding | TCGA-GM-A2DD-01 | Breast | breast invasive carcinoma | Female | <65 | I/II | Chemotherapy | fluorouracil | CR | |||
| WDR61 | SNV | Missense_Mutation | novel | c.294N>C | p.Gln98His | p.Q98H | Q9GZS3 | protein_coding | tolerated(0.39) | possibly_damaging(0.498) | TCGA-C5-A902-01 | Cervix | cervical & endocervical cancer | Female | <65 | I/II | Chemotherapy | cisplatin | SD |
| WDR61 | SNV | Missense_Mutation | c.211G>T | p.Asp71Tyr | p.D71Y | Q9GZS3 | protein_coding | deleterious(0.03) | probably_damaging(0.971) | TCGA-AA-3697-01 | Colorectum | colon adenocarcinoma | Male | >=65 | I/II | Unknown | Unknown | SD | |
| WDR61 | SNV | Missense_Mutation | rs767032547 | c.752N>T | p.Ser251Leu | p.S251L | Q9GZS3 | protein_coding | deleterious(0.03) | possibly_damaging(0.567) | TCGA-AA-A00N-01 | Colorectum | colon adenocarcinoma | Male | >=65 | I/II | Unknown | Unknown | PD |
| WDR61 | SNV | Missense_Mutation | c.364N>A | p.Ala122Thr | p.A122T | Q9GZS3 | protein_coding | deleterious(0.03) | probably_damaging(0.953) | TCGA-AM-5821-01 | Colorectum | colon adenocarcinoma | Female | >=65 | I/II | Unknown | Unknown | SD | |
| WDR61 | SNV | Missense_Mutation | c.569N>T | p.Ala190Val | p.A190V | Q9GZS3 | protein_coding | deleterious(0) | possibly_damaging(0.635) | TCGA-CM-4746-01 | Colorectum | colon adenocarcinoma | Male | <65 | I/II | Unknown | Unknown | SD | |
| WDR61 | SNV | Missense_Mutation | rs139049909 | c.599C>T | p.Pro200Leu | p.P200L | Q9GZS3 | protein_coding | deleterious(0.01) | benign(0.038) | TCGA-CM-6162-01 | Colorectum | colon adenocarcinoma | Female | <65 | III/IV | Chemotherapy | oxaliplatin | SD |
| WDR61 | SNV | Missense_Mutation | novel | c.573N>A | p.Met191Ile | p.M191I | Q9GZS3 | protein_coding | deleterious(0) | benign(0.058) | TCGA-A5-A1OF-01 | Endometrium | uterine corpus endometrioid carcinoma | Female | <65 | I/II | Unknown | Unknown | SD |
| Page: 1 2 3 |
Top |
Related drugs of malignant transformation related genes |
| Identification of chemicals and drugs interact with genes involved in malignant transfromation |
| (DGIdb 4.0) |
| Entrez ID | Symbol | Category | Interaction Types | Drug Claim Name | Drug Name | PMIDs |
| Page: 1 |

Copyright 2023-Present -The University of Texas Health Science Center at Houston |