
|
|||||
|
 | |
| |
| |
| |
| |
| |
|
Gene: WDR60 |
Gene summary for WDR60 |
| Gene information | Species | Human | Gene symbol | WDR60 | Gene ID | 55112 |
| Gene name | dynein 2 intermediate chain 1 | |
| Gene Alias | CFAP163 | |
| Cytomap | 7q36.3 | |
| Gene Type | protein-coding | GO ID | GO:0001501 | UniProtAcc | A0A140VK66 |
Top |
Malignant transformation analysis |
| Identification of the aberrant gene expression in precancerous and cancerous lesions by comparing the gene expression of stem-like cells in diseased tissues with normal stem cells |
| Entrez ID | Symbol | Replicates | Species | Organ | Tissue | Adj P-value | Log2FC | Malignancy |
| 55112 | WDR60 | HTA11_3410_2000001011 | Human | Colorectum | AD | 6.58e-28 | -5.69e-01 | 0.0155 |
| 55112 | WDR60 | HTA11_2487_2000001011 | Human | Colorectum | SER | 1.18e-16 | -5.69e-01 | -0.1808 |
| 55112 | WDR60 | HTA11_2951_2000001011 | Human | Colorectum | AD | 1.69e-03 | -5.69e-01 | 0.0216 |
| 55112 | WDR60 | HTA11_1938_2000001011 | Human | Colorectum | AD | 1.14e-12 | -5.69e-01 | -0.0811 |
| 55112 | WDR60 | HTA11_78_2000001011 | Human | Colorectum | AD | 1.42e-19 | -5.69e-01 | -0.1088 |
| 55112 | WDR60 | HTA11_347_2000001011 | Human | Colorectum | AD | 6.30e-30 | -5.69e-01 | -0.1954 |
| 55112 | WDR60 | HTA11_2112_2000001011 | Human | Colorectum | SER | 7.01e-03 | -5.69e-01 | -0.2196 |
| 55112 | WDR60 | HTA11_3361_2000001011 | Human | Colorectum | AD | 3.70e-13 | -5.69e-01 | -0.1207 |
| 55112 | WDR60 | HTA11_83_2000001011 | Human | Colorectum | SER | 1.58e-10 | -5.69e-01 | -0.1526 |
| 55112 | WDR60 | HTA11_696_2000001011 | Human | Colorectum | AD | 8.56e-30 | -5.69e-01 | -0.1464 |
| 55112 | WDR60 | HTA11_866_2000001011 | Human | Colorectum | AD | 1.89e-27 | -5.69e-01 | -0.1001 |
| 55112 | WDR60 | HTA11_1391_2000001011 | Human | Colorectum | AD | 1.07e-22 | -5.69e-01 | -0.059 |
| 55112 | WDR60 | HTA11_2992_2000001011 | Human | Colorectum | SER | 1.04e-04 | -5.69e-01 | -0.1706 |
| 55112 | WDR60 | HTA11_5212_2000001011 | Human | Colorectum | AD | 1.36e-05 | -5.69e-01 | -0.2061 |
| 55112 | WDR60 | HTA11_5216_2000001011 | Human | Colorectum | SER | 1.69e-03 | -5.69e-01 | -0.1462 |
| 55112 | WDR60 | HTA11_546_2000001011 | Human | Colorectum | AD | 4.43e-09 | -5.69e-01 | -0.0842 |
| 55112 | WDR60 | HTA11_7862_2000001011 | Human | Colorectum | AD | 2.65e-07 | -5.69e-01 | -0.0179 |
| 55112 | WDR60 | HTA11_866_3004761011 | Human | Colorectum | AD | 1.08e-24 | -5.69e-01 | 0.096 |
| 55112 | WDR60 | HTA11_4255_2000001011 | Human | Colorectum | SER | 1.69e-03 | -5.69e-01 | 0.0446 |
| 55112 | WDR60 | HTA11_9408_2000001011 | Human | Colorectum | AD | 2.99e-02 | -5.69e-01 | 0.0451 |
| Page: 1 2 3 4 5 6 7 8 |
| Tissue | Expression Dynamics | Abbreviation |
| Colorectum (GSE201348) |  | FAP: Familial adenomatous polyposis |
| CRC: Colorectal cancer | ||
| Colorectum (HTA11) |  | AD: Adenomas |
| SER: Sessile serrated lesions | ||
| MSI-H: Microsatellite-high colorectal cancer | ||
| MSS: Microsatellite stable colorectal cancer | ||
| Esophagus | 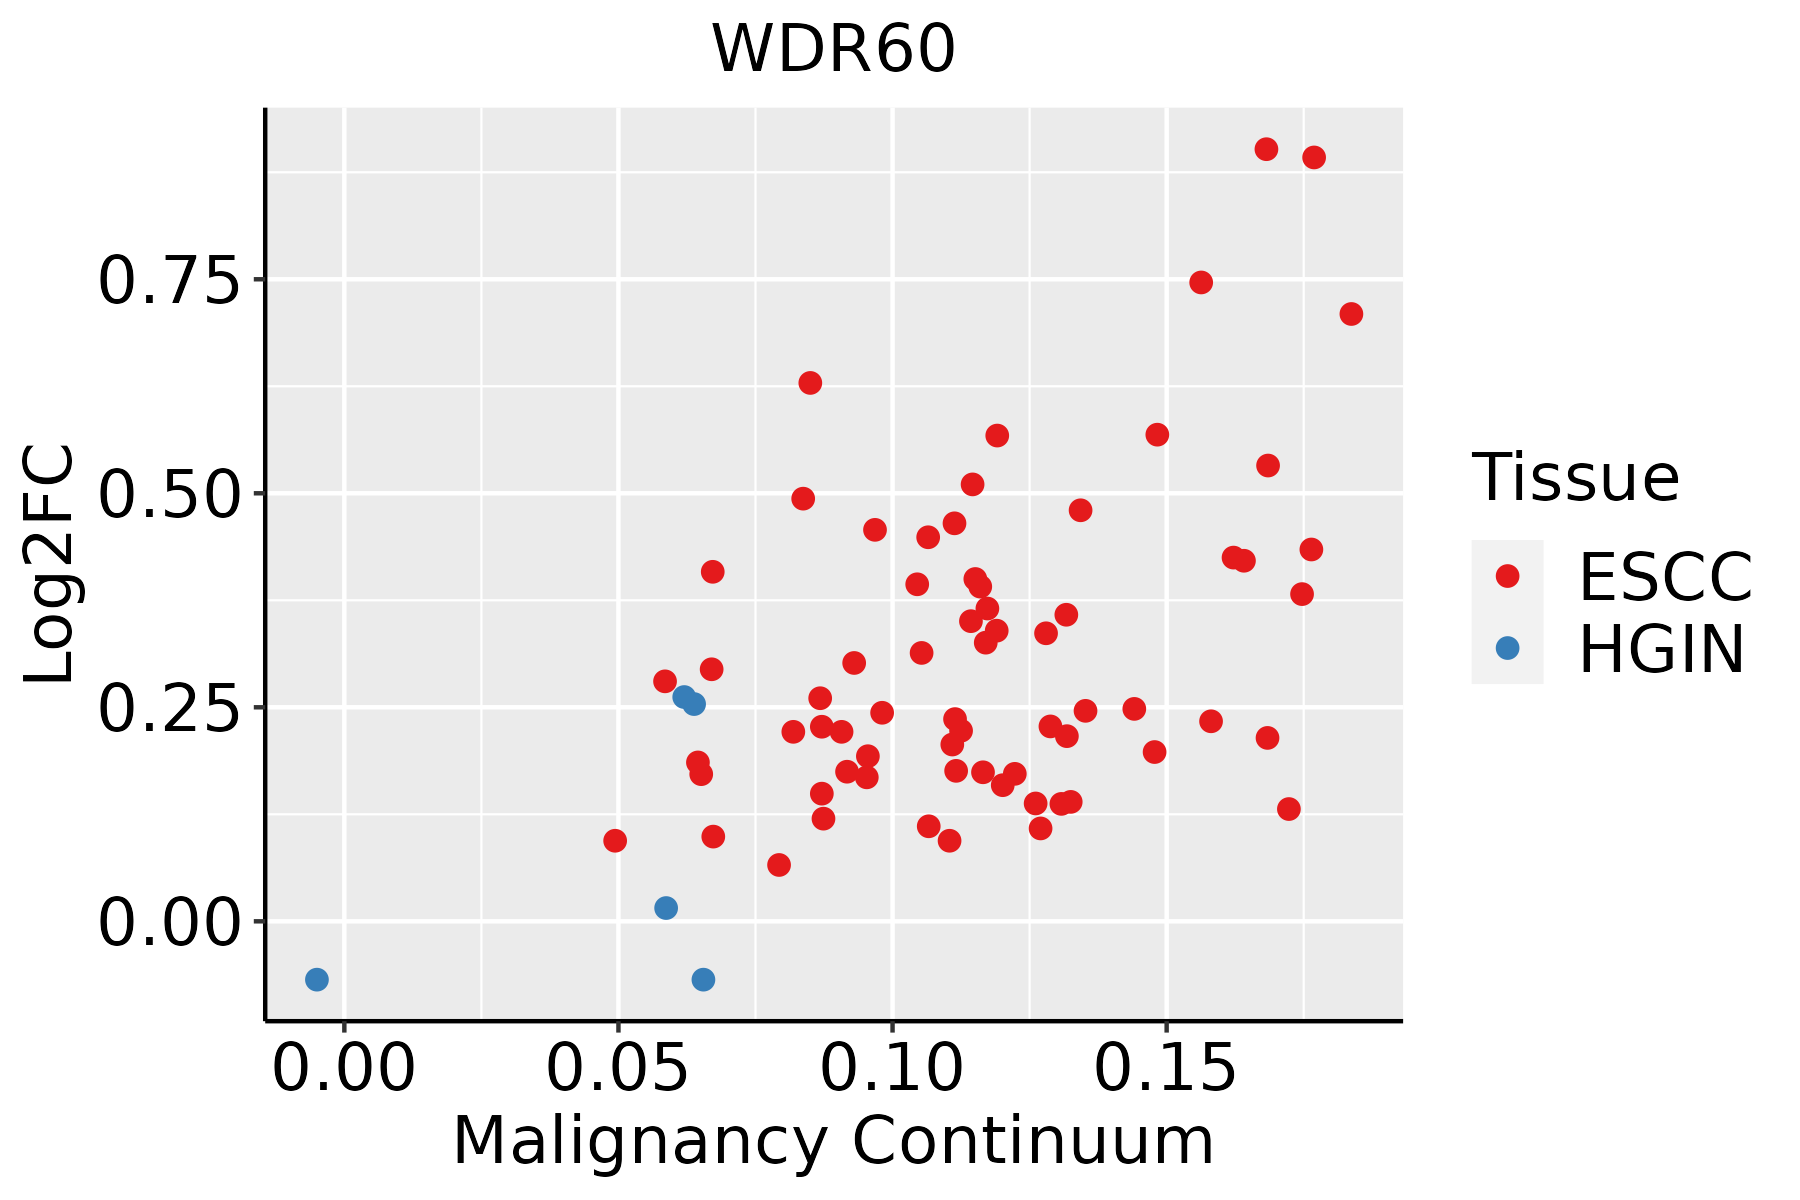 | ESCC: Esophageal squamous cell carcinoma |
| HGIN: High-grade intraepithelial neoplasias | ||
| LGIN: Low-grade intraepithelial neoplasias | ||
| Liver | 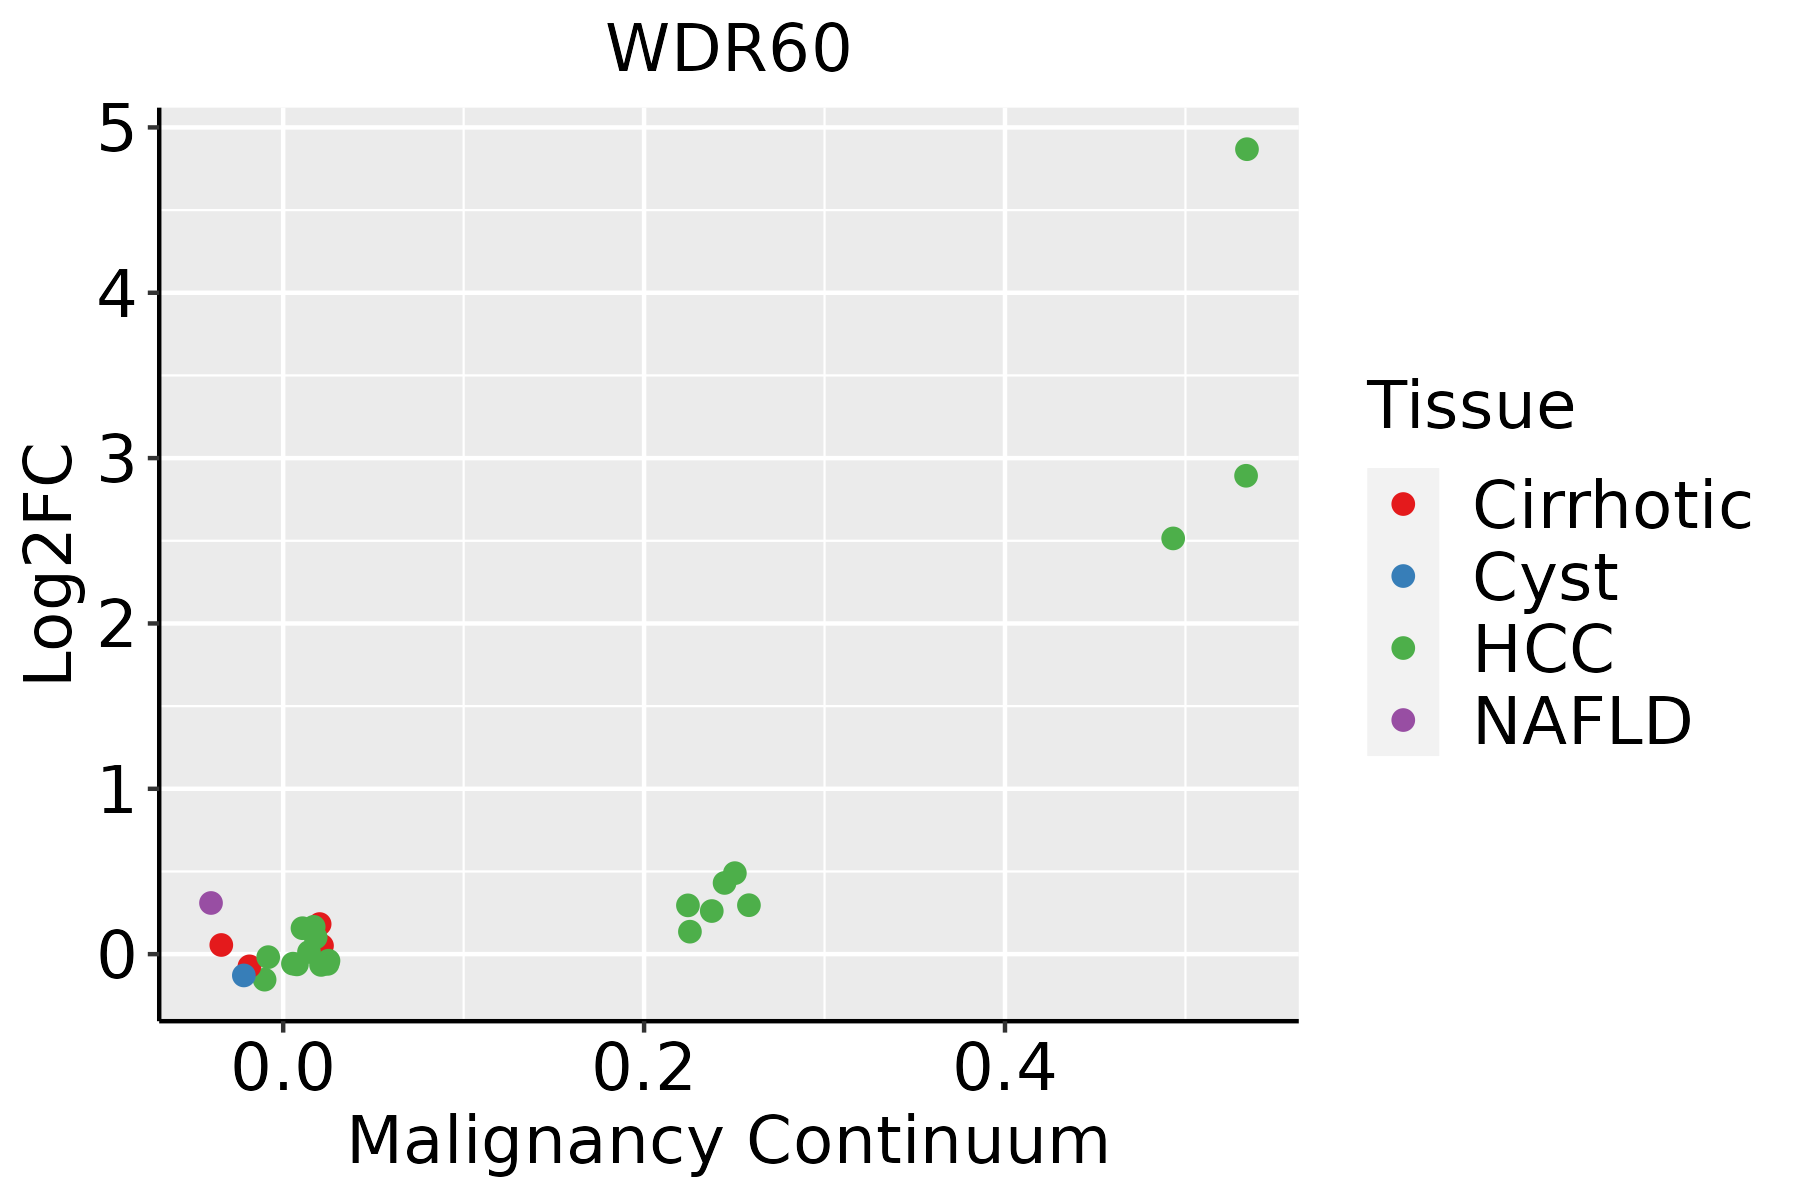 | HCC: Hepatocellular carcinoma |
| NAFLD: Non-alcoholic fatty liver disease | ||
| Lung | 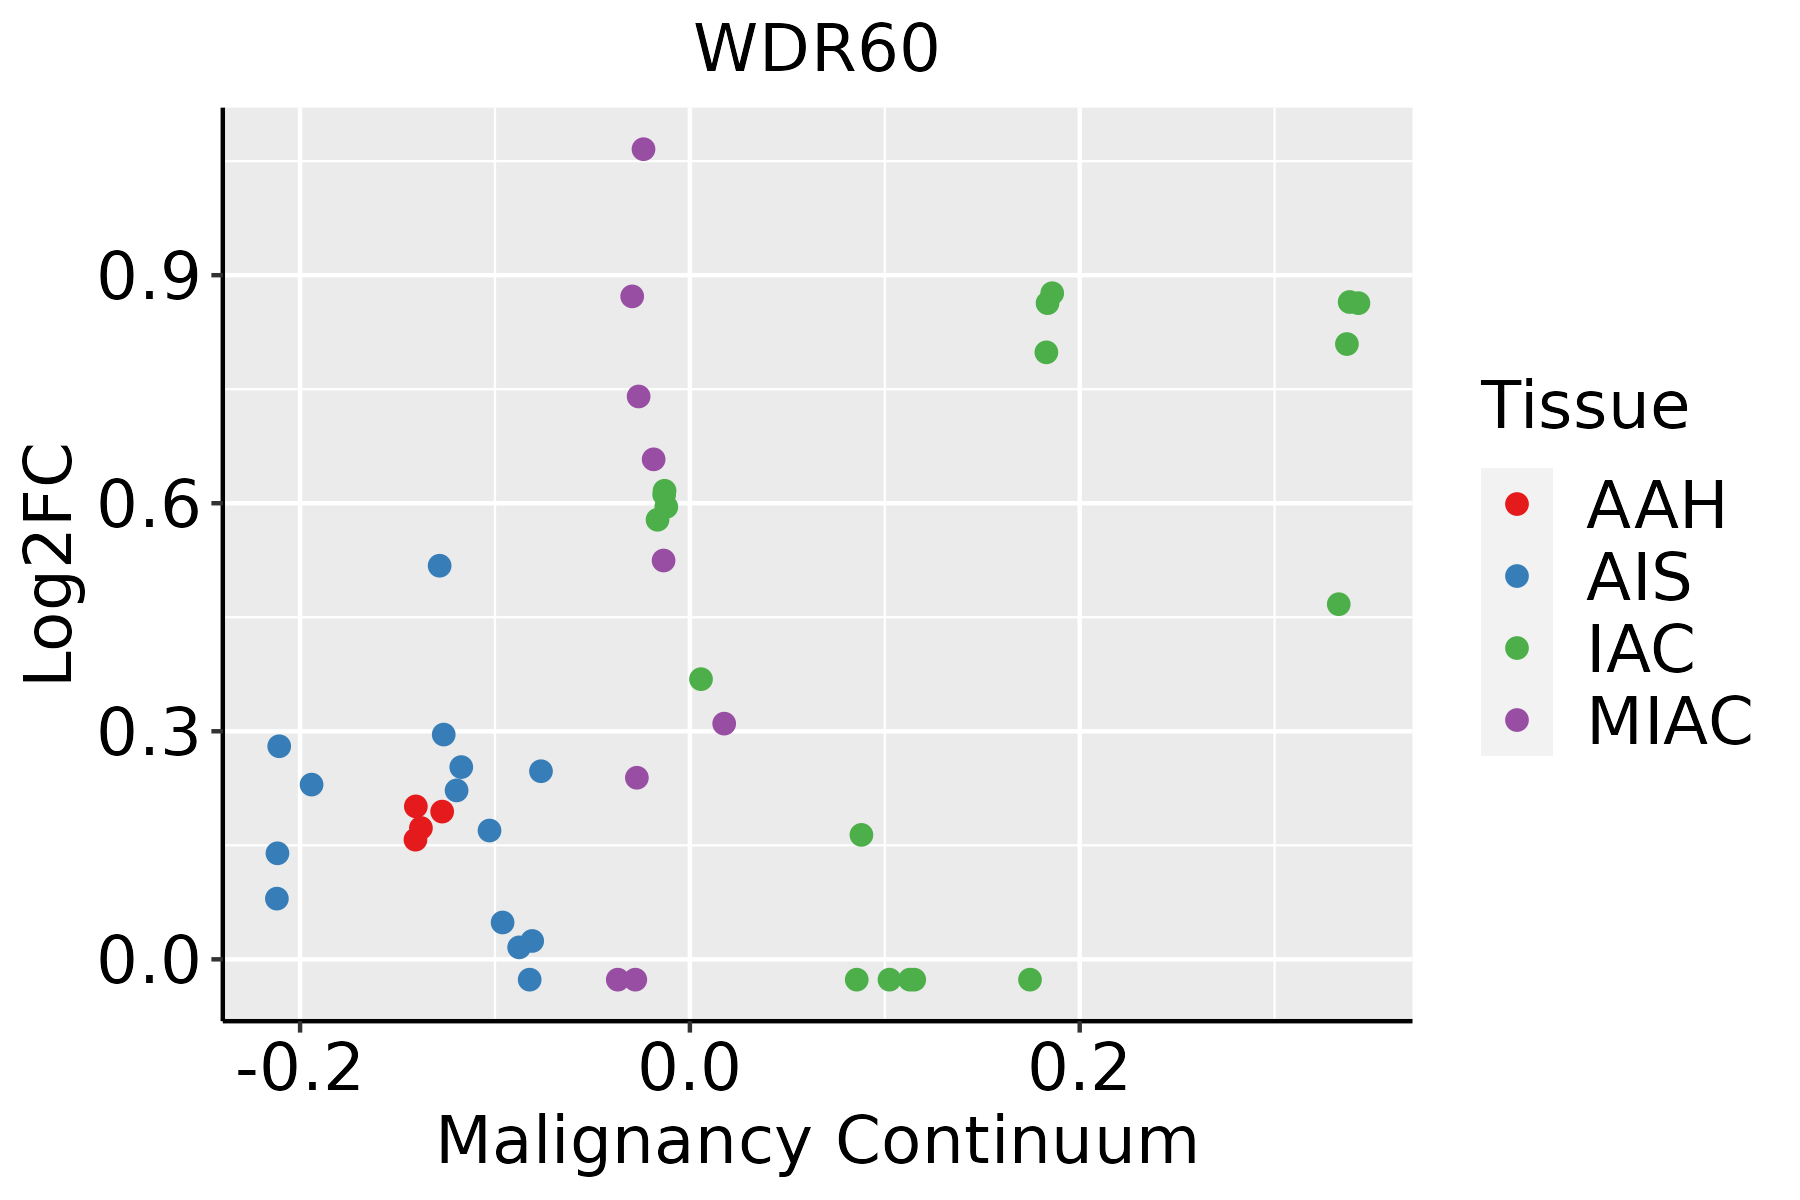 | AAH: Atypical adenomatous hyperplasia |
| AIS: Adenocarcinoma in situ | ||
| IAC: Invasive lung adenocarcinoma | ||
| MIA: Minimally invasive adenocarcinoma | ||
| Thyroid | 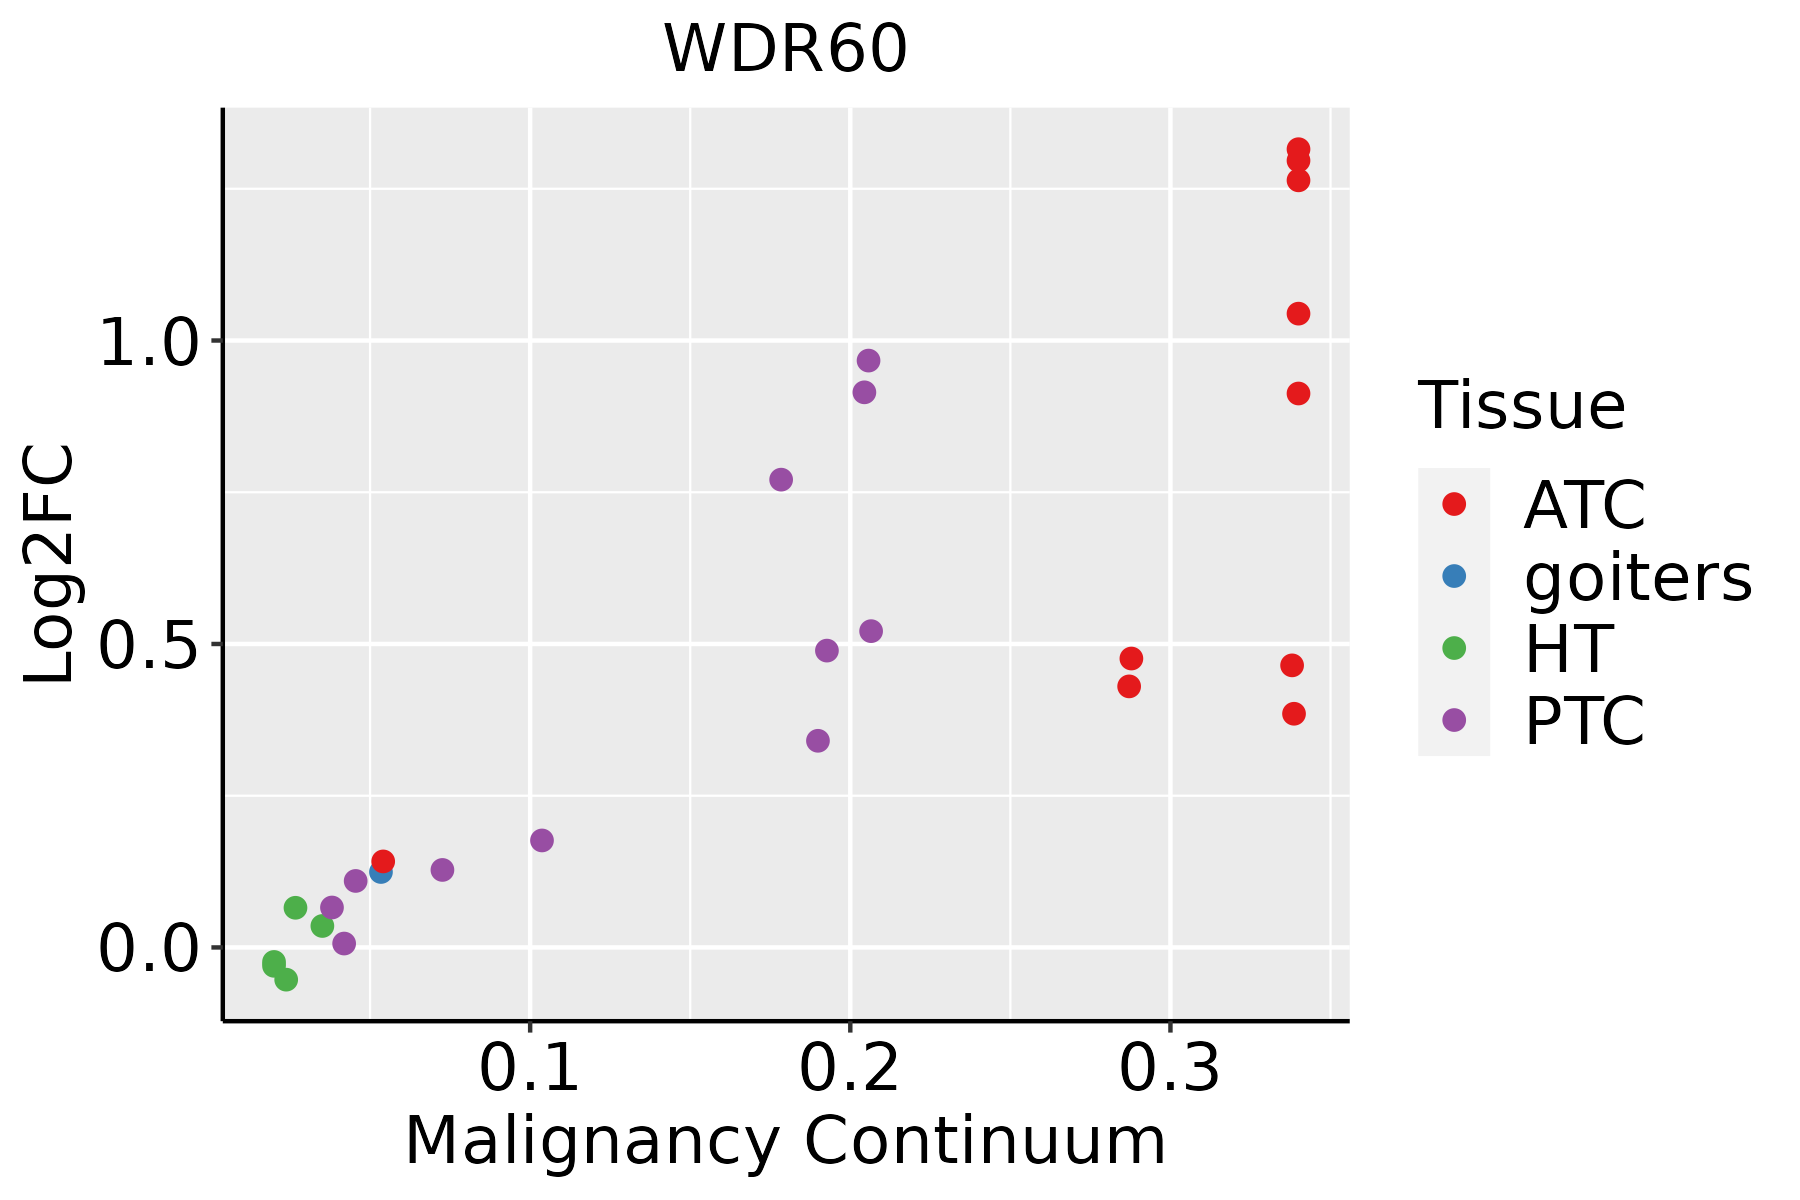 | ATC: Anaplastic thyroid cancer |
| HT: Hashimoto's thyroiditis | ||
| PTC: Papillary thyroid cancer |
| ∗log2FC in expression of this searched gene in stem-like cells from each diseased tissue sample relative to stem-like cells in normal samples in each tissue plotted against the malignancy continuum. Samples are colored based on if they are from different disease stage. |
Top |
Malignant transformation related pathway analysis |
| Find out the enriched GO biological processes and KEGG pathways involved in transition from healthy to precancer to cancer |
| Tissue | Disease Stage | Enriched GO biological Processes |
| Colorectum | AD |  |
| Colorectum | SER |  |
| Colorectum | MSS |  |
| Colorectum | MSI-H |  |
| Colorectum | FAP |  |
| ∗Top 15 enriched GO BP terms are showed in the bar plot of each disease state in each tissue. Each row represents a significant GO biological process which is colored according to the -log10(p.adjust). |
| Page: 1 2 3 4 5 6 7 8 9 |
| GO ID | Tissue | Disease Stage | Description | Gene Ratio | Bg Ratio | pvalue | p.adjust | Count |
| Page: 1 |
| Pathway ID | Tissue | Disease Stage | Description | Gene Ratio | Bg Ratio | pvalue | p.adjust | qvalue | Count |
| Page: 1 |
Top |
Cell-cell communication analysis |
| Identification of potential cell-cell interactions between two cell types and their ligand-receptor pairs for different disease states |
| Ligand | Receptor | LRpair | Pathway | Tissue | Disease Stage |
| Page: 1 |
Top |
Single-cell gene regulatory network inference analysis |
| Find out the significant the regulons (TFs) and the target genes of each regulon across cell types for different disease states |
| TF | Cell Type | Tissue | Disease Stage | Target Gene | RSS | Regulon Activity |
| ∗The dot plots of a searched regulon are shown for all cell subpopulations in each disease state of each tissue based on the regulon specific score inferred using pySCENIC and by calculating the average expression. |
| Page: 1 |
Top |
Somatic mutation of malignant transformation related genes |
| Annotation of somatic variants for genes involved in malignant transformation |
| Hugo Symbol | Variant Class | Variant Classification | dbSNP RS | HGVSc | HGVSp | HGVSp Short | SWISSPROT | BIOTYPE | SIFT | PolyPhen | Tumor Sample Barcode | Tissue | Histology | Sex | Age | Stage | Therapy Types | Drugs | Outcome |
| WDR60 | SNV | Missense_Mutation | novel | c.1484N>T | p.Arg495Leu | p.R495L | Q8WVS4 | protein_coding | deleterious(0.03) | benign(0.045) | TCGA-A2-A25A-01 | Breast | breast invasive carcinoma | Female | <65 | I/II | Unspecific | Cytoxan | SD |
| WDR60 | SNV | Missense_Mutation | rs769059621 | c.2692A>C | p.Lys898Gln | p.K898Q | Q8WVS4 | protein_coding | deleterious(0.03) | benign(0.393) | TCGA-AR-A1AP-01 | Breast | breast invasive carcinoma | Female | >=65 | I/II | Hormone Therapy | anastrozole | SD |
| WDR60 | SNV | Missense_Mutation | rs769059621 | c.2692N>C | p.Lys898Gln | p.K898Q | Q8WVS4 | protein_coding | deleterious(0.03) | benign(0.393) | TCGA-BH-A1FM-01 | Breast | breast invasive carcinoma | Female | <65 | III/IV | Unknown | Unknown | SD |
| WDR60 | SNV | Missense_Mutation | novel | c.448N>A | p.Asp150Asn | p.D150N | Q8WVS4 | protein_coding | deleterious(0.05) | benign(0.027) | TCGA-C8-A278-01 | Breast | breast invasive carcinoma | Female | <65 | III/IV | Hormone Therapy | tamoxiphen | SD |
| WDR60 | SNV | Missense_Mutation | c.1981C>A | p.His661Asn | p.H661N | Q8WVS4 | protein_coding | deleterious(0) | probably_damaging(0.948) | TCGA-D8-A1J8-01 | Breast | breast invasive carcinoma | Female | >=65 | I/II | Hormone Therapy | nolvadex | SD | |
| WDR60 | insertion | Frame_Shift_Ins | novel | c.2614_2615insCTAT | p.Asp872AlafsTer4 | p.D872Afs*4 | Q8WVS4 | protein_coding | TCGA-AC-A3QQ-01 | Breast | breast invasive carcinoma | Female | <65 | I/II | Unknown | Unknown | SD | ||
| WDR60 | insertion | Frame_Shift_Ins | novel | c.300_301insCCTGGTGAGCTGGCTGTCCGGATGCCGCCTTTCCCGGCACGCAC | p.Lys101ProfsTer19 | p.K101Pfs*19 | Q8WVS4 | protein_coding | TCGA-AN-A03X-01 | Breast | breast invasive carcinoma | Female | >=65 | I/II | Unknown | Unknown | SD | ||
| WDR60 | insertion | Frame_Shift_Ins | novel | c.2474_2475insACGGGGTCTGACCCATGGGCAA | p.Ser826ArgfsTer9 | p.S826Rfs*9 | Q8WVS4 | protein_coding | TCGA-B6-A0I5-01 | Breast | breast invasive carcinoma | Female | <65 | I/II | Unknown | Unknown | SD | ||
| WDR60 | SNV | Missense_Mutation | novel | c.2323G>A | p.Val775Ile | p.V775I | Q8WVS4 | protein_coding | tolerated(0.19) | benign(0.037) | TCGA-2W-A8YY-01 | Cervix | cervical & endocervical cancer | Female | <65 | I/II | Chemotherapy | cisplatin | CR |
| WDR60 | SNV | Missense_Mutation | c.2035N>C | p.Cys679Arg | p.C679R | Q8WVS4 | protein_coding | deleterious(0) | probably_damaging(0.999) | TCGA-DR-A0ZL-01 | Cervix | cervical & endocervical cancer | Female | <65 | I/II | Unknown | Unknown | SD |
| Page: 1 2 3 4 5 6 7 8 9 10 11 12 13 14 15 |
Top |
Related drugs of malignant transformation related genes |
| Identification of chemicals and drugs interact with genes involved in malignant transfromation |
| (DGIdb 4.0) |
| Entrez ID | Symbol | Category | Interaction Types | Drug Claim Name | Drug Name | PMIDs |
| Page: 1 |

Copyright 2023-Present -The University of Texas Health Science Center at Houston |