
|
|||||
|
 | |
| |
| |
| |
| |
| |
|
Gene: WDR6 |
Gene summary for WDR6 |
| Gene information | Species | Human | Gene symbol | WDR6 | Gene ID | 11180 |
| Gene name | WD repeat domain 6 | |
| Gene Alias | WDR6 | |
| Cytomap | 3p21.31 | |
| Gene Type | protein-coding | GO ID | GO:0001510 | UniProtAcc | Q9H9M3 |
Top |
Malignant transformation analysis |
| Identification of the aberrant gene expression in precancerous and cancerous lesions by comparing the gene expression of stem-like cells in diseased tissues with normal stem cells |
| Entrez ID | Symbol | Replicates | Species | Organ | Tissue | Adj P-value | Log2FC | Malignancy |
| 11180 | WDR6 | S43 | Human | Liver | Cirrhotic | 2.42e-07 | -1.48e-01 | -0.0187 |
| 11180 | WDR6 | HCC1_Meng | Human | Liver | HCC | 1.17e-66 | 8.50e-02 | 0.0246 |
| 11180 | WDR6 | HCC2_Meng | Human | Liver | HCC | 3.01e-08 | -8.89e-02 | 0.0107 |
| 11180 | WDR6 | cirrhotic2 | Human | Liver | Cirrhotic | 2.28e-07 | 2.12e-01 | 0.0201 |
| 11180 | WDR6 | cirrhotic3 | Human | Liver | Cirrhotic | 4.15e-02 | 7.09e-02 | 0.0215 |
| 11180 | WDR6 | HCC1 | Human | Liver | HCC | 2.12e-14 | 4.52e+00 | 0.5336 |
| 11180 | WDR6 | HCC2 | Human | Liver | HCC | 1.11e-17 | 4.27e+00 | 0.5341 |
| 11180 | WDR6 | S014 | Human | Liver | HCC | 8.87e-17 | 8.54e-01 | 0.2254 |
| 11180 | WDR6 | S015 | Human | Liver | HCC | 7.51e-15 | 8.66e-01 | 0.2375 |
| 11180 | WDR6 | S016 | Human | Liver | HCC | 5.55e-20 | 8.39e-01 | 0.2243 |
| 11180 | WDR6 | S027 | Human | Liver | HCC | 1.43e-08 | 9.78e-01 | 0.2446 |
| 11180 | WDR6 | S028 | Human | Liver | HCC | 5.79e-27 | 1.22e+00 | 0.2503 |
| 11180 | WDR6 | S029 | Human | Liver | HCC | 6.70e-24 | 1.15e+00 | 0.2581 |
| 11180 | WDR6 | C04 | Human | Oral cavity | OSCC | 1.57e-05 | 3.67e-01 | 0.2633 |
| 11180 | WDR6 | C21 | Human | Oral cavity | OSCC | 3.41e-15 | 5.25e-01 | 0.2678 |
| 11180 | WDR6 | C30 | Human | Oral cavity | OSCC | 9.46e-18 | 8.51e-01 | 0.3055 |
| 11180 | WDR6 | C38 | Human | Oral cavity | OSCC | 6.74e-04 | 4.37e-01 | 0.172 |
| 11180 | WDR6 | C43 | Human | Oral cavity | OSCC | 1.64e-11 | 1.74e-01 | 0.1704 |
| 11180 | WDR6 | C46 | Human | Oral cavity | OSCC | 1.58e-20 | 5.38e-01 | 0.1673 |
| 11180 | WDR6 | C51 | Human | Oral cavity | OSCC | 2.23e-03 | 4.19e-01 | 0.2674 |
| Page: 1 2 3 4 |
| Tissue | Expression Dynamics | Abbreviation |
| Liver |  | HCC: Hepatocellular carcinoma |
| NAFLD: Non-alcoholic fatty liver disease | ||
| Oral Cavity | 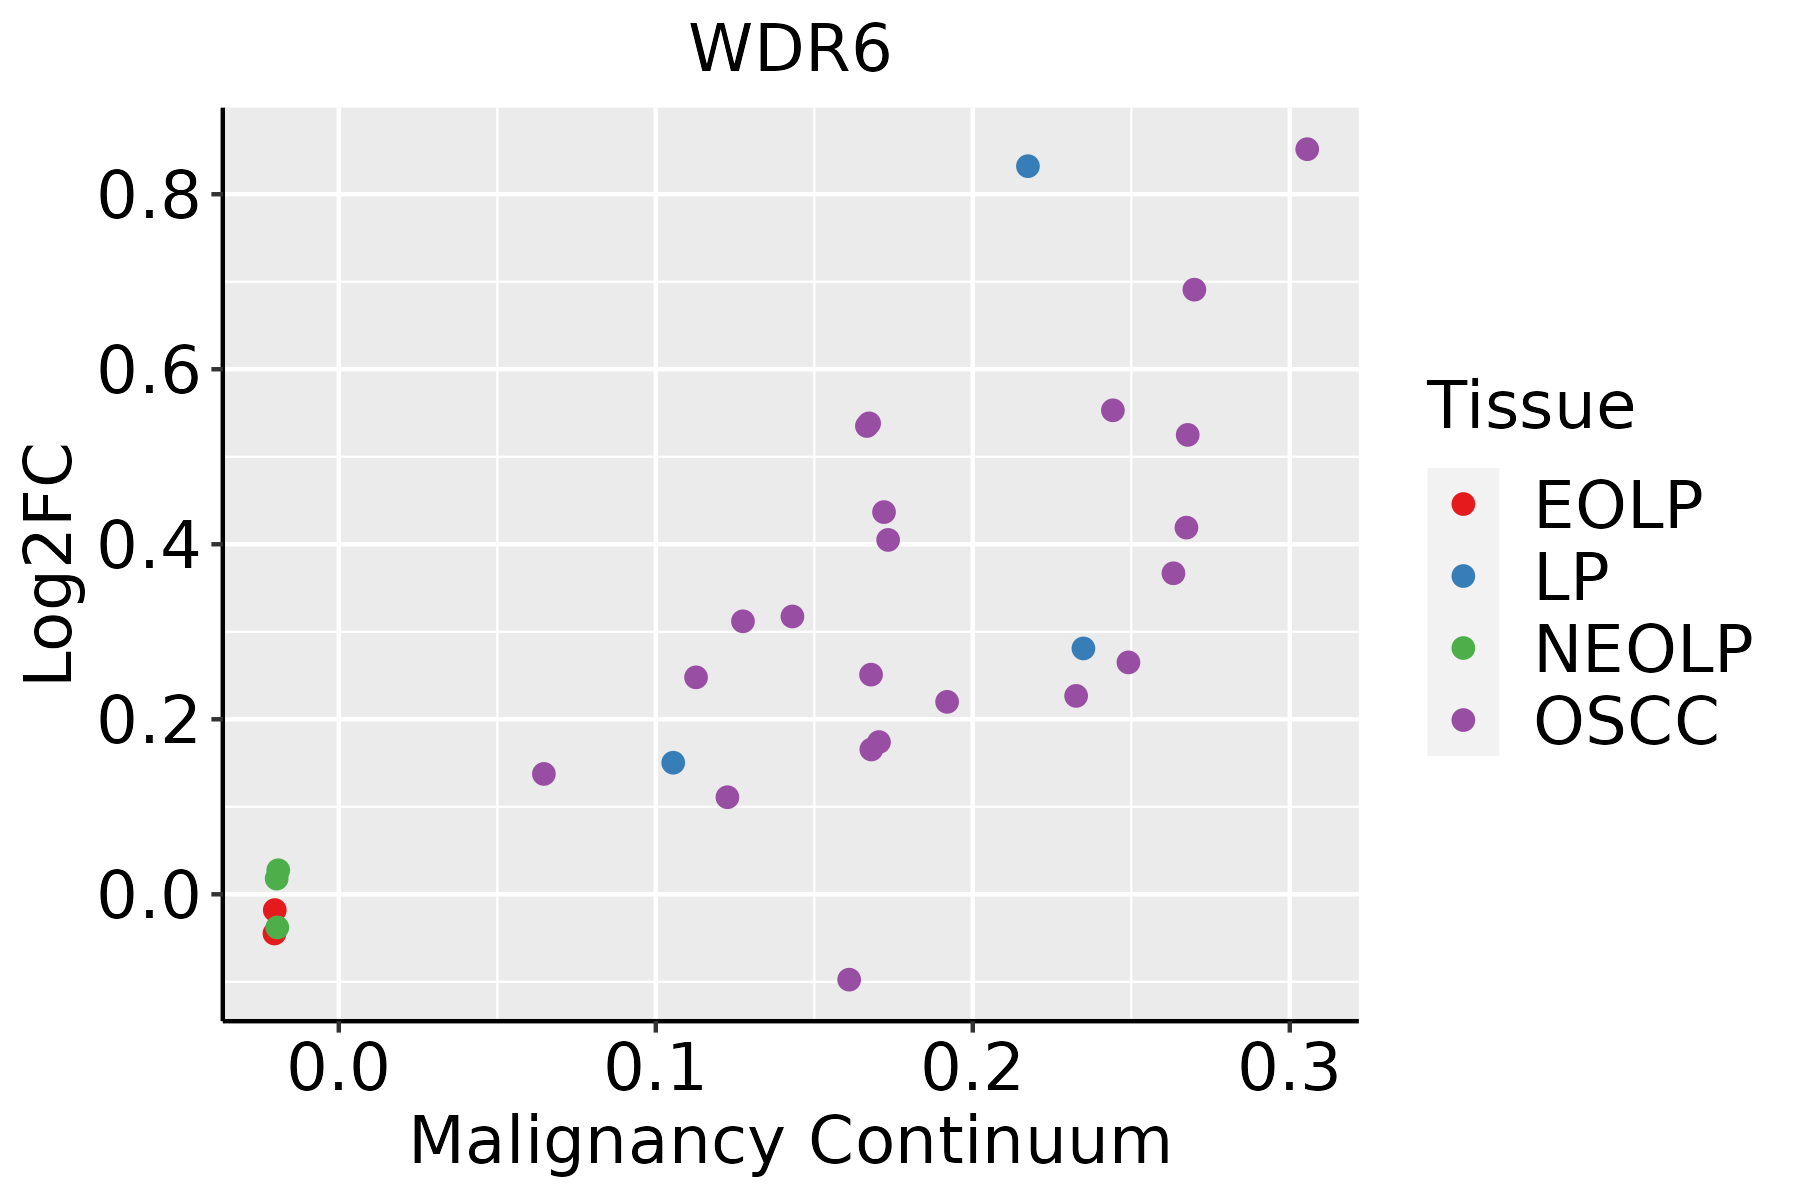 | EOLP: Erosive Oral lichen planus |
| LP: leukoplakia | ||
| NEOLP: Non-erosive oral lichen planus | ||
| OSCC: Oral squamous cell carcinoma | ||
| Prostate |  | BPH: Benign Prostatic Hyperplasia |
| Thyroid | 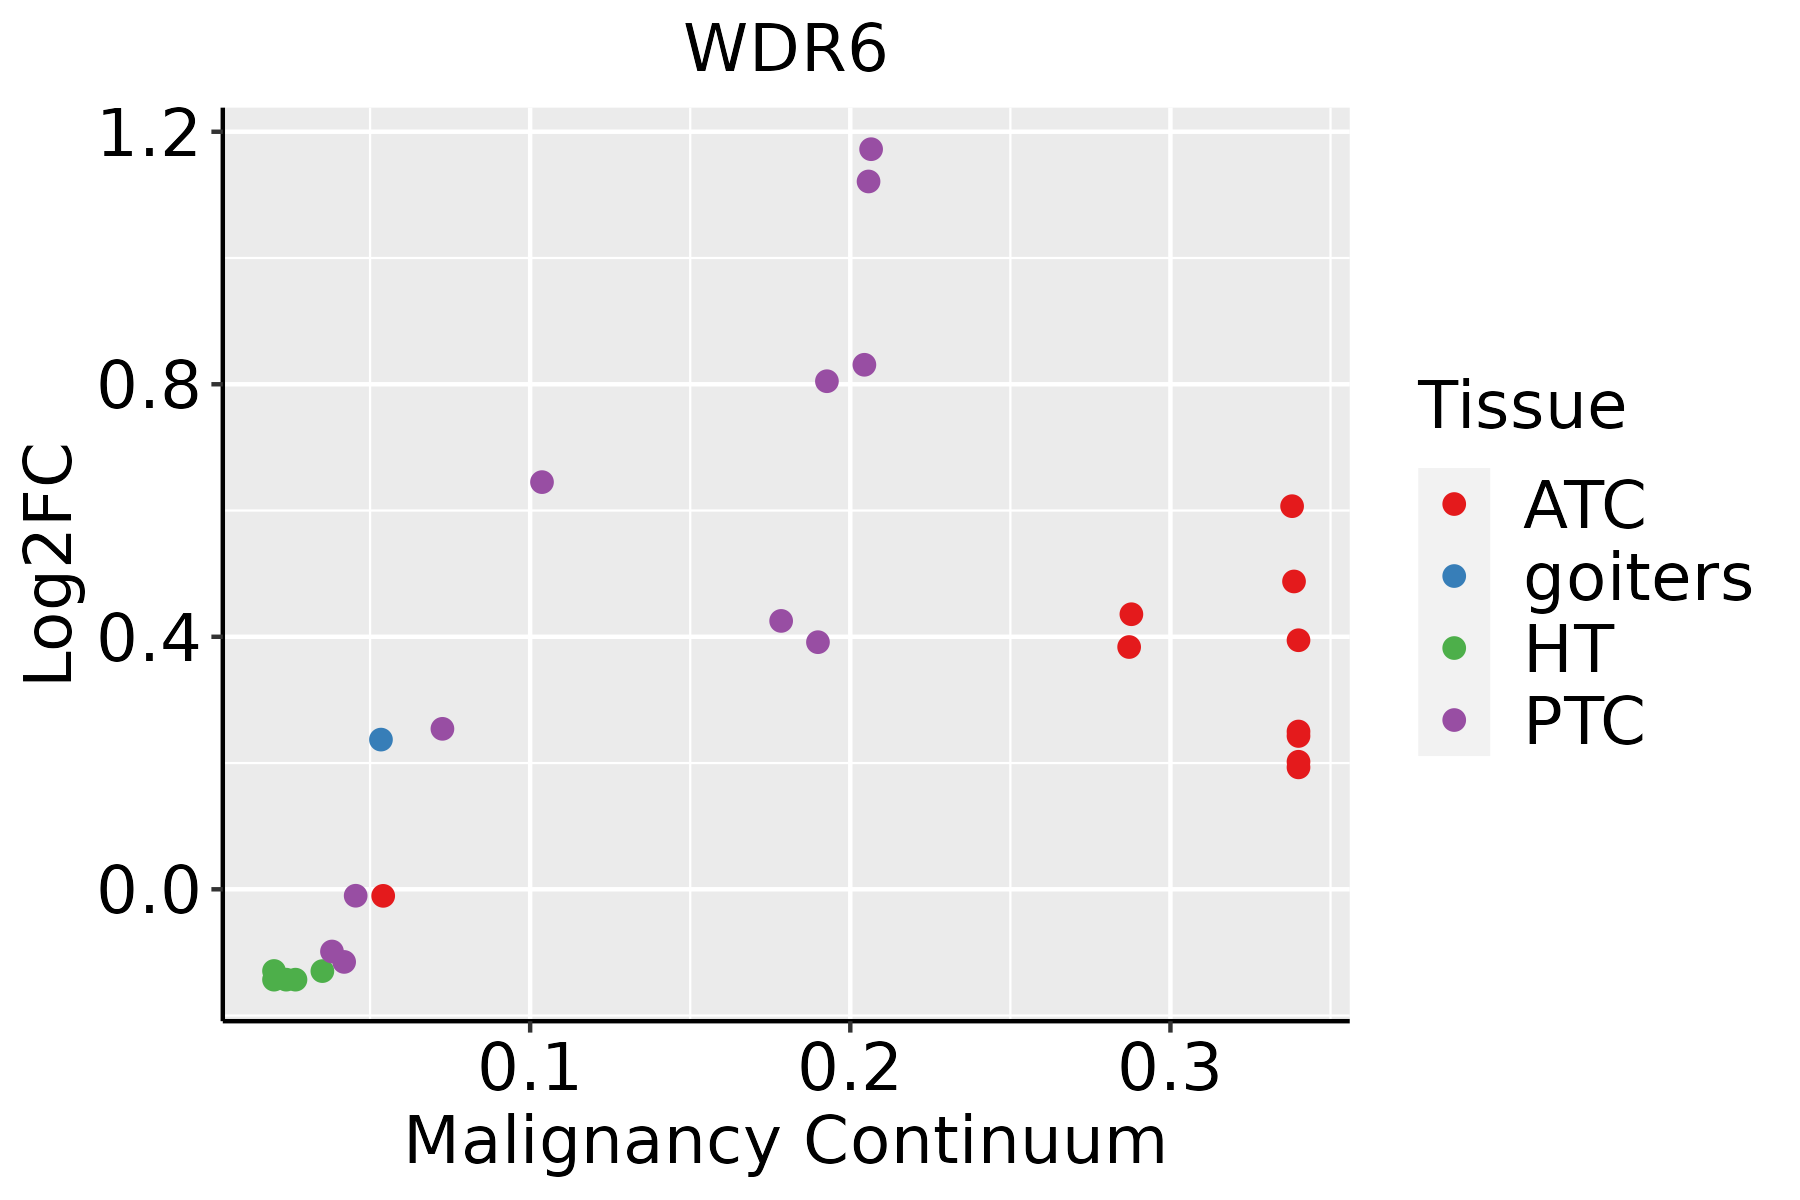 | ATC: Anaplastic thyroid cancer |
| HT: Hashimoto's thyroiditis | ||
| PTC: Papillary thyroid cancer |
| ∗log2FC in expression of this searched gene in stem-like cells from each diseased tissue sample relative to stem-like cells in normal samples in each tissue plotted against the malignancy continuum. Samples are colored based on if they are from different disease stage. |
Top |
Malignant transformation related pathway analysis |
| Find out the enriched GO biological processes and KEGG pathways involved in transition from healthy to precancer to cancer |
| Tissue | Disease Stage | Enriched GO biological Processes |
| Colorectum | AD |  |
| Colorectum | SER |  |
| Colorectum | MSS |  |
| Colorectum | MSI-H |  |
| Colorectum | FAP |  |
| ∗Top 15 enriched GO BP terms are showed in the bar plot of each disease state in each tissue. Each row represents a significant GO biological process which is colored according to the -log10(p.adjust). |
| Page: 1 2 3 4 5 6 7 8 9 |
| GO ID | Tissue | Disease Stage | Description | Gene Ratio | Bg Ratio | pvalue | p.adjust | Count |
| GO:001657015 | Esophagus | ESCC | histone modification | 323/8552 | 463/18723 | 2.61e-26 | 7.88e-24 | 323 |
| GO:001820514 | Esophagus | ESCC | peptidyl-lysine modification | 259/8552 | 376/18723 | 3.90e-20 | 5.26e-18 | 259 |
| GO:000635414 | Esophagus | ESCC | DNA-templated transcription, elongation | 76/8552 | 91/18723 | 8.35e-14 | 4.11e-12 | 76 |
| GO:001605517 | Esophagus | ESCC | Wnt signaling pathway | 268/8552 | 444/18723 | 2.32e-10 | 6.58e-09 | 268 |
| GO:019873817 | Esophagus | ESCC | cell-cell signaling by wnt | 269/8552 | 446/18723 | 2.41e-10 | 6.79e-09 | 269 |
| GO:00434143 | Esophagus | ESCC | macromolecule methylation | 199/8552 | 316/18723 | 3.44e-10 | 9.57e-09 | 199 |
| GO:0030099111 | Esophagus | ESCC | myeloid cell differentiation | 232/8552 | 381/18723 | 1.22e-09 | 2.90e-08 | 232 |
| GO:000636814 | Esophagus | ESCC | transcription elongation from RNA polymerase II promoter | 56/8552 | 69/18723 | 1.40e-09 | 3.30e-08 | 56 |
| GO:003105614 | Esophagus | ESCC | regulation of histone modification | 106/8552 | 152/18723 | 1.52e-09 | 3.55e-08 | 106 |
| GO:00322592 | Esophagus | ESCC | methylation | 222/8552 | 364/18723 | 2.26e-09 | 5.09e-08 | 222 |
| GO:000647914 | Esophagus | ESCC | protein methylation | 115/8552 | 181/18723 | 9.07e-07 | 1.16e-05 | 115 |
| GO:000821314 | Esophagus | ESCC | protein alkylation | 115/8552 | 181/18723 | 9.07e-07 | 1.16e-05 | 115 |
| GO:00310583 | Esophagus | ESCC | positive regulation of histone modification | 65/8552 | 92/18723 | 1.04e-06 | 1.31e-05 | 65 |
| GO:00165718 | Esophagus | ESCC | histone methylation | 89/8552 | 141/18723 | 2.17e-05 | 1.87e-04 | 89 |
| GO:003496814 | Esophagus | ESCC | histone lysine methylation | 72/8552 | 115/18723 | 1.85e-04 | 1.18e-03 | 72 |
| GO:1903706110 | Esophagus | ESCC | regulation of hemopoiesis | 201/8552 | 367/18723 | 2.60e-04 | 1.58e-03 | 201 |
| GO:003106013 | Esophagus | ESCC | regulation of histone methylation | 46/8552 | 69/18723 | 3.46e-04 | 2.03e-03 | 46 |
| GO:001802214 | Esophagus | ESCC | peptidyl-lysine methylation | 79/8552 | 131/18723 | 5.17e-04 | 2.86e-03 | 79 |
| GO:0045637111 | Esophagus | ESCC | regulation of myeloid cell differentiation | 118/8552 | 210/18723 | 1.35e-03 | 6.43e-03 | 118 |
| GO:003106211 | Esophagus | ESCC | positive regulation of histone methylation | 28/8552 | 41/18723 | 2.88e-03 | 1.21e-02 | 28 |
| Page: 1 2 3 4 5 6 7 8 9 10 11 12 13 |
| Pathway ID | Tissue | Disease Stage | Description | Gene Ratio | Bg Ratio | pvalue | p.adjust | qvalue | Count |
| Page: 1 |
Top |
Cell-cell communication analysis |
| Identification of potential cell-cell interactions between two cell types and their ligand-receptor pairs for different disease states |
| Ligand | Receptor | LRpair | Pathway | Tissue | Disease Stage |
| Page: 1 |
Top |
Single-cell gene regulatory network inference analysis |
| Find out the significant the regulons (TFs) and the target genes of each regulon across cell types for different disease states |
| TF | Cell Type | Tissue | Disease Stage | Target Gene | RSS | Regulon Activity |
| ∗The dot plots of a searched regulon are shown for all cell subpopulations in each disease state of each tissue based on the regulon specific score inferred using pySCENIC and by calculating the average expression. |
| Page: 1 |
Top |
Somatic mutation of malignant transformation related genes |
| Annotation of somatic variants for genes involved in malignant transformation |
| Hugo Symbol | Variant Class | Variant Classification | dbSNP RS | HGVSc | HGVSp | HGVSp Short | SWISSPROT | BIOTYPE | SIFT | PolyPhen | Tumor Sample Barcode | Tissue | Histology | Sex | Age | Stage | Therapy Types | Drugs | Outcome |
| WDR6 | SNV | Missense_Mutation | novel | c.3151G>A | p.Glu1051Lys | p.E1051K | protein_coding | tolerated(0.35) | benign(0.015) | TCGA-5L-AAT1-01 | Breast | breast invasive carcinoma | Female | <65 | III/IV | Hormone Therapy | letrozol | SD | |
| WDR6 | SNV | Missense_Mutation | novel | c.2837N>C | p.Val946Ala | p.V946A | protein_coding | deleterious(0.03) | possibly_damaging(0.597) | TCGA-A7-A5ZW-01 | Breast | breast invasive carcinoma | Female | <65 | I/II | Chemotherapy | cyclophosphamide | CR | |
| WDR6 | SNV | Missense_Mutation | c.2764N>G | p.Leu922Val | p.L922V | protein_coding | tolerated(0.6) | benign(0.005) | TCGA-AC-A23H-01 | Breast | breast invasive carcinoma | Female | >=65 | I/II | Unknown | Unknown | PD | ||
| WDR6 | SNV | Missense_Mutation | c.613N>G | p.Ile205Val | p.I205V | protein_coding | tolerated(0.36) | benign(0.003) | TCGA-BH-A0HA-01 | Breast | breast invasive carcinoma | Female | <65 | I/II | Unknown | Unknown | SD | ||
| WDR6 | SNV | Missense_Mutation | rs61732633 | c.2417N>T | p.Ser806Leu | p.S806L | protein_coding | deleterious(0) | probably_damaging(0.991) | TCGA-BH-A0HF-01 | Breast | breast invasive carcinoma | Female | >=65 | I/II | Hormone Therapy | arimidex | SD | |
| WDR6 | SNV | Missense_Mutation | c.3394G>C | p.Glu1132Gln | p.E1132Q | protein_coding | tolerated(0.16) | possibly_damaging(0.857) | TCGA-C8-A26Y-01 | Breast | breast invasive carcinoma | Female | >=65 | I/II | Unknown | Unknown | SD | ||
| WDR6 | SNV | Missense_Mutation | c.1507N>C | p.Gly503Arg | p.G503R | protein_coding | tolerated(0.06) | probably_damaging(1) | TCGA-GM-A2DB-01 | Breast | breast invasive carcinoma | Female | <65 | I/II | Chemotherapy | taxol | CR | ||
| WDR6 | SNV | Missense_Mutation | rs542788663 | c.1960N>A | p.Asp654Asn | p.D654N | protein_coding | tolerated(0.07) | probably_damaging(0.994) | TCGA-PE-A5DE-01 | Breast | breast invasive carcinoma | Female | <65 | I/II | Chemotherapy | taxotere | CR | |
| WDR6 | deletion | Frame_Shift_Del | c.1342_1370delAAGGTTGTCCCCATCAACACTCCAACTGC | p.Lys448CysfsTer22 | p.K448Cfs*22 | protein_coding | TCGA-B6-A0RS-01 | Breast | breast invasive carcinoma | Female | <65 | I/II | Unknown | Unknown | PD | ||||
| WDR6 | deletion | Frame_Shift_Del | novel | c.226delN | p.Phe76LeufsTer7 | p.F76Lfs*7 | protein_coding | TCGA-D8-A27V-01 | Breast | breast invasive carcinoma | Female | <65 | I/II | Hormone Therapy | tamoxiphen | SD |
| Page: 1 2 3 4 5 6 7 8 9 10 11 |
Top |
Related drugs of malignant transformation related genes |
| Identification of chemicals and drugs interact with genes involved in malignant transfromation |
| (DGIdb 4.0) |
| Entrez ID | Symbol | Category | Interaction Types | Drug Claim Name | Drug Name | PMIDs |
| Page: 1 |

Copyright 2023-Present -The University of Texas Health Science Center at Houston |