
|
|||||
|
 | |
| |
| |
| |
| |
| |
|
Gene: WDR59 |
Gene summary for WDR59 |
| Gene information | Species | Human | Gene symbol | WDR59 | Gene ID | 79726 |
| Gene name | WD repeat domain 59 | |
| Gene Alias | CDW12 | |
| Cytomap | 16q23.1 | |
| Gene Type | protein-coding | GO ID | GO:0006950 | UniProtAcc | Q6PJI9 |
Top |
Malignant transformation analysis |
| Identification of the aberrant gene expression in precancerous and cancerous lesions by comparing the gene expression of stem-like cells in diseased tissues with normal stem cells |
| Entrez ID | Symbol | Replicates | Species | Organ | Tissue | Adj P-value | Log2FC | Malignancy |
| 79726 | WDR59 | LZE2T | Human | Esophagus | ESCC | 4.02e-03 | 3.62e-01 | 0.082 |
| 79726 | WDR59 | LZE4T | Human | Esophagus | ESCC | 1.03e-08 | 1.89e-01 | 0.0811 |
| 79726 | WDR59 | LZE7T | Human | Esophagus | ESCC | 7.96e-10 | 3.62e-01 | 0.0667 |
| 79726 | WDR59 | LZE8T | Human | Esophagus | ESCC | 1.86e-03 | 5.67e-02 | 0.067 |
| 79726 | WDR59 | LZE20T | Human | Esophagus | ESCC | 2.50e-05 | 7.78e-02 | 0.0662 |
| 79726 | WDR59 | LZE21D1 | Human | Esophagus | HGIN | 1.64e-04 | 2.77e-01 | 0.0632 |
| 79726 | WDR59 | LZE22D1 | Human | Esophagus | HGIN | 3.56e-02 | 9.04e-02 | 0.0595 |
| 79726 | WDR59 | LZE24T | Human | Esophagus | ESCC | 2.79e-06 | 2.13e-01 | 0.0596 |
| 79726 | WDR59 | LZE21T | Human | Esophagus | ESCC | 1.80e-05 | 3.34e-01 | 0.0655 |
| 79726 | WDR59 | P1T-E | Human | Esophagus | ESCC | 1.85e-15 | 6.17e-01 | 0.0875 |
| 79726 | WDR59 | P2T-E | Human | Esophagus | ESCC | 1.12e-02 | 1.50e-01 | 0.1177 |
| 79726 | WDR59 | P4T-E | Human | Esophagus | ESCC | 3.17e-19 | 1.95e-01 | 0.1323 |
| 79726 | WDR59 | P5T-E | Human | Esophagus | ESCC | 8.20e-09 | 7.38e-02 | 0.1327 |
| 79726 | WDR59 | P8T-E | Human | Esophagus | ESCC | 6.82e-14 | 3.44e-01 | 0.0889 |
| 79726 | WDR59 | P9T-E | Human | Esophagus | ESCC | 1.49e-09 | 8.93e-02 | 0.1131 |
| 79726 | WDR59 | P10T-E | Human | Esophagus | ESCC | 2.29e-07 | 1.13e-01 | 0.116 |
| 79726 | WDR59 | P11T-E | Human | Esophagus | ESCC | 1.49e-13 | 3.23e-01 | 0.1426 |
| 79726 | WDR59 | P12T-E | Human | Esophagus | ESCC | 1.11e-13 | 2.24e-01 | 0.1122 |
| 79726 | WDR59 | P15T-E | Human | Esophagus | ESCC | 6.08e-14 | 2.26e-01 | 0.1149 |
| 79726 | WDR59 | P16T-E | Human | Esophagus | ESCC | 1.27e-15 | 1.66e-01 | 0.1153 |
| Page: 1 2 3 4 5 6 |
| Tissue | Expression Dynamics | Abbreviation |
| Esophagus |  | ESCC: Esophageal squamous cell carcinoma |
| HGIN: High-grade intraepithelial neoplasias | ||
| LGIN: Low-grade intraepithelial neoplasias | ||
| Liver |  | HCC: Hepatocellular carcinoma |
| NAFLD: Non-alcoholic fatty liver disease | ||
| Oral Cavity |  | EOLP: Erosive Oral lichen planus |
| LP: leukoplakia | ||
| NEOLP: Non-erosive oral lichen planus | ||
| OSCC: Oral squamous cell carcinoma | ||
| Thyroid | 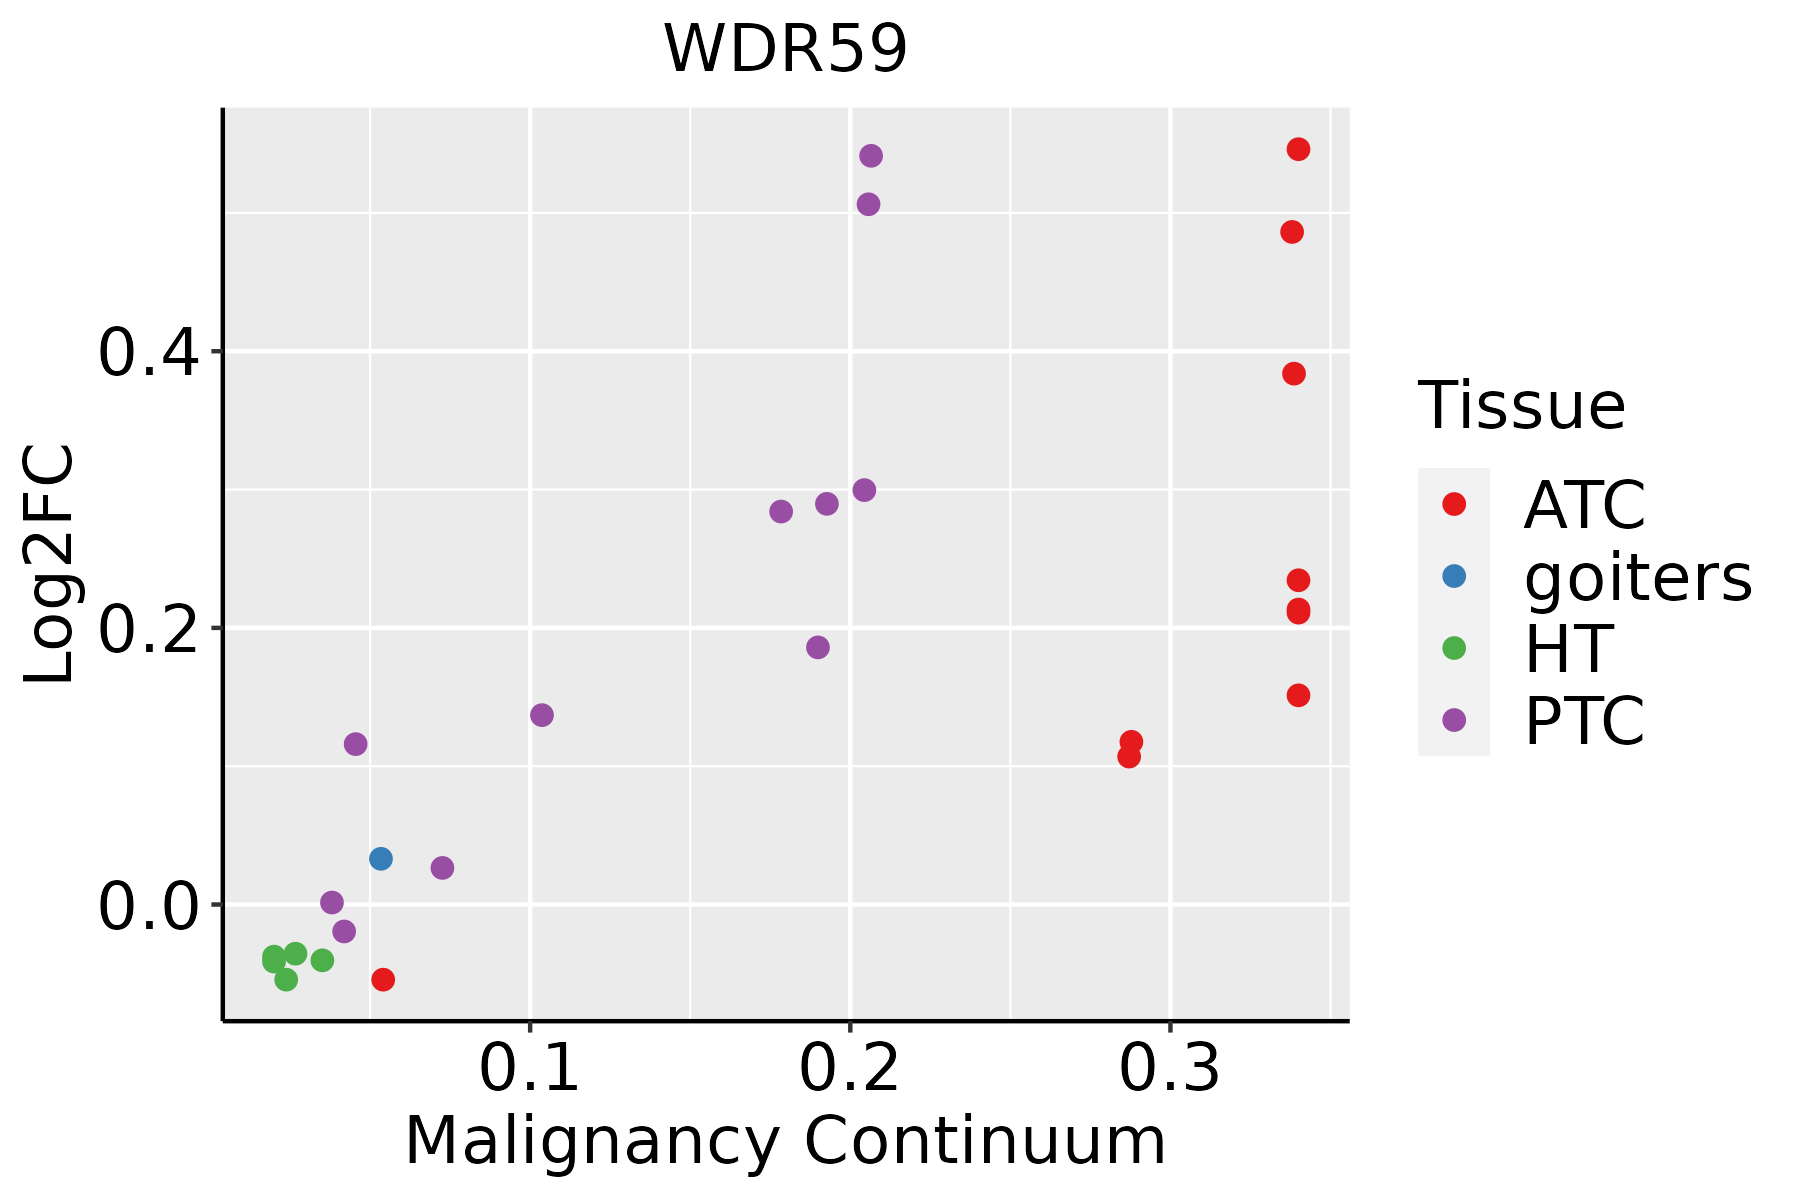 | ATC: Anaplastic thyroid cancer |
| HT: Hashimoto's thyroiditis | ||
| PTC: Papillary thyroid cancer |
| ∗log2FC in expression of this searched gene in stem-like cells from each diseased tissue sample relative to stem-like cells in normal samples in each tissue plotted against the malignancy continuum. Samples are colored based on if they are from different disease stage. |
Top |
Malignant transformation related pathway analysis |
| Find out the enriched GO biological processes and KEGG pathways involved in transition from healthy to precancer to cancer |
| Tissue | Disease Stage | Enriched GO biological Processes |
| Colorectum | AD |  |
| Colorectum | SER |  |
| Colorectum | MSS |  |
| Colorectum | MSI-H |  |
| Colorectum | FAP |  |
| ∗Top 15 enriched GO BP terms are showed in the bar plot of each disease state in each tissue. Each row represents a significant GO biological process which is colored according to the -log10(p.adjust). |
| Page: 1 2 3 4 5 6 7 8 9 |
| GO ID | Tissue | Disease Stage | Description | Gene Ratio | Bg Ratio | pvalue | p.adjust | Count |
| GO:007149626 | Esophagus | HGIN | cellular response to external stimulus | 71/2587 | 320/18723 | 2.77e-05 | 7.19e-04 | 71 |
| GO:003166820 | Esophagus | HGIN | cellular response to extracellular stimulus | 56/2587 | 246/18723 | 9.05e-05 | 1.97e-03 | 56 |
| GO:003166920 | Esophagus | HGIN | cellular response to nutrient levels | 47/2587 | 215/18723 | 8.20e-04 | 1.07e-02 | 47 |
| GO:003166726 | Esophagus | HGIN | response to nutrient levels | 89/2587 | 474/18723 | 1.41e-03 | 1.64e-02 | 89 |
| GO:000926719 | Esophagus | HGIN | cellular response to starvation | 34/2587 | 156/18723 | 4.21e-03 | 3.77e-02 | 34 |
| GO:004259418 | Esophagus | HGIN | response to starvation | 41/2587 | 197/18723 | 4.34e-03 | 3.84e-02 | 41 |
| GO:0071496111 | Esophagus | ESCC | cellular response to external stimulus | 215/8552 | 320/18723 | 4.29e-15 | 2.43e-13 | 215 |
| GO:0031668111 | Esophagus | ESCC | cellular response to extracellular stimulus | 168/8552 | 246/18723 | 4.93e-13 | 2.23e-11 | 168 |
| GO:0031669110 | Esophagus | ESCC | cellular response to nutrient levels | 148/8552 | 215/18723 | 4.58e-12 | 1.76e-10 | 148 |
| GO:0031667111 | Esophagus | ESCC | response to nutrient levels | 289/8552 | 474/18723 | 9.25e-12 | 3.47e-10 | 289 |
| GO:0009267110 | Esophagus | ESCC | cellular response to starvation | 110/8552 | 156/18723 | 2.63e-10 | 7.37e-09 | 110 |
| GO:004259419 | Esophagus | ESCC | response to starvation | 133/8552 | 197/18723 | 4.31e-10 | 1.14e-08 | 133 |
| GO:19909284 | Esophagus | ESCC | response to amino acid starvation | 37/8552 | 49/18723 | 2.05e-05 | 1.78e-04 | 37 |
| GO:00319294 | Esophagus | ESCC | TOR signaling | 79/8552 | 126/18723 | 8.57e-05 | 6.21e-04 | 79 |
| GO:00341984 | Esophagus | ESCC | cellular response to amino acid starvation | 34/8552 | 46/18723 | 9.39e-05 | 6.70e-04 | 34 |
| GO:00320061 | Esophagus | ESCC | regulation of TOR signaling | 63/8552 | 104/18723 | 1.55e-03 | 7.29e-03 | 63 |
| GO:00320082 | Esophagus | ESCC | positive regulation of TOR signaling | 31/8552 | 47/18723 | 4.01e-03 | 1.62e-02 | 31 |
| GO:00316677 | Liver | NAFLD | response to nutrient levels | 85/1882 | 474/18723 | 8.23e-08 | 7.09e-06 | 85 |
| GO:00714967 | Liver | NAFLD | cellular response to external stimulus | 51/1882 | 320/18723 | 6.21e-04 | 8.18e-03 | 51 |
| GO:00425945 | Liver | NAFLD | response to starvation | 33/1882 | 197/18723 | 2.35e-03 | 2.21e-02 | 33 |
| Page: 1 2 3 4 |
| Pathway ID | Tissue | Disease Stage | Description | Gene Ratio | Bg Ratio | pvalue | p.adjust | qvalue | Count |
| hsa041505 | Esophagus | ESCC | mTOR signaling pathway | 98/4205 | 156/8465 | 5.81e-04 | 1.95e-03 | 9.97e-04 | 98 |
| hsa0415013 | Esophagus | ESCC | mTOR signaling pathway | 98/4205 | 156/8465 | 5.81e-04 | 1.95e-03 | 9.97e-04 | 98 |
| hsa041502 | Liver | HCC | mTOR signaling pathway | 95/4020 | 156/8465 | 4.70e-04 | 1.99e-03 | 1.11e-03 | 95 |
| hsa0415011 | Liver | HCC | mTOR signaling pathway | 95/4020 | 156/8465 | 4.70e-04 | 1.99e-03 | 1.11e-03 | 95 |
| hsa041504 | Oral cavity | OSCC | mTOR signaling pathway | 90/3704 | 156/8465 | 2.87e-04 | 9.15e-04 | 4.66e-04 | 90 |
| hsa0415012 | Oral cavity | OSCC | mTOR signaling pathway | 90/3704 | 156/8465 | 2.87e-04 | 9.15e-04 | 4.66e-04 | 90 |
| Page: 1 |
Top |
Cell-cell communication analysis |
| Identification of potential cell-cell interactions between two cell types and their ligand-receptor pairs for different disease states |
| Ligand | Receptor | LRpair | Pathway | Tissue | Disease Stage |
| Page: 1 |
Top |
Single-cell gene regulatory network inference analysis |
| Find out the significant the regulons (TFs) and the target genes of each regulon across cell types for different disease states |
| TF | Cell Type | Tissue | Disease Stage | Target Gene | RSS | Regulon Activity |
| ∗The dot plots of a searched regulon are shown for all cell subpopulations in each disease state of each tissue based on the regulon specific score inferred using pySCENIC and by calculating the average expression. |
| Page: 1 |
Top |
Somatic mutation of malignant transformation related genes |
| Annotation of somatic variants for genes involved in malignant transformation |
| Hugo Symbol | Variant Class | Variant Classification | dbSNP RS | HGVSc | HGVSp | HGVSp Short | SWISSPROT | BIOTYPE | SIFT | PolyPhen | Tumor Sample Barcode | Tissue | Histology | Sex | Age | Stage | Therapy Types | Drugs | Outcome |
| WDR59 | SNV | Missense_Mutation | c.613C>T | p.His205Tyr | p.H205Y | Q6PJI9 | protein_coding | tolerated(1) | benign(0) | TCGA-AO-A0J9-01 | Breast | breast invasive carcinoma | Female | <65 | III/IV | Chemotherapy | cyclophosphamide | PD | |
| WDR59 | SNV | Missense_Mutation | novel | c.227N>C | p.Tyr76Ser | p.Y76S | Q6PJI9 | protein_coding | tolerated(0.09) | benign(0.139) | TCGA-E2-A9RU-01 | Breast | breast invasive carcinoma | Female | >=65 | III/IV | Hormone Therapy | arimidex | SD |
| WDR59 | insertion | In_Frame_Ins | novel | c.637_638insGGC | p.Asp213delinsGlyHis | p.D213delinsGH | Q6PJI9 | protein_coding | TCGA-A2-A04V-01 | Breast | breast invasive carcinoma | Female | <65 | I/II | Chemotherapy | cytoxan | PD | ||
| WDR59 | insertion | Frame_Shift_Ins | novel | c.635_636insTGGGATGTTCACCCTTGGTCAGAATGATGGC | p.Gln212HisfsTer69 | p.Q212Hfs*69 | Q6PJI9 | protein_coding | TCGA-A2-A04V-01 | Breast | breast invasive carcinoma | Female | <65 | I/II | Chemotherapy | cytoxan | PD | ||
| WDR59 | insertion | Frame_Shift_Ins | novel | c.1826_1827insGCCTCCCG | p.Glu610ProfsTer62 | p.E610Pfs*62 | Q6PJI9 | protein_coding | TCGA-A7-A13E-01 | Breast | breast invasive carcinoma | Female | <65 | I/II | Targeted Molecular therapy | bevacizumab | PD | ||
| WDR59 | insertion | In_Frame_Ins | novel | c.1825_1826insTTCTTGTGCCTC | p.Lys609delinsIleLeuValProGln | p.K609delinsILVPQ | Q6PJI9 | protein_coding | TCGA-A7-A13E-01 | Breast | breast invasive carcinoma | Female | <65 | I/II | Targeted Molecular therapy | bevacizumab | PD | ||
| WDR59 | insertion | In_Frame_Ins | novel | c.1645_1646insCAGTACTAGGGAACACCTACATTACAC | p.Tyr549delinsSerValLeuGlyAsnThrTyrIleThrHis | p.Y549delinsSVLGNTYITH | Q6PJI9 | protein_coding | TCGA-AN-A049-01 | Breast | breast invasive carcinoma | Female | <65 | I/II | Unknown | Unknown | SD | ||
| WDR59 | insertion | Nonsense_Mutation | novel | c.1272_1273insATACAAAAAAGATAGATTTTTCTGTTAGTATAAAATGATA | p.His425IlefsTer5 | p.H425Ifs*5 | Q6PJI9 | protein_coding | TCGA-AN-A0FX-01 | Breast | breast invasive carcinoma | Female | <65 | I/II | Unknown | Unknown | SD | ||
| WDR59 | insertion | Nonsense_Mutation | novel | c.449_450insACATGCTGGGGAAGCCTTATGTGGCAGAAGCCCTCTGCCTTAGA | p.Ala151HisfsTer14 | p.A151Hfs*14 | Q6PJI9 | protein_coding | TCGA-AO-A0J7-01 | Breast | breast invasive carcinoma | Female | >=65 | I/II | Chemotherapy | doxorubicin | SD | ||
| WDR59 | insertion | Frame_Shift_Ins | novel | c.1364_1365insTAAGGTACTGACGTTTCTCATGGAGCAAGTGGTGTTGGGG | p.Thr456LysfsTer18 | p.T456Kfs*18 | Q6PJI9 | protein_coding | TCGA-AO-A0J9-01 | Breast | breast invasive carcinoma | Female | <65 | III/IV | Chemotherapy | cyclophosphamide | PD |
| Page: 1 2 3 4 5 6 7 8 9 10 11 |
Top |
Related drugs of malignant transformation related genes |
| Identification of chemicals and drugs interact with genes involved in malignant transfromation |
| (DGIdb 4.0) |
| Entrez ID | Symbol | Category | Interaction Types | Drug Claim Name | Drug Name | PMIDs |
| Page: 1 |

Copyright 2023-Present -The University of Texas Health Science Center at Houston |