
|
|||||
|
 | |
| |
| |
| |
| |
| |
|
Gene: WDR54 |
Gene summary for WDR54 |
| Gene information | Species | Human | Gene symbol | WDR54 | Gene ID | 84058 |
| Gene name | WD repeat domain 54 | |
| Gene Alias | WDR54 | |
| Cytomap | 2p13.1 | |
| Gene Type | protein-coding | GO ID | GO:0000165 | UniProtAcc | Q9H977 |
Top |
Malignant transformation analysis |
| Identification of the aberrant gene expression in precancerous and cancerous lesions by comparing the gene expression of stem-like cells in diseased tissues with normal stem cells |
| Entrez ID | Symbol | Replicates | Species | Organ | Tissue | Adj P-value | Log2FC | Malignancy |
| 84058 | WDR54 | LZE2T | Human | Esophagus | ESCC | 8.97e-03 | 3.23e-01 | 0.082 |
| 84058 | WDR54 | LZE4T | Human | Esophagus | ESCC | 2.53e-15 | 4.26e-01 | 0.0811 |
| 84058 | WDR54 | LZE7T | Human | Esophagus | ESCC | 2.24e-10 | 5.10e-01 | 0.0667 |
| 84058 | WDR54 | LZE8T | Human | Esophagus | ESCC | 1.88e-02 | 1.82e-01 | 0.067 |
| 84058 | WDR54 | LZE24T | Human | Esophagus | ESCC | 4.62e-18 | 5.89e-01 | 0.0596 |
| 84058 | WDR54 | LZE6T | Human | Esophagus | ESCC | 4.95e-02 | 2.11e-01 | 0.0845 |
| 84058 | WDR54 | P2T-E | Human | Esophagus | ESCC | 1.55e-29 | 7.02e-01 | 0.1177 |
| 84058 | WDR54 | P4T-E | Human | Esophagus | ESCC | 3.10e-31 | 6.83e-01 | 0.1323 |
| 84058 | WDR54 | P5T-E | Human | Esophagus | ESCC | 9.26e-44 | 9.80e-01 | 0.1327 |
| 84058 | WDR54 | P8T-E | Human | Esophagus | ESCC | 4.33e-05 | 1.43e-01 | 0.0889 |
| 84058 | WDR54 | P10T-E | Human | Esophagus | ESCC | 1.75e-17 | 4.70e-01 | 0.116 |
| 84058 | WDR54 | P11T-E | Human | Esophagus | ESCC | 1.26e-15 | 6.01e-01 | 0.1426 |
| 84058 | WDR54 | P12T-E | Human | Esophagus | ESCC | 3.36e-13 | 4.20e-01 | 0.1122 |
| 84058 | WDR54 | P15T-E | Human | Esophagus | ESCC | 7.89e-48 | 9.57e-01 | 0.1149 |
| 84058 | WDR54 | P16T-E | Human | Esophagus | ESCC | 6.26e-38 | 7.05e-01 | 0.1153 |
| 84058 | WDR54 | P17T-E | Human | Esophagus | ESCC | 6.50e-11 | 4.69e-01 | 0.1278 |
| 84058 | WDR54 | P19T-E | Human | Esophagus | ESCC | 2.47e-08 | 8.38e-01 | 0.1662 |
| 84058 | WDR54 | P20T-E | Human | Esophagus | ESCC | 6.43e-05 | 1.80e-01 | 0.1124 |
| 84058 | WDR54 | P21T-E | Human | Esophagus | ESCC | 4.75e-37 | 8.26e-01 | 0.1617 |
| 84058 | WDR54 | P22T-E | Human | Esophagus | ESCC | 2.99e-21 | 4.87e-01 | 0.1236 |
| Page: 1 2 3 4 5 6 |
| Tissue | Expression Dynamics | Abbreviation |
| Esophagus | 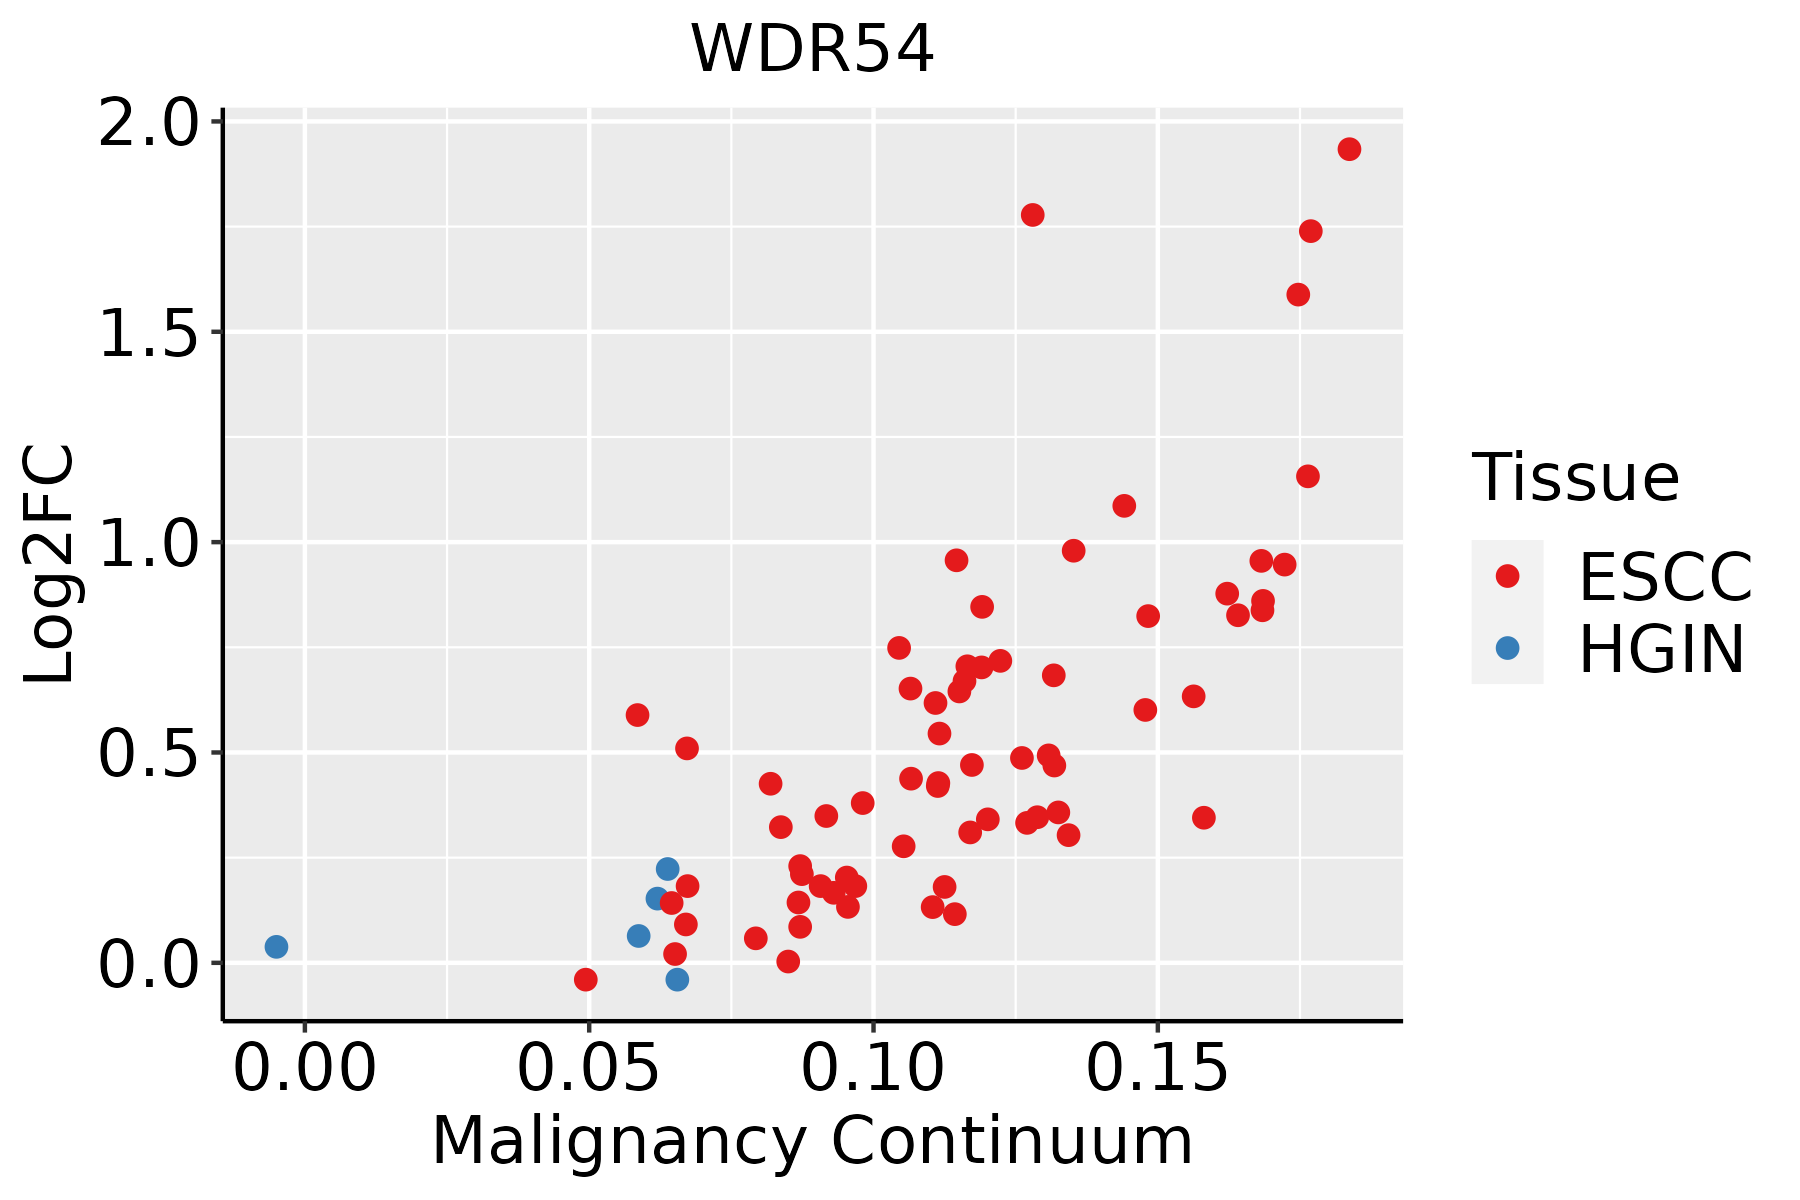 | ESCC: Esophageal squamous cell carcinoma |
| HGIN: High-grade intraepithelial neoplasias | ||
| LGIN: Low-grade intraepithelial neoplasias | ||
| Liver |  | HCC: Hepatocellular carcinoma |
| NAFLD: Non-alcoholic fatty liver disease | ||
| Oral Cavity |  | EOLP: Erosive Oral lichen planus |
| LP: leukoplakia | ||
| NEOLP: Non-erosive oral lichen planus | ||
| OSCC: Oral squamous cell carcinoma | ||
| Skin | 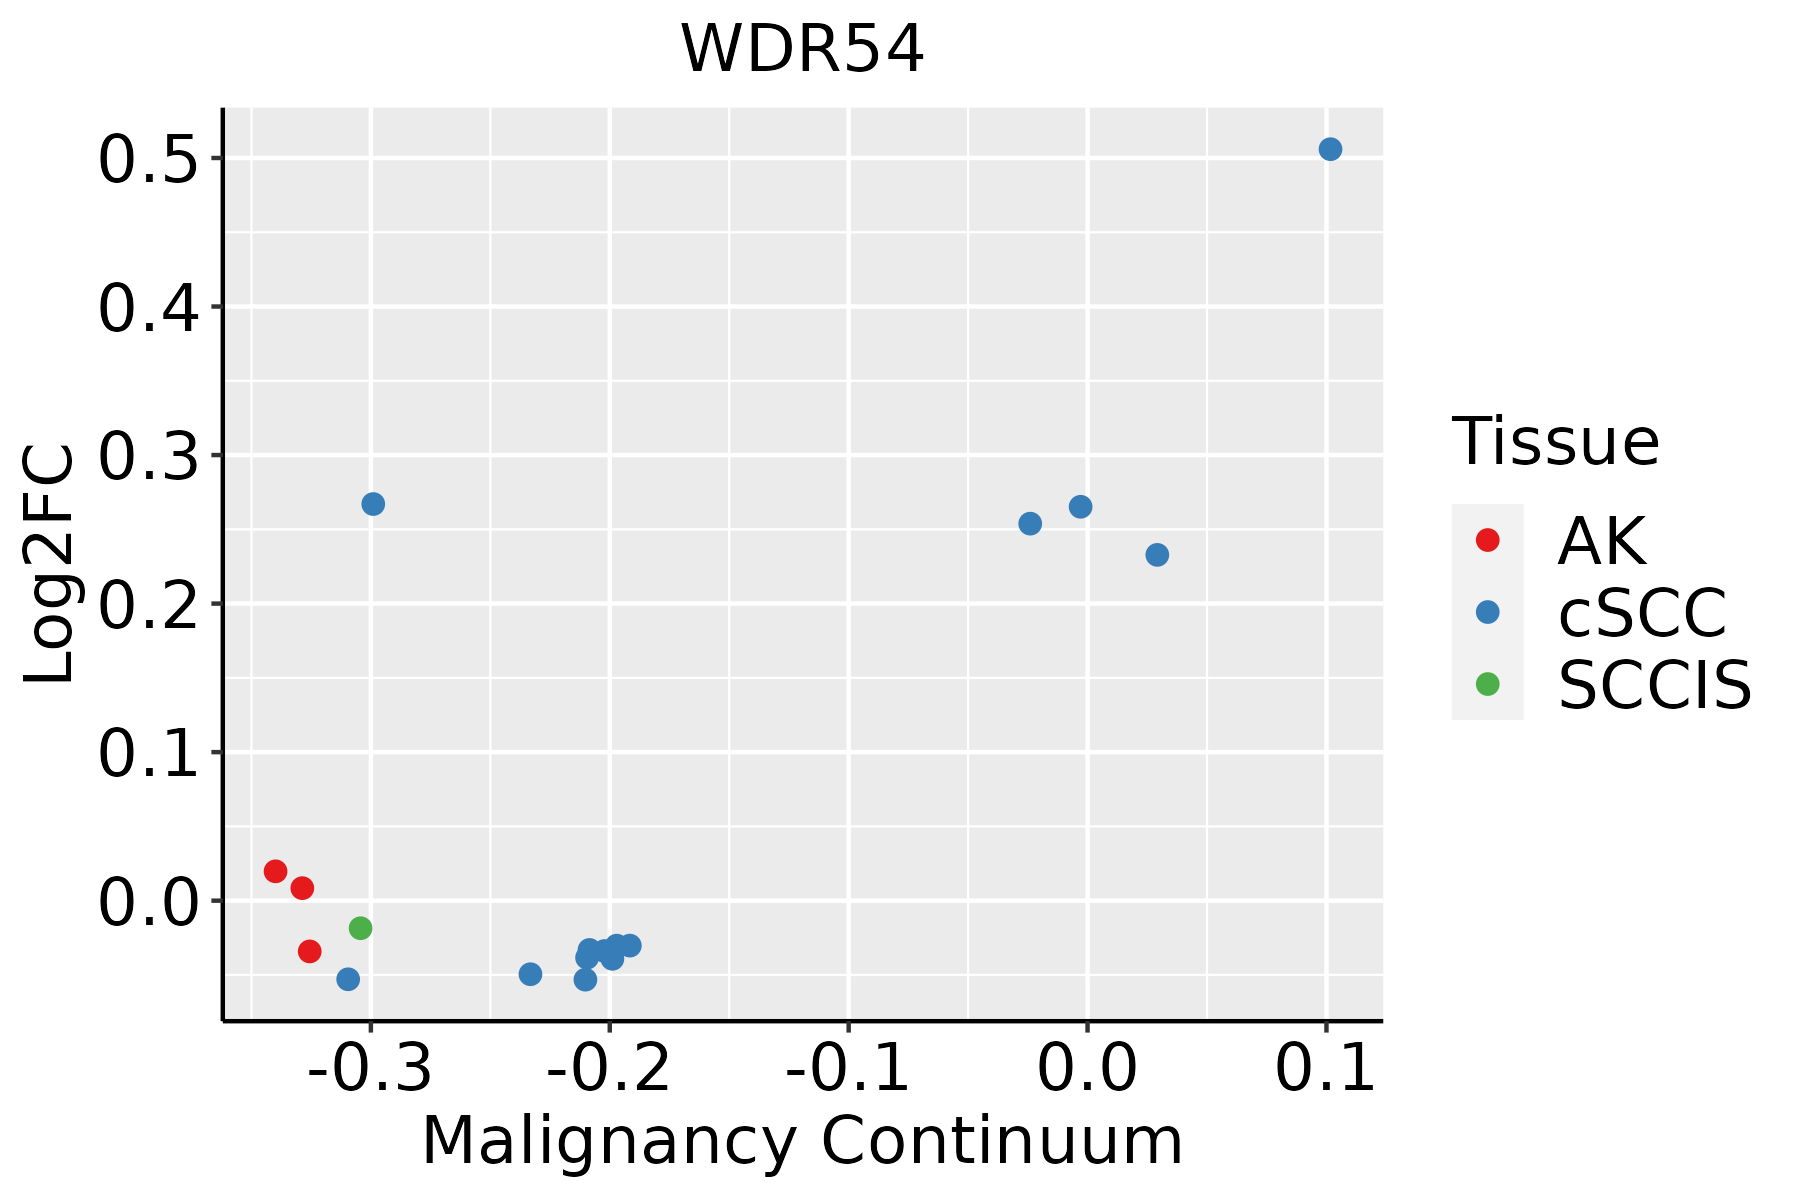 | AK: Actinic keratosis |
| cSCC: Cutaneous squamous cell carcinoma | ||
| SCCIS:squamous cell carcinoma in situ | ||
| Thyroid |  | ATC: Anaplastic thyroid cancer |
| HT: Hashimoto's thyroiditis | ||
| PTC: Papillary thyroid cancer |
| ∗log2FC in expression of this searched gene in stem-like cells from each diseased tissue sample relative to stem-like cells in normal samples in each tissue plotted against the malignancy continuum. Samples are colored based on if they are from different disease stage. |
Top |
Malignant transformation related pathway analysis |
| Find out the enriched GO biological processes and KEGG pathways involved in transition from healthy to precancer to cancer |
| Tissue | Disease Stage | Enriched GO biological Processes |
| Colorectum | AD |  |
| Colorectum | SER |  |
| Colorectum | MSS |  |
| Colorectum | MSI-H |  |
| Colorectum | FAP |  |
| ∗Top 15 enriched GO BP terms are showed in the bar plot of each disease state in each tissue. Each row represents a significant GO biological process which is colored according to the -log10(p.adjust). |
| Page: 1 2 3 4 5 6 7 8 9 |
| GO ID | Tissue | Disease Stage | Description | Gene Ratio | Bg Ratio | pvalue | p.adjust | Count |
| GO:003010018 | Esophagus | ESCC | regulation of endocytosis | 135/8552 | 211/18723 | 5.75e-08 | 1.02e-06 | 135 |
| GO:003812718 | Esophagus | ESCC | ERBB signaling pathway | 82/8552 | 121/18723 | 7.23e-07 | 9.40e-06 | 82 |
| GO:000717318 | Esophagus | ESCC | epidermal growth factor receptor signaling pathway | 73/8552 | 108/18723 | 3.36e-06 | 3.73e-05 | 73 |
| GO:004311218 | Esophagus | ESCC | receptor metabolic process | 104/8552 | 166/18723 | 7.44e-06 | 7.37e-05 | 104 |
| GO:190118413 | Esophagus | ESCC | regulation of ERBB signaling pathway | 54/8552 | 79/18723 | 3.81e-05 | 3.08e-04 | 54 |
| GO:000689818 | Esophagus | ESCC | receptor-mediated endocytosis | 142/8552 | 244/18723 | 5.22e-05 | 4.05e-04 | 142 |
| GO:00420588 | Esophagus | ESCC | regulation of epidermal growth factor receptor signaling pathway | 50/8552 | 73/18723 | 6.75e-05 | 5.12e-04 | 50 |
| GO:004825916 | Esophagus | ESCC | regulation of receptor-mediated endocytosis | 66/8552 | 110/18723 | 1.72e-03 | 7.96e-03 | 66 |
| GO:000689811 | Liver | Cirrhotic | receptor-mediated endocytosis | 91/4634 | 244/18723 | 8.13e-06 | 1.22e-04 | 91 |
| GO:003010011 | Liver | Cirrhotic | regulation of endocytosis | 74/4634 | 211/18723 | 4.86e-04 | 3.90e-03 | 74 |
| GO:003812711 | Liver | Cirrhotic | ERBB signaling pathway | 46/4634 | 121/18723 | 8.08e-04 | 5.93e-03 | 46 |
| GO:004311211 | Liver | Cirrhotic | receptor metabolic process | 59/4634 | 166/18723 | 1.19e-03 | 8.07e-03 | 59 |
| GO:00510514 | Liver | Cirrhotic | negative regulation of transport | 141/4634 | 470/18723 | 5.06e-03 | 2.62e-02 | 141 |
| GO:000717311 | Liver | Cirrhotic | epidermal growth factor receptor signaling pathway | 39/4634 | 108/18723 | 5.49e-03 | 2.79e-02 | 39 |
| GO:004825911 | Liver | Cirrhotic | regulation of receptor-mediated endocytosis | 39/4634 | 110/18723 | 7.76e-03 | 3.65e-02 | 39 |
| GO:004311221 | Liver | HCC | receptor metabolic process | 96/7958 | 166/18723 | 4.69e-05 | 4.50e-04 | 96 |
| GO:003812721 | Liver | HCC | ERBB signaling pathway | 73/7958 | 121/18723 | 5.65e-05 | 5.26e-04 | 73 |
| GO:000689821 | Liver | HCC | receptor-mediated endocytosis | 134/7958 | 244/18723 | 5.73e-05 | 5.31e-04 | 134 |
| GO:003010021 | Liver | HCC | regulation of endocytosis | 117/7958 | 211/18723 | 9.56e-05 | 8.32e-04 | 117 |
| GO:000717321 | Liver | HCC | epidermal growth factor receptor signaling pathway | 65/7958 | 108/18723 | 1.56e-04 | 1.25e-03 | 65 |
| Page: 1 2 3 4 |
| Pathway ID | Tissue | Disease Stage | Description | Gene Ratio | Bg Ratio | pvalue | p.adjust | qvalue | Count |
| Page: 1 |
Top |
Cell-cell communication analysis |
| Identification of potential cell-cell interactions between two cell types and their ligand-receptor pairs for different disease states |
| Ligand | Receptor | LRpair | Pathway | Tissue | Disease Stage |
| Page: 1 |
Top |
Single-cell gene regulatory network inference analysis |
| Find out the significant the regulons (TFs) and the target genes of each regulon across cell types for different disease states |
| TF | Cell Type | Tissue | Disease Stage | Target Gene | RSS | Regulon Activity |
| ∗The dot plots of a searched regulon are shown for all cell subpopulations in each disease state of each tissue based on the regulon specific score inferred using pySCENIC and by calculating the average expression. |
| Page: 1 |
Top |
Somatic mutation of malignant transformation related genes |
| Annotation of somatic variants for genes involved in malignant transformation |
| Hugo Symbol | Variant Class | Variant Classification | dbSNP RS | HGVSc | HGVSp | HGVSp Short | SWISSPROT | BIOTYPE | SIFT | PolyPhen | Tumor Sample Barcode | Tissue | Histology | Sex | Age | Stage | Therapy Types | Drugs | Outcome |
| WDR54 | SNV | Missense_Mutation | rs766235102 | c.985N>T | p.Arg329Trp | p.R329W | Q9H977 | protein_coding | tolerated(0.06) | benign(0) | TCGA-AN-A0AK-01 | Breast | breast invasive carcinoma | Female | >=65 | I/II | Unknown | Unknown | SD |
| WDR54 | SNV | Missense_Mutation | rs758143571 | c.434N>C | p.Phe145Ser | p.F145S | Q9H977 | protein_coding | deleterious(0) | probably_damaging(0.96) | TCGA-C8-A131-01 | Breast | breast invasive carcinoma | Female | >=65 | III/IV | Chemotherapy | 5-fluorouracil | CR |
| WDR54 | SNV | Missense_Mutation | rs779254262 | c.757C>T | p.Arg253Trp | p.R253W | Q9H977 | protein_coding | deleterious(0) | probably_damaging(0.999) | TCGA-S3-AA15-01 | Breast | breast invasive carcinoma | Female | <65 | I/II | Chemotherapy | adriamycin | CR |
| WDR54 | insertion | Frame_Shift_Ins | novel | c.880_881insCATCTGCGCCCTGG | p.His294ProfsTer32 | p.H294Pfs*32 | Q9H977 | protein_coding | TCGA-A7-A0CE-01 | Breast | breast invasive carcinoma | Female | <65 | I/II | Chemotherapy | adriamycin | SD | ||
| WDR54 | SNV | Missense_Mutation | novel | c.656N>G | p.Gln219Arg | p.Q219R | Q9H977 | protein_coding | tolerated(0.74) | benign(0) | TCGA-EA-A410-01 | Cervix | cervical & endocervical cancer | Female | <65 | I/II | Unknown | Unknown | SD |
| WDR54 | SNV | Missense_Mutation | novel | c.539N>A | p.Cys180Tyr | p.C180Y | Q9H977 | protein_coding | tolerated(0.52) | benign(0.001) | TCGA-5M-AAT6-01 | Colorectum | colon adenocarcinoma | Female | <65 | III/IV | Unknown | Unknown | PD |
| WDR54 | SNV | Missense_Mutation | rs557411396 | c.14A>G | p.Glu5Gly | p.E5G | Q9H977 | protein_coding | tolerated(0.05) | benign(0.081) | TCGA-AA-A02W-01 | Colorectum | colon adenocarcinoma | Female | >=65 | I/II | Unknown | Unknown | PD |
| WDR54 | SNV | Missense_Mutation | novel | c.16N>A | p.Arg6Ser | p.R6S | Q9H977 | protein_coding | tolerated(0.14) | benign(0.007) | TCGA-AY-4071-01 | Colorectum | colon adenocarcinoma | Female | <65 | I/II | Unknown | Unknown | SD |
| WDR54 | SNV | Missense_Mutation | rs754183319 | c.292G>A | p.Glu98Lys | p.E98K | Q9H977 | protein_coding | deleterious(0.03) | probably_damaging(0.945) | TCGA-EI-6917-01 | Colorectum | rectum adenocarcinoma | Male | <65 | III/IV | Chemotherapy | 5fluorouracil+oxaciplatina+l-folinian | SD |
| WDR54 | SNV | Missense_Mutation | novel | c.208C>T | p.Pro70Ser | p.P70S | Q9H977 | protein_coding | tolerated(1) | benign(0) | TCGA-AP-A059-01 | Endometrium | uterine corpus endometrioid carcinoma | Female | >=65 | I/II | Unknown | Unknown | SD |
| Page: 1 2 3 4 |
Top |
Related drugs of malignant transformation related genes |
| Identification of chemicals and drugs interact with genes involved in malignant transfromation |
| (DGIdb 4.0) |
| Entrez ID | Symbol | Category | Interaction Types | Drug Claim Name | Drug Name | PMIDs |
| Page: 1 |

Copyright 2023-Present -The University of Texas Health Science Center at Houston |