
|
|||||
|
 | |
| |
| |
| |
| |
| |
|
Gene: WDR53 |
Gene summary for WDR53 |
| Gene information | Species | Human | Gene symbol | WDR53 | Gene ID | 348793 |
| Gene name | WD repeat domain 53 | |
| Gene Alias | WDR53 | |
| Cytomap | 3q29 | |
| Gene Type | protein-coding | GO ID | NA | UniProtAcc | Q7Z5U6 |
Top |
Malignant transformation analysis |
| Identification of the aberrant gene expression in precancerous and cancerous lesions by comparing the gene expression of stem-like cells in diseased tissues with normal stem cells |
| Entrez ID | Symbol | Replicates | Species | Organ | Tissue | Adj P-value | Log2FC | Malignancy |
| 348793 | WDR53 | LZE4T | Human | Esophagus | ESCC | 8.65e-04 | 1.50e-01 | 0.0811 |
| 348793 | WDR53 | LZE24T | Human | Esophagus | ESCC | 1.09e-12 | 1.49e-01 | 0.0596 |
| 348793 | WDR53 | LZE6T | Human | Esophagus | ESCC | 1.92e-02 | 2.13e-01 | 0.0845 |
| 348793 | WDR53 | P2T-E | Human | Esophagus | ESCC | 3.67e-18 | 3.33e-01 | 0.1177 |
| 348793 | WDR53 | P4T-E | Human | Esophagus | ESCC | 4.61e-12 | 3.47e-01 | 0.1323 |
| 348793 | WDR53 | P5T-E | Human | Esophagus | ESCC | 4.71e-16 | 1.90e-01 | 0.1327 |
| 348793 | WDR53 | P8T-E | Human | Esophagus | ESCC | 5.71e-07 | 1.09e-01 | 0.0889 |
| 348793 | WDR53 | P9T-E | Human | Esophagus | ESCC | 2.18e-05 | 1.93e-01 | 0.1131 |
| 348793 | WDR53 | P10T-E | Human | Esophagus | ESCC | 4.50e-11 | 2.06e-01 | 0.116 |
| 348793 | WDR53 | P11T-E | Human | Esophagus | ESCC | 1.24e-10 | 3.54e-01 | 0.1426 |
| 348793 | WDR53 | P12T-E | Human | Esophagus | ESCC | 1.94e-08 | 1.42e-01 | 0.1122 |
| 348793 | WDR53 | P15T-E | Human | Esophagus | ESCC | 5.25e-15 | 2.88e-01 | 0.1149 |
| 348793 | WDR53 | P16T-E | Human | Esophagus | ESCC | 1.67e-10 | 1.59e-01 | 0.1153 |
| 348793 | WDR53 | P20T-E | Human | Esophagus | ESCC | 5.29e-05 | 1.30e-01 | 0.1124 |
| 348793 | WDR53 | P21T-E | Human | Esophagus | ESCC | 5.69e-06 | 1.29e-01 | 0.1617 |
| 348793 | WDR53 | P22T-E | Human | Esophagus | ESCC | 4.64e-15 | 2.31e-01 | 0.1236 |
| 348793 | WDR53 | P23T-E | Human | Esophagus | ESCC | 4.49e-14 | 3.27e-01 | 0.108 |
| 348793 | WDR53 | P24T-E | Human | Esophagus | ESCC | 1.49e-06 | 1.44e-01 | 0.1287 |
| 348793 | WDR53 | P26T-E | Human | Esophagus | ESCC | 9.65e-16 | 2.37e-01 | 0.1276 |
| 348793 | WDR53 | P27T-E | Human | Esophagus | ESCC | 1.63e-07 | 2.08e-01 | 0.1055 |
| Page: 1 2 3 4 |
| Tissue | Expression Dynamics | Abbreviation |
| Esophagus | 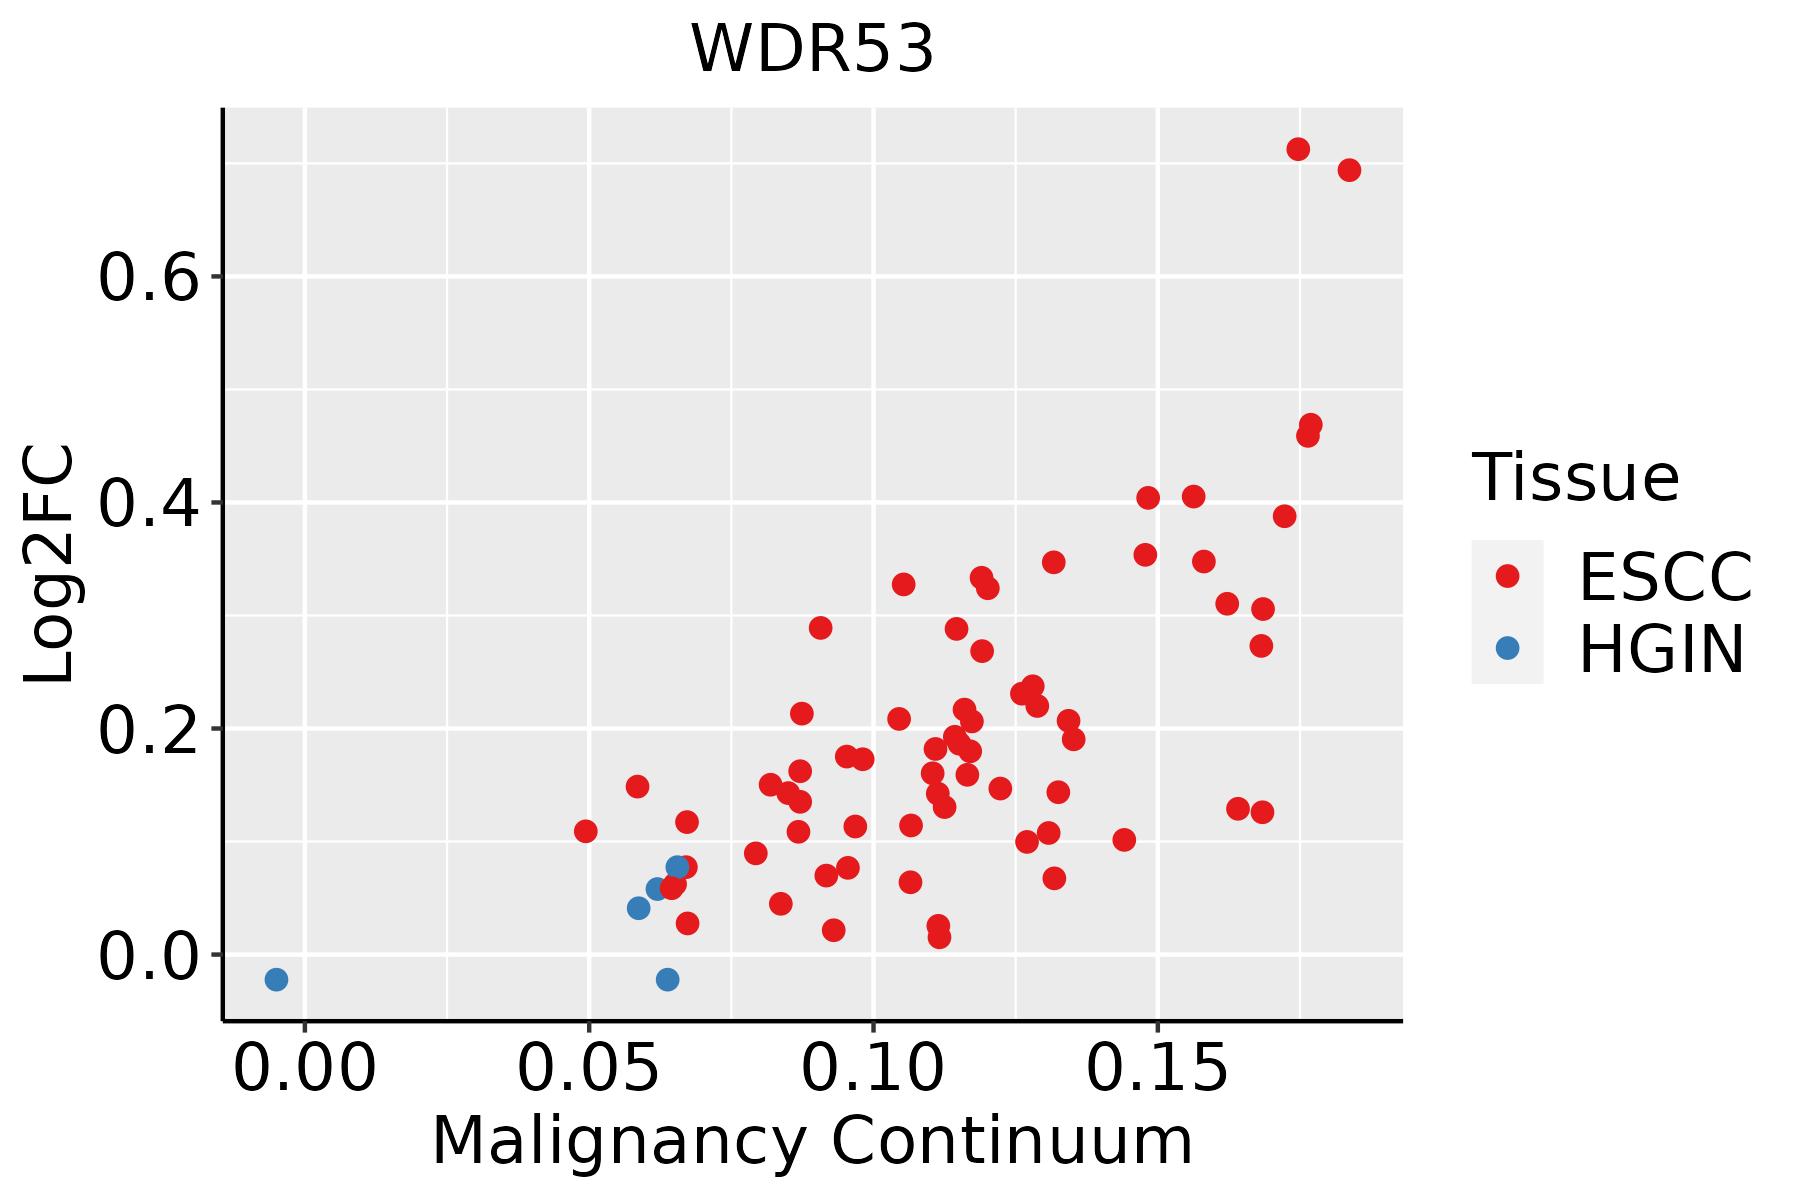 | ESCC: Esophageal squamous cell carcinoma |
| HGIN: High-grade intraepithelial neoplasias | ||
| LGIN: Low-grade intraepithelial neoplasias | ||
| Oral Cavity |  | EOLP: Erosive Oral lichen planus |
| LP: leukoplakia | ||
| NEOLP: Non-erosive oral lichen planus | ||
| OSCC: Oral squamous cell carcinoma |
| ∗log2FC in expression of this searched gene in stem-like cells from each diseased tissue sample relative to stem-like cells in normal samples in each tissue plotted against the malignancy continuum. Samples are colored based on if they are from different disease stage. |
Top |
Malignant transformation related pathway analysis |
| Find out the enriched GO biological processes and KEGG pathways involved in transition from healthy to precancer to cancer |
| Tissue | Disease Stage | Enriched GO biological Processes |
| Colorectum | AD |  |
| Colorectum | SER |  |
| Colorectum | MSS |  |
| Colorectum | MSI-H |  |
| Colorectum | FAP |  |
| ∗Top 15 enriched GO BP terms are showed in the bar plot of each disease state in each tissue. Each row represents a significant GO biological process which is colored according to the -log10(p.adjust). |
| Page: 1 2 3 4 5 6 7 8 9 |
| GO ID | Tissue | Disease Stage | Description | Gene Ratio | Bg Ratio | pvalue | p.adjust | Count |
| Page: 1 |
| Pathway ID | Tissue | Disease Stage | Description | Gene Ratio | Bg Ratio | pvalue | p.adjust | qvalue | Count |
| Page: 1 |
Top |
Cell-cell communication analysis |
| Identification of potential cell-cell interactions between two cell types and their ligand-receptor pairs for different disease states |
| Ligand | Receptor | LRpair | Pathway | Tissue | Disease Stage |
| Page: 1 |
Top |
Single-cell gene regulatory network inference analysis |
| Find out the significant the regulons (TFs) and the target genes of each regulon across cell types for different disease states |
| TF | Cell Type | Tissue | Disease Stage | Target Gene | RSS | Regulon Activity |
| ∗The dot plots of a searched regulon are shown for all cell subpopulations in each disease state of each tissue based on the regulon specific score inferred using pySCENIC and by calculating the average expression. |
| Page: 1 |
Top |
Somatic mutation of malignant transformation related genes |
| Annotation of somatic variants for genes involved in malignant transformation |
| Hugo Symbol | Variant Class | Variant Classification | dbSNP RS | HGVSc | HGVSp | HGVSp Short | SWISSPROT | BIOTYPE | SIFT | PolyPhen | Tumor Sample Barcode | Tissue | Histology | Sex | Age | Stage | Therapy Types | Drugs | Outcome |
| WDR53 | SNV | Missense_Mutation | c.908A>G | p.Asn303Ser | p.N303S | Q7Z5U6 | protein_coding | tolerated(0.89) | benign(0) | TCGA-A8-A09Z-01 | Breast | breast invasive carcinoma | Female | >=65 | I/II | Unknown | Unknown | SD | |
| WDR53 | insertion | Nonsense_Mutation | novel | c.141_142insATCTGATAACTTTCTTGTT | p.Phe48IlefsTer2 | p.F48Ifs*2 | Q7Z5U6 | protein_coding | TCGA-AR-A0U0-01 | Breast | breast invasive carcinoma | Female | >=65 | I/II | Unknown | Unknown | SD | ||
| WDR53 | SNV | Missense_Mutation | c.473N>G | p.Asp158Gly | p.D158G | Q7Z5U6 | protein_coding | deleterious(0) | probably_damaging(1) | TCGA-BI-A20A-01 | Cervix | cervical & endocervical cancer | Female | <65 | I/II | Unknown | Unknown | SD | |
| WDR53 | SNV | Missense_Mutation | c.148N>T | p.Gly50Trp | p.G50W | Q7Z5U6 | protein_coding | deleterious(0) | probably_damaging(0.985) | TCGA-AD-5900-01 | Colorectum | colon adenocarcinoma | Male | >=65 | I/II | Unknown | Unknown | SD | |
| WDR53 | SNV | Missense_Mutation | c.796N>G | p.Thr266Ala | p.T266A | Q7Z5U6 | protein_coding | tolerated(0.95) | benign(0.003) | TCGA-CK-6746-01 | Colorectum | colon adenocarcinoma | Female | >=65 | I/II | Unknown | Unknown | SD | |
| WDR53 | SNV | Missense_Mutation | c.97N>G | p.Leu33Val | p.L33V | Q7Z5U6 | protein_coding | tolerated(0.31) | benign(0.232) | TCGA-QL-A97D-01 | Colorectum | colon adenocarcinoma | Female | >=65 | I/II | Unknown | Unknown | SD | |
| WDR53 | SNV | Missense_Mutation | novel | c.905C>A | p.Thr302Asn | p.T302N | Q7Z5U6 | protein_coding | tolerated(0.49) | benign(0.024) | TCGA-T9-A92H-01 | Colorectum | colon adenocarcinoma | Male | >=65 | I/II | Unknown | Unknown | PD |
| WDR53 | SNV | Missense_Mutation | rs756604044 | c.140N>A | p.Arg47Gln | p.R47Q | Q7Z5U6 | protein_coding | tolerated(0.95) | benign(0) | TCGA-WS-AB45-01 | Colorectum | colon adenocarcinoma | Female | <65 | I/II | Unknown | Unknown | SD |
| WDR53 | SNV | Missense_Mutation | novel | c.859N>T | p.Arg287Trp | p.R287W | Q7Z5U6 | protein_coding | deleterious(0) | possibly_damaging(0.763) | TCGA-AG-A00Y-01 | Colorectum | rectum adenocarcinoma | Male | >=65 | I/II | Unknown | Unknown | PD |
| WDR53 | insertion | Frame_Shift_Ins | novel | c.155_156insGTCTAGGATTT | p.Asp52GlufsTer45 | p.D52Efs*45 | Q7Z5U6 | protein_coding | TCGA-AM-5820-01 | Colorectum | colon adenocarcinoma | Female | <65 | I/II | Unknown | Unknown | SD |
| Page: 1 2 3 4 5 |
Top |
Related drugs of malignant transformation related genes |
| Identification of chemicals and drugs interact with genes involved in malignant transfromation |
| (DGIdb 4.0) |
| Entrez ID | Symbol | Category | Interaction Types | Drug Claim Name | Drug Name | PMIDs |
| Page: 1 |

Copyright 2023-Present -The University of Texas Health Science Center at Houston |